The same plot in 13 other libraries — Python: Altair, lets-plot, Matplotlib, Plotly, plotnine, Pygal, Seaborn; R: ggplot2; Julia: Makie.jl; JavaScript: Chart.js, D3.js, Apache ECharts, MUI X Charts. Compare all 14 side by side: 3D Bar Chart for Categorical Comparison in Python, R, Julia and JavaScript.
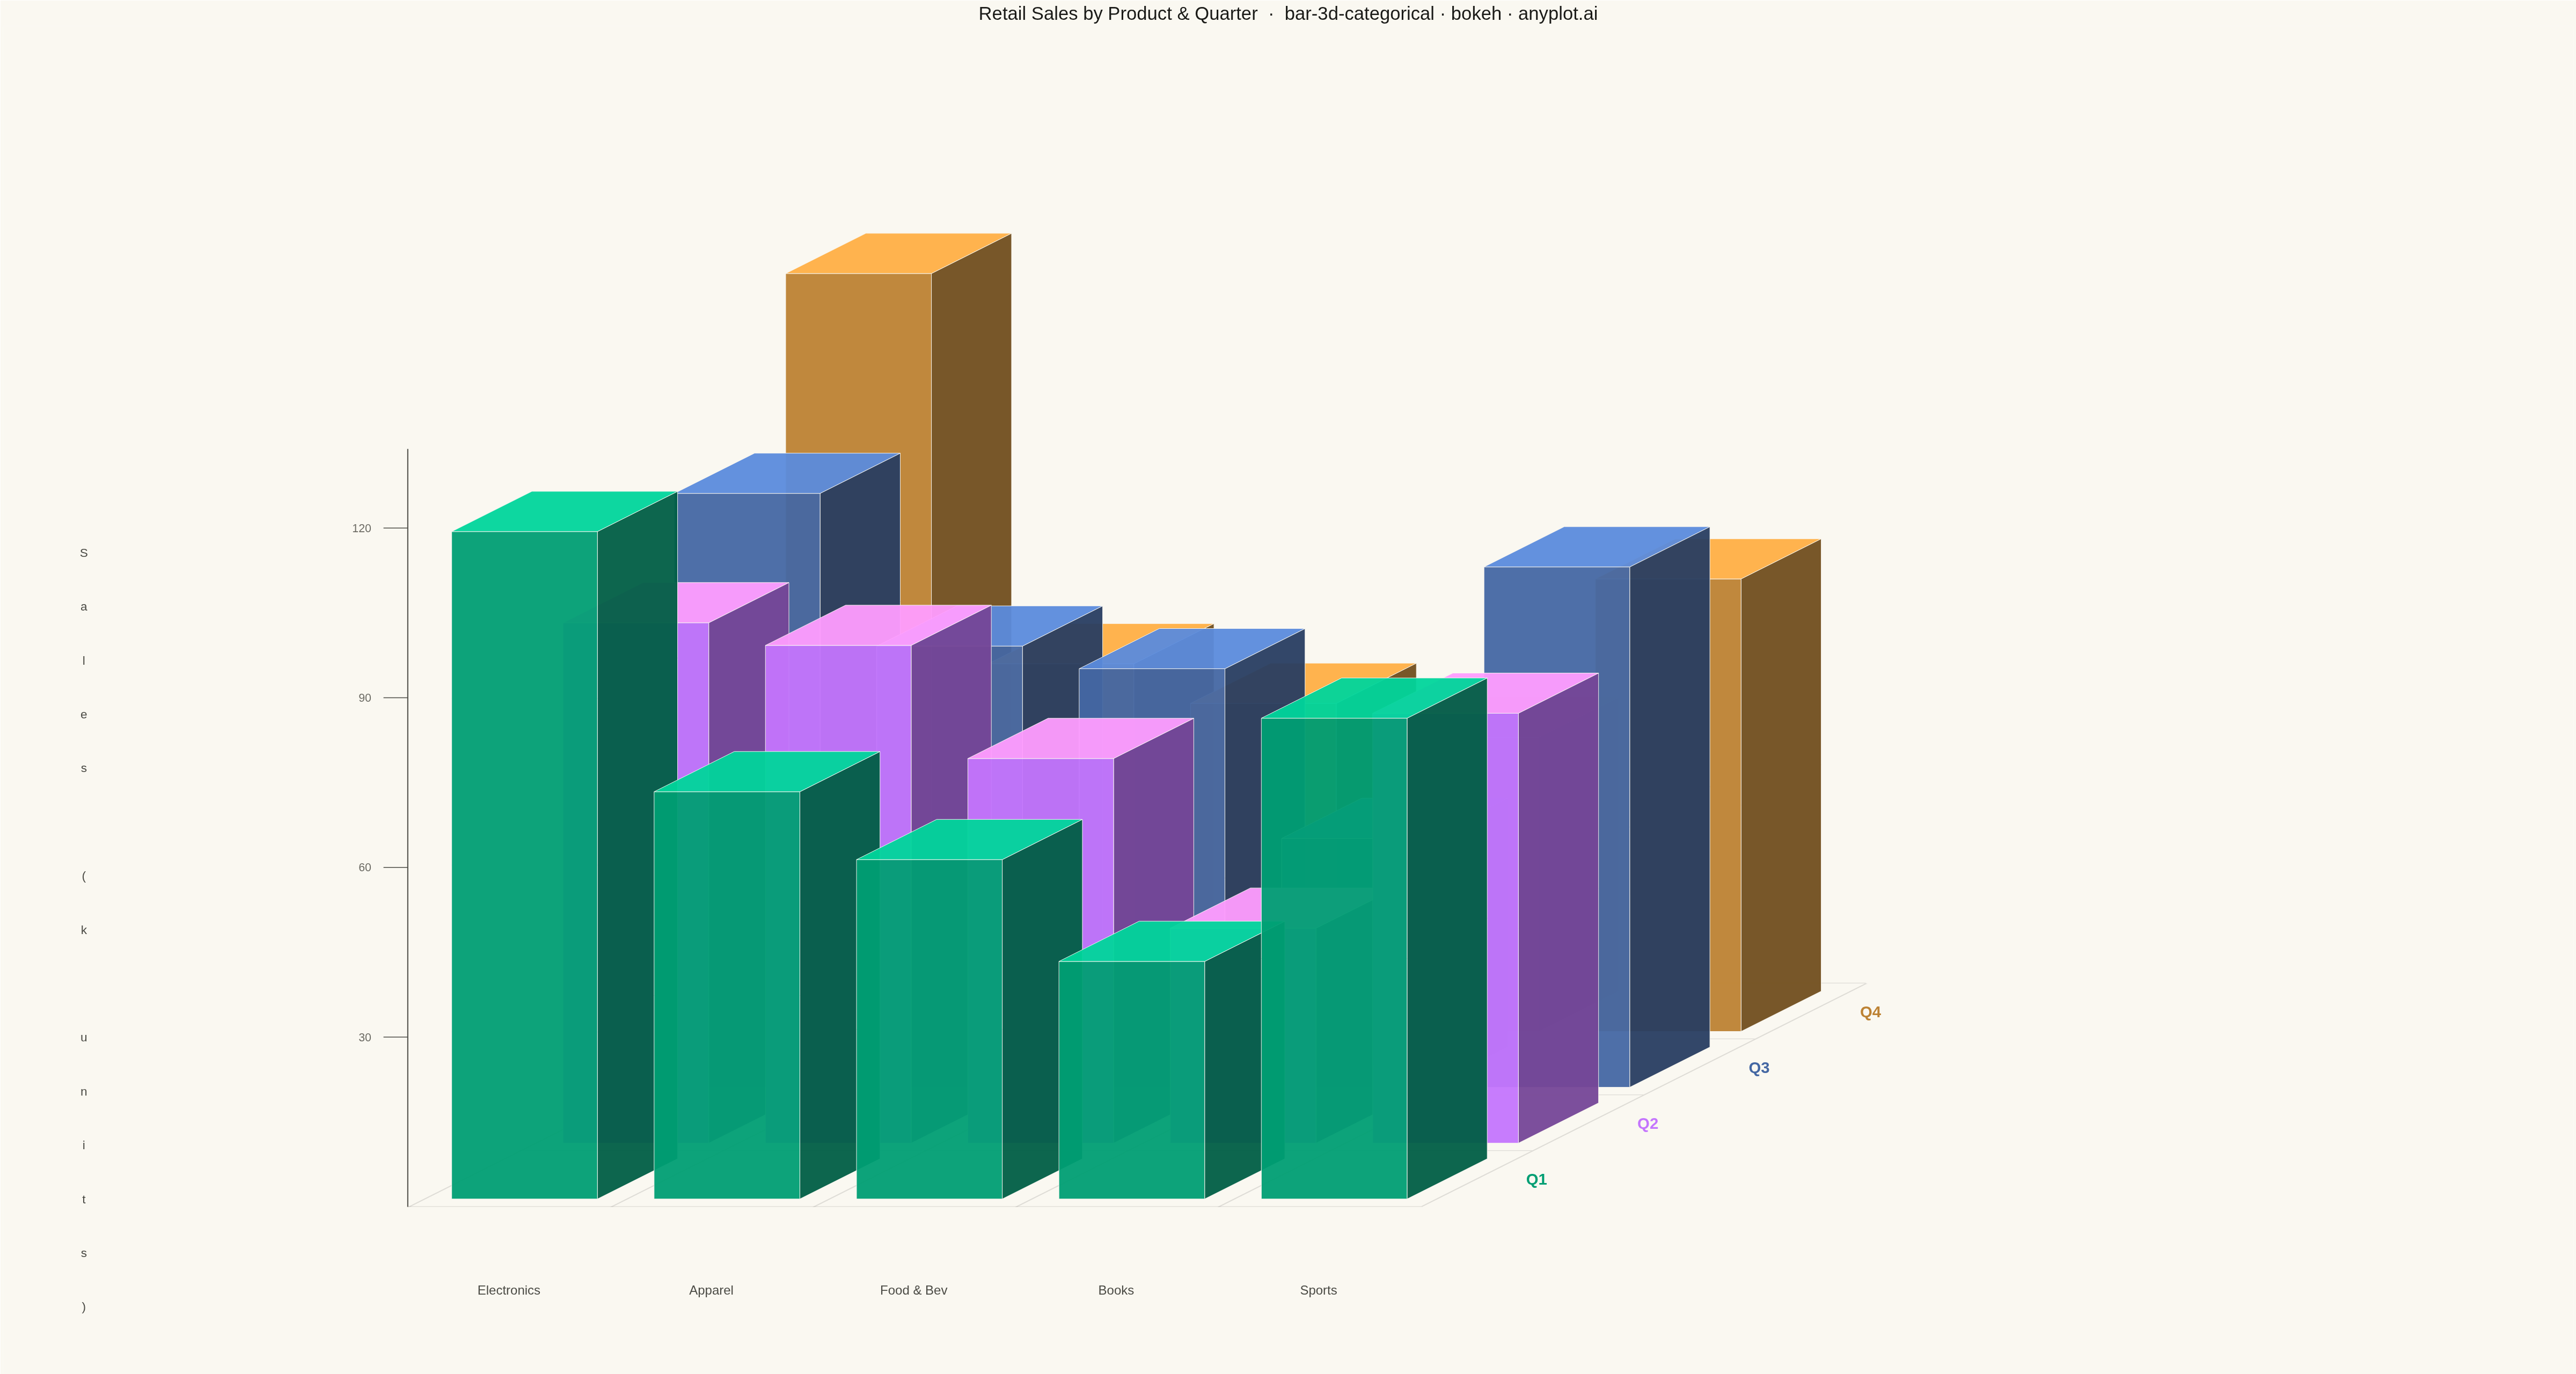
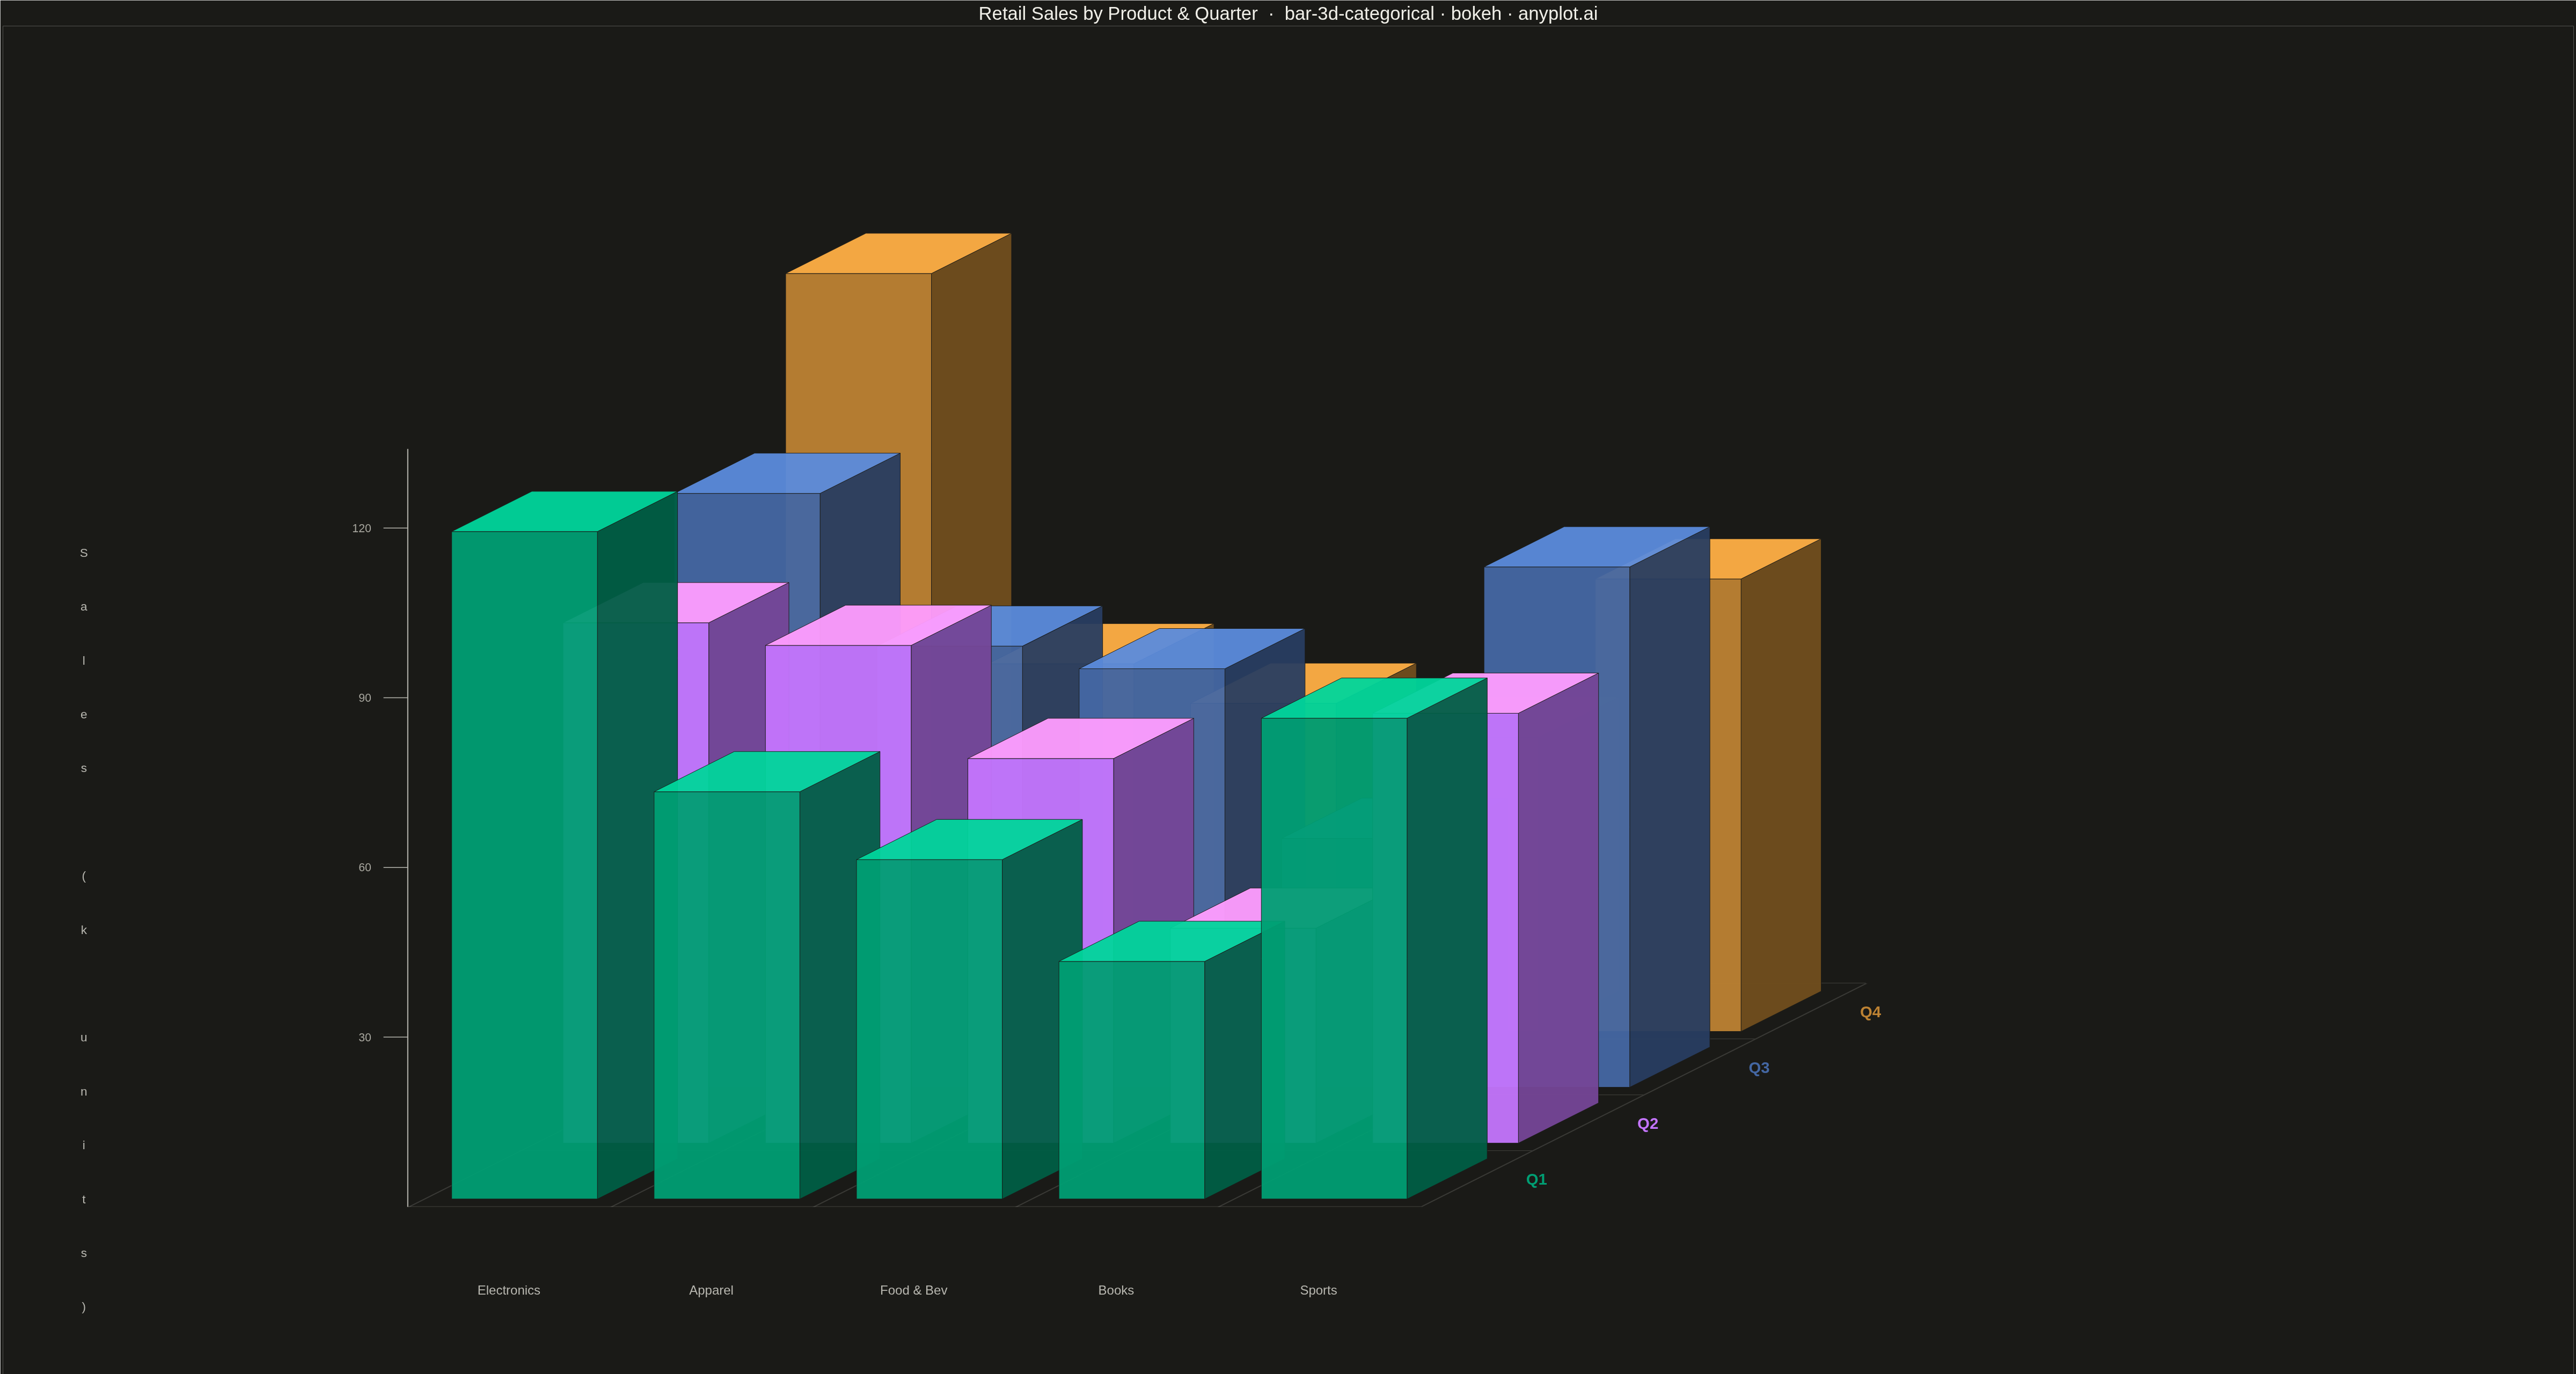
A three-dimensional bar chart where bars rise from a 2D categorical grid, with height encoding the measured value. Two categorical axes define the grid position on the base plane while the vertical axis shows magnitude. This visualization extends the bar chart family into 3D space, making it effective for comparing values across two categorical dimensions simultaneously.
""" anyplot.ai
bar-3d-categorical: 3D Bar Chart for Categorical Comparison
Library: bokeh 3.9.0 | Python 3.13.13
Quality: 86/100 | Created: 2026-05-15
"""

import os
import sys


# Prevent this file (bokeh.py) from shadowing the installed bokeh package
_this_dir = os.path.dirname(os.path.abspath(__file__))
if _this_dir in sys.path:
    sys.path.remove(_this_dir)

import time
from pathlib import Path

import numpy as np
from bokeh.io import output_file, save
from bokeh.models import ColumnDataSource, Label
from bokeh.plotting import figure
from selenium import webdriver
from selenium.webdriver.chrome.options import Options


# Theme tokens
THEME = os.getenv("ANYPLOT_THEME", "light")
PAGE_BG = "#FAF8F1" if THEME == "light" else "#1A1A17"
ELEVATED_BG = "#FFFDF6" if THEME == "light" else "#242420"
INK = "#1A1A17" if THEME == "light" else "#F0EFE8"
INK_SOFT = "#4A4A44" if THEME == "light" else "#B8B7B0"
INK_MUTED = "#6B6A63" if THEME == "light" else "#A8A79F"

IMPRINT = ["#009E73", "#C475FD", "#4467A3", "#BD8233"]

# Data: retail sales by product category and quarter (units in thousands)
np.random.seed(42)

products = ["Electronics", "Apparel", "Food & Bev", "Books", "Sports"]
quarters = ["Q1", "Q2", "Q3", "Q4"]

n_prod = len(products)
n_qtr = len(quarters)

sales = np.array(
    [
        [118, 92, 105, 134],  # Electronics
        [72, 88, 78, 65],  # Apparel
        [60, 68, 74, 58],  # Food & Bev
        [42, 38, 44, 52],  # Books
        [85, 76, 92, 80],  # Sports
    ]
)

v_max = sales.max()
H_SCALE = 3.8  # max bar height in projected coordinate units
DX = 0.55  # oblique x-offset per depth unit
DY = 0.28  # oblique y-offset per depth unit


def project(x, y, z):
    return x + y * DX, z + y * DY


def hex_darken(hex_color, f=0.60):
    h = hex_color.lstrip("#")
    r, g, b = int(h[0:2], 16), int(h[2:4], 16), int(h[4:6], 16)
    return f"#{int(r * f):02x}{int(g * f):02x}{int(b * f):02x}"


def hex_lighten(hex_color, f=1.35):
    h = hex_color.lstrip("#")
    r, g, b = int(h[0:2], 16), int(h[2:4], 16), int(h[4:6], 16)
    return f"#{min(255, int(r * f)):02x}{min(255, int(g * f)):02x}{min(255, int(b * f)):02x}"


bar_w = 0.72
gap = (1.0 - bar_w) / 2.0

# Build base-plane grid patches (subtle)
grid_xs, grid_ys, grid_cs = [], [], []

GRID_COLOR = "#1A1A17" if THEME == "light" else "#F0EFE8"

# Base plane grid lines (as thin quads)
grid_thick = 0.012
for j in range(n_qtr + 1):
    # Horizontal grid line at depth j (from i=0 to i=n_prod)
    c0 = project(0, j, 0)
    c1 = project(n_prod, j, 0)
    c2 = project(n_prod, j + grid_thick, 0)
    c3 = project(0, j + grid_thick, 0)
    grid_xs.append([c0[0], c1[0], c2[0], c3[0]])
    grid_ys.append([c0[1], c1[1], c2[1], c3[1]])
    grid_cs.append(GRID_COLOR)

for i in range(n_prod + 1):
    # Depth grid line at product i
    c0 = project(i, 0, 0)
    c1 = project(i, n_qtr, 0)
    c2 = project(i + grid_thick, n_qtr, 0)
    c3 = project(i + grid_thick, 0, 0)
    grid_xs.append([c0[0], c1[0], c2[0], c3[0]])
    grid_ys.append([c0[1], c1[1], c2[1], c3[1]])
    grid_cs.append(GRID_COLOR)

# Build bar patches — painter's algorithm: back (large j) to front (small j)
bar_xs, bar_ys, bar_cs = [], [], []


def add_patch(corners, color):
    bar_xs.append([project(*c)[0] for c in corners])
    bar_ys.append([project(*c)[1] for c in corners])
    bar_cs.append(color)


for j in range(n_qtr - 1, -1, -1):
    for i in range(n_prod):
        v = sales[i, j]
        h = v / v_max * H_SCALE
        color = IMPRINT[j]
        x0, x1 = i + gap, i + gap + bar_w
        y0, y1 = j + gap, j + gap + bar_w

        # Right (side) face — darker shade
        add_patch([(x1, y0, 0), (x1, y1, 0), (x1, y1, h), (x1, y0, h)], hex_darken(color))
        # Front face — base color
        add_patch([(x0, y0, 0), (x1, y0, 0), (x1, y0, h), (x0, y0, h)], color)
        # Top face — lighter shade
        add_patch([(x0, y0, h), (x1, y0, h), (x1, y1, h), (x0, y1, h)], hex_lighten(color))

# Figure coordinate ranges
x_max = n_prod + n_qtr * DX + 3.5
y_min = -1.2
y_max = H_SCALE + n_qtr * DY + 1.0

p = figure(
    width=4800,
    height=2700,
    title="Retail Sales by Product & Quarter  ·  bar-3d-categorical · bokeh · anyplot.ai",
    x_range=(-2.0, x_max),
    y_range=(y_min, y_max),
    toolbar_location=None,
)

# Draw base-plane grid first (behind bars)
src_grid = ColumnDataSource({"xs": grid_xs, "ys": grid_ys, "cs": grid_cs})
p.patches("xs", "ys", source=src_grid, color="cs", alpha=0.12 if THEME == "light" else 0.15, line_color=None)

# Draw bars
src_bars = ColumnDataSource({"xs": bar_xs, "ys": bar_ys, "cs": bar_cs})
p.patches("xs", "ys", source=src_bars, color="cs", line_color=PAGE_BG, line_width=1.0, alpha=0.95)

# Value axis vertical line
ax_x0, ax_y0 = project(0, 0, 0)
ax_x1, ax_y1 = project(0, 0, H_SCALE)
p.line([ax_x0, ax_x1], [ax_y0, ax_y1], line_color=INK_SOFT, line_width=2)

# Value axis ticks and labels
for v_tick in [30, 60, 90, 120]:
    h_tick = v_tick / v_max * H_SCALE
    tx, ty = project(0, 0, h_tick)
    # Tick mark
    p.line([tx - 0.12, tx], [ty, ty], line_color=INK_SOFT, line_width=1.5)
    # Label
    lbl = Label(
        x=tx - 0.18,
        y=ty,
        text=str(v_tick),
        text_align="right",
        text_baseline="middle",
        text_color=INK_MUTED,
        text_font_size="16pt",
    )
    p.add_layout(lbl)

# Axis title (rotated) — placed manually
for dy_step, ch in enumerate("Sales (k units)"):
    lbl = Label(
        x=-1.6,
        y=0.05 + H_SCALE * 0.85 - dy_step * 0.27,
        text=ch,
        text_align="center",
        text_baseline="middle",
        text_color=INK_SOFT,
        text_font_size="17pt",
    )
    p.add_layout(lbl)

# Product labels (front axis)
for i, prod in enumerate(products):
    px, py = project(i + 0.5, 0, 0)
    lbl = Label(
        x=px,
        y=py - 0.38,
        text=prod,
        text_align="center",
        text_baseline="top",
        text_color=INK_SOFT,
        text_font_size="18pt",
    )
    p.add_layout(lbl)

# Quarter labels (depth axis, right side, colored per series)
for j, qtr in enumerate(quarters):
    px, py = project(n_prod + 0.25, j + 0.5, 0)
    lbl = Label(
        x=px,
        y=py,
        text=qtr,
        text_align="left",
        text_baseline="middle",
        text_color=IMPRINT[j],
        text_font_size="22pt",
        text_font_style="bold",
    )
    p.add_layout(lbl)

# Theme chrome
p.background_fill_color = PAGE_BG
p.border_fill_color = PAGE_BG
p.outline_line_color = None

p.title.text_color = INK
p.title.text_font_size = "26pt"
p.title.text_font_style = "normal"
p.title.align = "center"

p.xaxis.visible = False
p.yaxis.visible = False
p.xgrid.visible = False
p.ygrid.visible = False

# Save HTML
output_file(f"plot-{THEME}.html")
save(p)

# Screenshot with headless Chrome via Selenium
W, H = 4800, 2700
opts = Options()
for arg in (
    "--headless=new",
    "--no-sandbox",
    "--disable-dev-shm-usage",
    "--disable-gpu",
    f"--window-size={W},{H}",
    "--hide-scrollbars",
):
    opts.add_argument(arg)

driver = webdriver.Chrome(options=opts)
driver.set_window_size(W, H)
driver.get(f"file://{Path(f'plot-{THEME}.html').resolve()}")
time.sleep(3)
driver.save_screenshot(f"plot-{THEME}.png")
driver.quit()
Runnable source as JSON, for any HTTP client: https://api.anyplot.ai/specs/bar-3d-categorical/bokeh/code. Any spec id and library id listed in llms-full.txt fit the same URL shape; every URL below is complete and callable.
{
  "spec_id": "bar-3d-categorical",
  "language": "python",
  "library": "bokeh",
  "page": "https://anyplot.ai/bar-3d-categorical/python/bokeh",
  "hub": "https://anyplot.ai/bar-3d-categorical",
  "code_json": "https://api.anyplot.ai/specs/bar-3d-categorical/bokeh/code",
  "spec_json": "https://api.anyplot.ai/specs/bar-3d-categorical",
  "render_light_png": "https://storage.googleapis.com/anyplot-images/plots/bar-3d-categorical/python/bokeh/plot-light.png",
  "render_dark_png": "https://storage.googleapis.com/anyplot-images/plots/bar-3d-categorical/python/bokeh/plot-dark.png",
  "interactive_light_html": "https://storage.googleapis.com/anyplot-images/plots/bar-3d-categorical/python/bokeh/plot-light.html",
  "interactive_dark_html": "https://storage.googleapis.com/anyplot-images/plots/bar-3d-categorical/python/bokeh/plot-dark.html",
  "quality_score": 86.0,
  "license": "MIT",
  "guide": "https://anyplot.ai/llms.txt"
}
Part of 3D Bar Chart for Categorical Comparison on anyplot.ai.