The same plot in 14 other libraries — Python: Altair, lets-plot, Matplotlib, Plotly, plotnine, Pygal, Seaborn; R: ggplot2; Julia: Makie.jl; JavaScript: Chart.js, D3.js, Apache ECharts, Highcharts, MUI X Charts. Compare all 15 side by side: Training Loss Curve in Python, R, Julia and JavaScript.
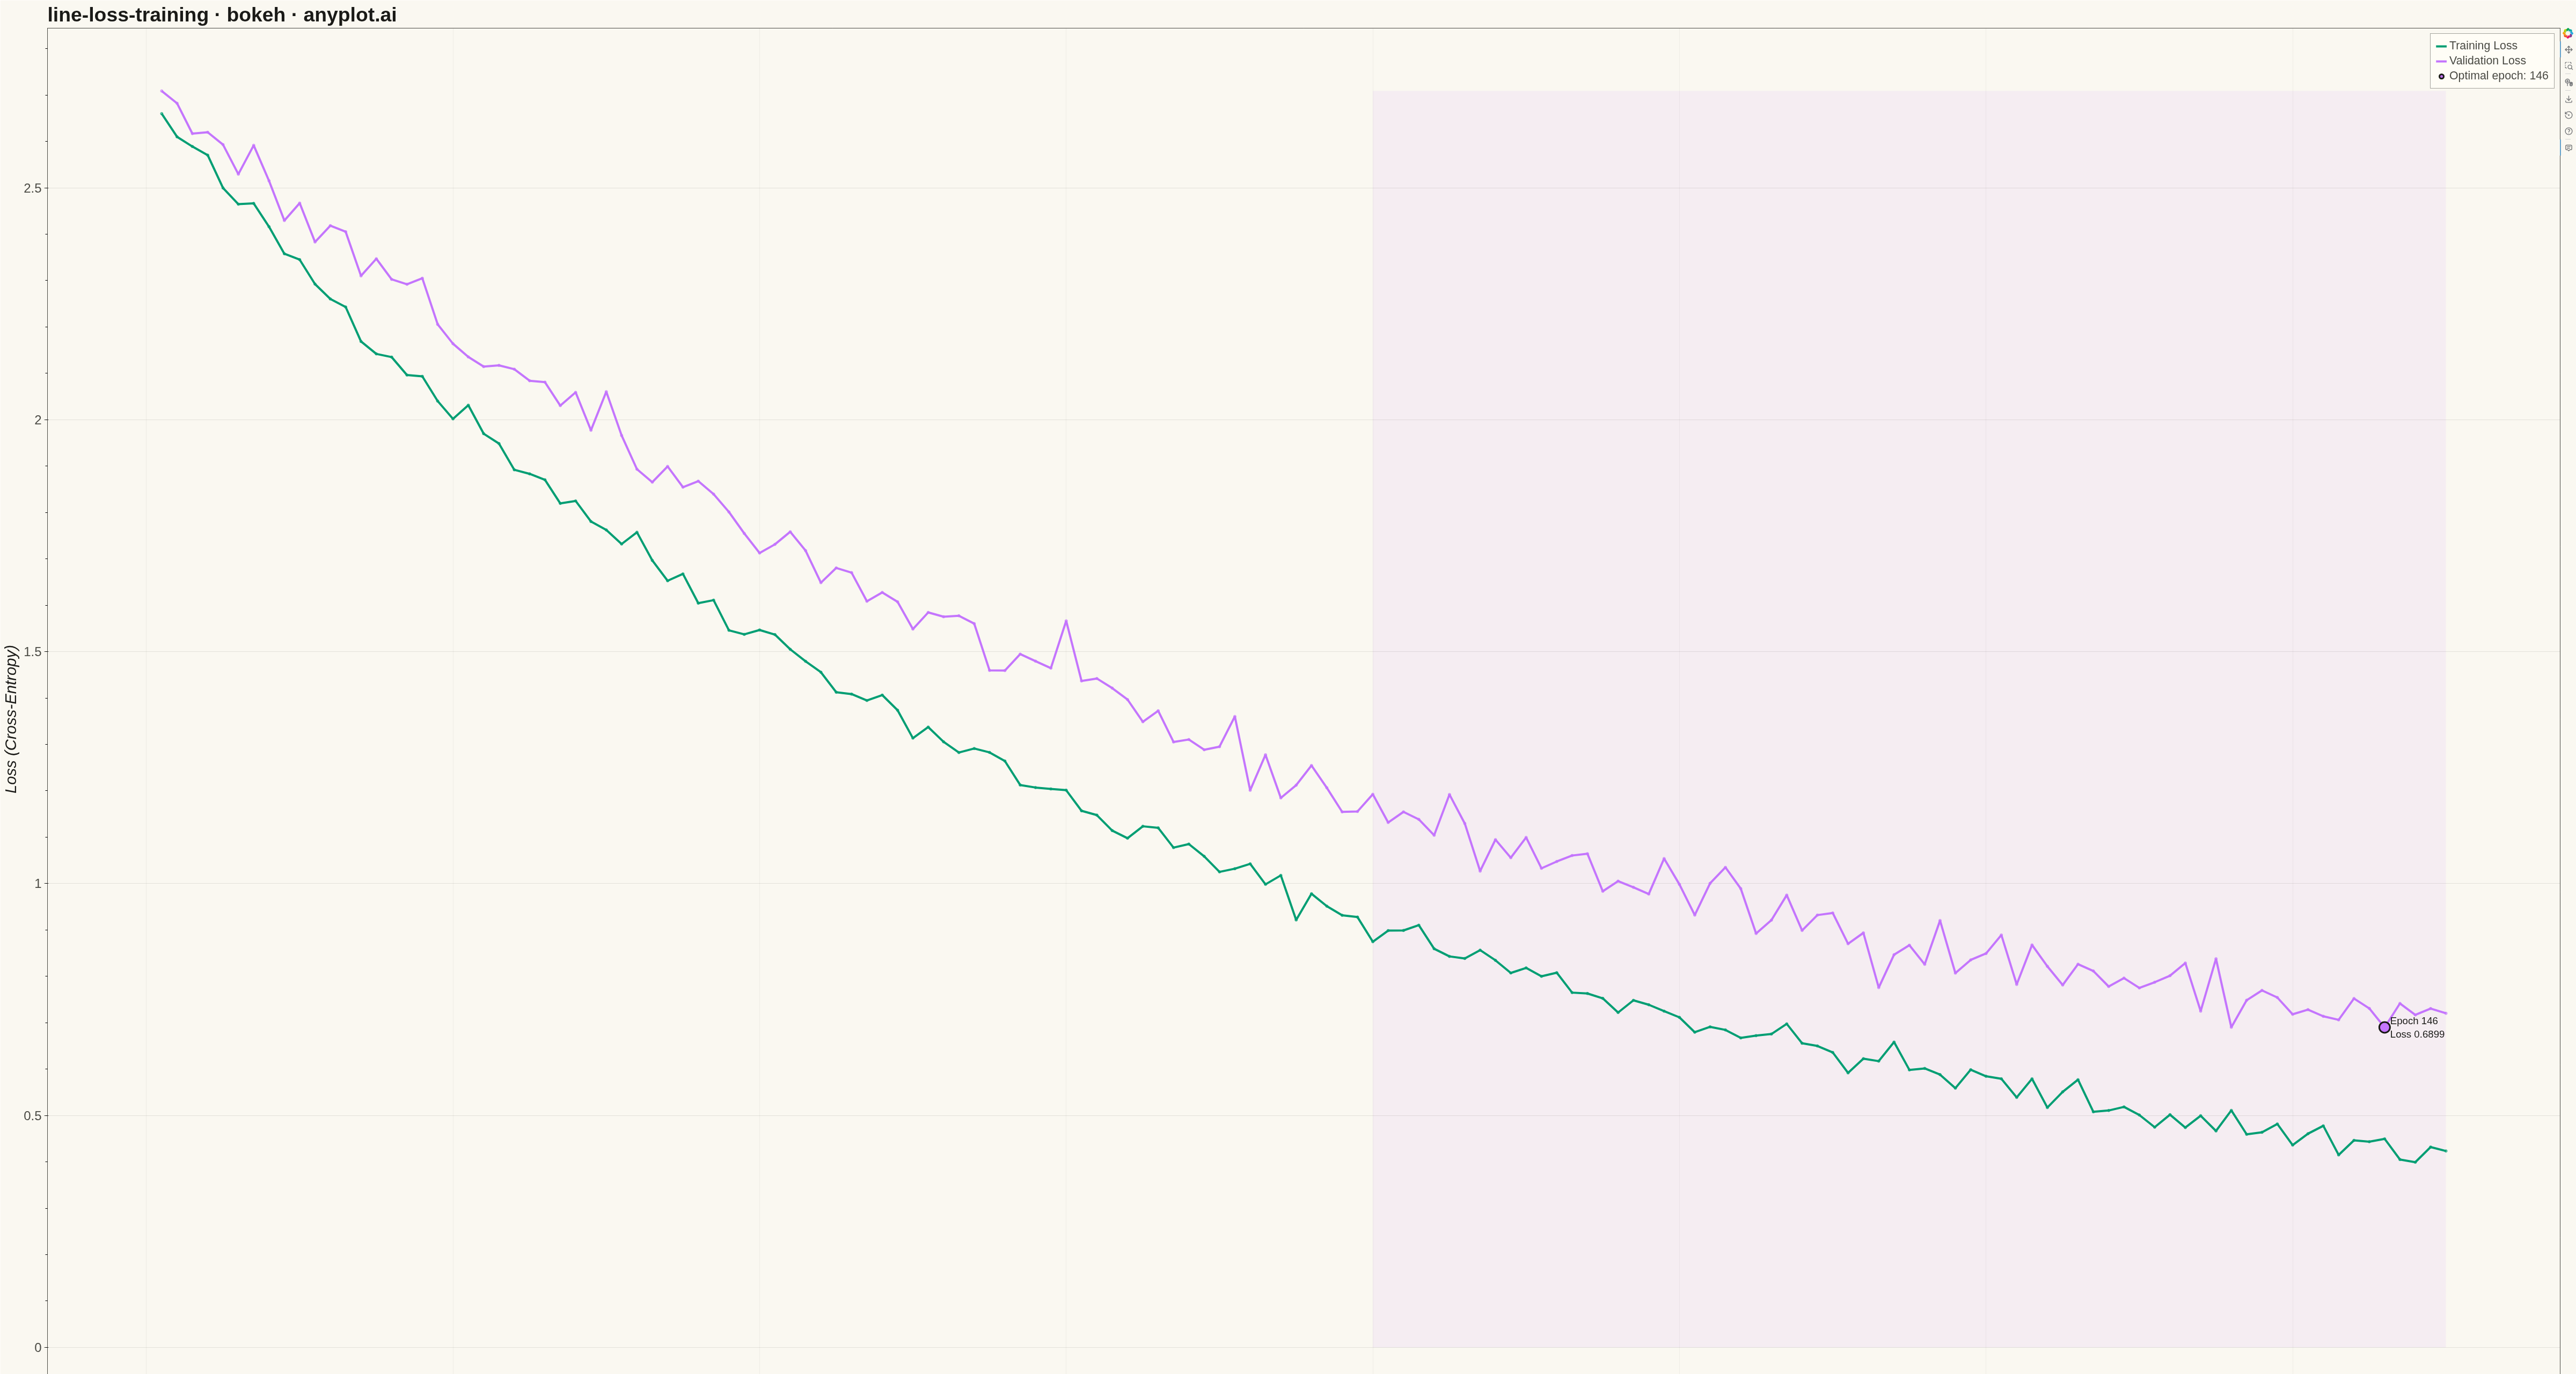
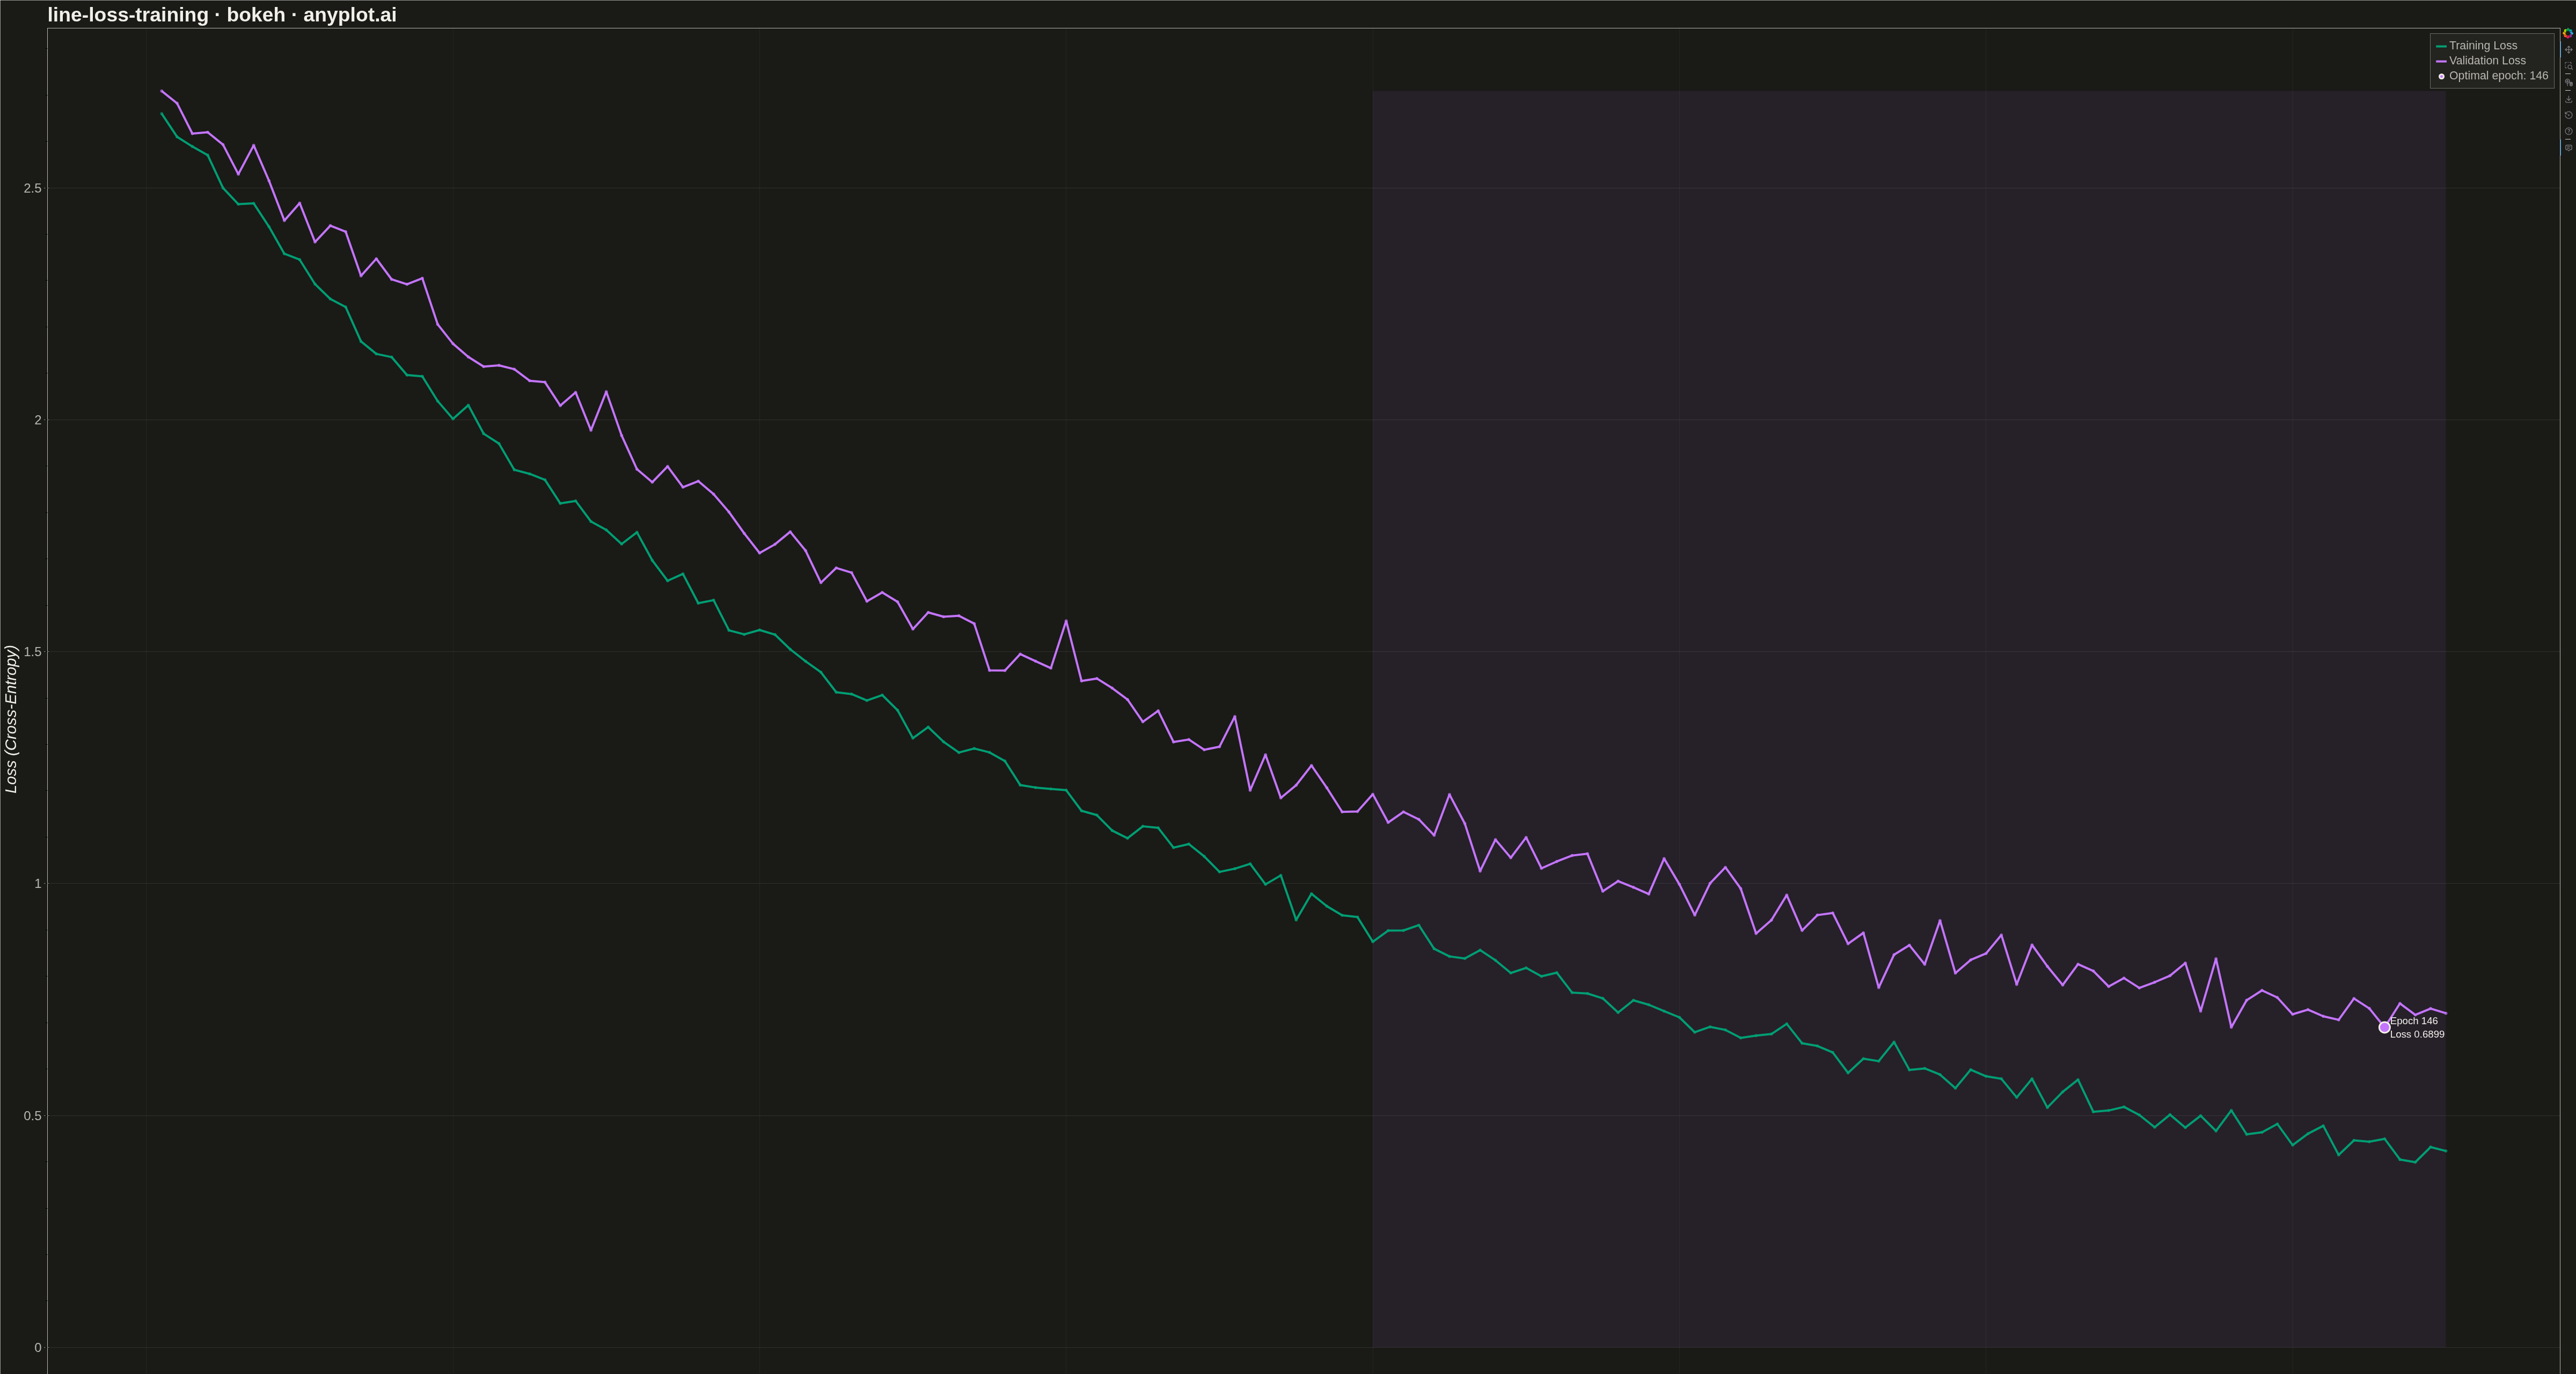
A line plot showing training and validation loss curves over epochs during neural network training. This visualization is essential for monitoring model training, detecting overfitting (when validation loss diverges from training loss), and determining optimal early stopping points. The dual-curve display reveals the gap between training and generalization performance.
""" anyplot.ai
line-loss-training: Training Loss Curve
Library: bokeh 3.9.0 | Python 3.13.13
Quality: 95/100 | Created: 2026-05-14
"""

import os
import sys
import time
from pathlib import Path


# Prevent script name from shadowing bokeh module
script_dir = str(Path(__file__).parent)
if script_dir in sys.path:
    sys.path.remove(script_dir)

import numpy as np
import pandas as pd
from bokeh.io import output_file, save
from bokeh.models import ColumnDataSource, HoverTool, Label, Quad
from bokeh.plotting import figure
from selenium import webdriver
from selenium.webdriver.chrome.options import Options


# Theme tokens (see prompts/default-style-guide.md)
THEME = os.getenv("ANYPLOT_THEME", "light")
PAGE_BG = "#FAF8F1" if THEME == "light" else "#1A1A17"
ELEVATED_BG = "#FFFDF6" if THEME == "light" else "#242420"
INK = "#1A1A17" if THEME == "light" else "#F0EFE8"
INK_SOFT = "#4A4A44" if THEME == "light" else "#B8B7B0"

# Okabe-Ito palette
TRAIN_COLOR = "#009E73"  # bluish green - first series (brand)
VAL_COLOR = "#C475FD"  # vermillion - second series

# Generate realistic neural network training data
np.random.seed(42)
n_epochs = 150

# Training loss: smooth exponential decay with noise
epochs = np.arange(1, n_epochs + 1)
train_loss_base = 2.5 * np.exp(-0.015 * (epochs - 1)) + 0.15
train_loss = train_loss_base + np.random.normal(0, 0.02, n_epochs)
train_loss = np.maximum(train_loss, 0.15)  # ensure positive

# Validation loss: slightly noisier, higher baseline, potential overfitting
val_loss_base = 2.5 * np.exp(-0.012 * (epochs - 1)) + 0.2
val_loss = val_loss_base + np.random.normal(0, 0.035, n_epochs)
# Add slight overfitting effect in later epochs
val_loss[80:] += np.linspace(0, 0.08, n_epochs - 80)
val_loss = np.maximum(val_loss, 0.18)

# Find minimum validation loss epoch (for annotation)
min_val_idx = np.argmin(val_loss)
min_val_epoch = epochs[min_val_idx]
min_val_loss = val_loss[min_val_idx]

# Create DataFrame
df = pd.DataFrame({"epoch": epochs, "train_loss": train_loss, "val_loss": val_loss})

# Create Bokeh figure
title_text = "line-loss-training · bokeh · anyplot.ai"
p = figure(
    width=4800,
    height=2700,
    title=title_text,
    x_axis_label="Epoch",
    y_axis_label="Loss (Cross-Entropy)",
    toolbar_location="right",
)

# Set up data sources
train_source = ColumnDataSource(df[["epoch", "train_loss"]])
val_source = ColumnDataSource(df[["epoch", "val_loss"]])

# Create a shaded region to highlight potential overfitting area (after epoch 80)
overfitting_start = 80
max_loss = max(df["val_loss"].max(), df["train_loss"].max())
overfitting_quad = p.quad(
    left=[overfitting_start],
    right=[n_epochs],
    bottom=[0],
    top=[max_loss],
    fill_alpha=0.08,
    fill_color=VAL_COLOR,
    line_color=None,
    level="underlay",
)

# Plot lines
train_line = p.line(
    x="epoch",
    y="train_loss",
    source=train_source,
    line_width=4,
    color=TRAIN_COLOR,
    legend_label="Training Loss",
    muted_color=TRAIN_COLOR,
    muted_alpha=0.15,
)

val_line = p.line(
    x="epoch",
    y="val_loss",
    source=val_source,
    line_width=4,
    color=VAL_COLOR,
    legend_label="Validation Loss",
    muted_color=VAL_COLOR,
    muted_alpha=0.15,
)

# Add circle markers at data points
p.scatter(
    x="epoch",
    y="train_loss",
    source=train_source,
    size=5,
    color=TRAIN_COLOR,
    alpha=0.6,
    hover_color=TRAIN_COLOR,
    hover_alpha=1.0,
)

p.scatter(
    x="epoch",
    y="val_loss",
    source=val_source,
    size=5,
    color=VAL_COLOR,
    alpha=0.6,
    hover_color=VAL_COLOR,
    hover_alpha=1.0,
)

# Mark the epoch with minimum validation loss - larger marker for emphasis
optimal_marker = p.scatter(
    x=[min_val_epoch],
    y=[min_val_loss],
    size=20,
    color=VAL_COLOR,
    line_color=INK,
    line_width=3,
    alpha=1.0,
    legend_label=f"Optimal epoch: {min_val_epoch}",
)

# Add annotation label at the optimal epoch
label = Label(
    x=min_val_epoch,
    y=min_val_loss,
    text=f"  Epoch {min_val_epoch}\n  Loss {min_val_loss:.4f}",
    text_color=INK,
    text_font_size="14pt",
    text_baseline="middle",
    text_align="left",
)
p.add_layout(label)

# Add detailed hover tool
hover = HoverTool(tooltips=[("Epoch", "@epoch{0}"), ("Loss", "@y{0.0000}")], mode="vline")
p.add_tools(hover)

# Apply text sizing
p.title.text_font_size = "28pt"
p.xaxis.axis_label_text_font_size = "22pt"
p.yaxis.axis_label_text_font_size = "22pt"
p.xaxis.major_label_text_font_size = "18pt"
p.yaxis.major_label_text_font_size = "18pt"

# Apply theme-adaptive chrome colors
p.background_fill_color = PAGE_BG
p.border_fill_color = PAGE_BG
p.outline_line_color = INK_SOFT

p.title.text_color = INK
p.xaxis.axis_label_text_color = INK
p.yaxis.axis_label_text_color = INK
p.xaxis.major_label_text_color = INK_SOFT
p.yaxis.major_label_text_color = INK_SOFT
p.xaxis.axis_line_color = INK_SOFT
p.yaxis.axis_line_color = INK_SOFT
p.xaxis.major_tick_line_color = INK_SOFT
p.yaxis.major_tick_line_color = INK_SOFT

# Y-axis grid (for line charts per style guide)
p.ygrid.grid_line_color = INK
p.ygrid.grid_line_alpha = 0.10
p.xgrid.grid_line_color = INK
p.xgrid.grid_line_alpha = 0.05

# Configure legend
p.legend.background_fill_color = ELEVATED_BG
p.legend.border_line_color = INK_SOFT
p.legend.label_text_color = INK_SOFT
p.legend.location = "top_right"
p.legend.click_policy = "mute"
p.legend.label_text_font_size = "16pt"

# Save HTML
output_file(f"plot-{THEME}.html")
save(p)

# Screenshot with headless Chrome using Selenium
W, H = 4800, 2700
opts = Options()
for arg in (
    "--headless=new",
    "--no-sandbox",
    "--disable-dev-shm-usage",
    "--disable-gpu",
    f"--window-size={W},{H}",
    "--hide-scrollbars",
):
    opts.add_argument(arg)

driver = webdriver.Chrome(options=opts)
driver.set_window_size(W, H)
driver.get(f"file://{Path(f'plot-{THEME}.html').resolve()}")
time.sleep(3)  # let bokeh's JS render the canvas
driver.save_screenshot(f"plot-{THEME}.png")
driver.quit()
Runnable source as JSON, for any HTTP client: https://api.anyplot.ai/specs/line-loss-training/bokeh/code. Any spec id and library id listed in llms-full.txt fit the same URL shape; every URL below is complete and callable.
{
  "spec_id": "line-loss-training",
  "language": "python",
  "library": "bokeh",
  "page": "https://anyplot.ai/line-loss-training/python/bokeh",
  "hub": "https://anyplot.ai/line-loss-training",
  "code_json": "https://api.anyplot.ai/specs/line-loss-training/bokeh/code",
  "spec_json": "https://api.anyplot.ai/specs/line-loss-training",
  "render_light_png": "https://storage.googleapis.com/anyplot-images/plots/line-loss-training/python/bokeh/plot-light.png",
  "render_dark_png": "https://storage.googleapis.com/anyplot-images/plots/line-loss-training/python/bokeh/plot-dark.png",
  "interactive_light_html": "https://storage.googleapis.com/anyplot-images/plots/line-loss-training/python/bokeh/plot-light.html",
  "interactive_dark_html": "https://storage.googleapis.com/anyplot-images/plots/line-loss-training/python/bokeh/plot-dark.html",
  "quality_score": 95.0,
  "license": "MIT",
  "guide": "https://anyplot.ai/llms.txt"
}
Part of Training Loss Curve on anyplot.ai.