The same plot in 14 other libraries — JavaScript: Chart.js, D3.js, Apache ECharts, Highcharts; Python: Altair, Bokeh, lets-plot, Matplotlib, Plotly, plotnine, Pygal, Seaborn; R: ggplot2; Julia: Makie.jl. Compare all 15 side by side: Categorical Scatter Plot in Python, R, Julia and JavaScript.
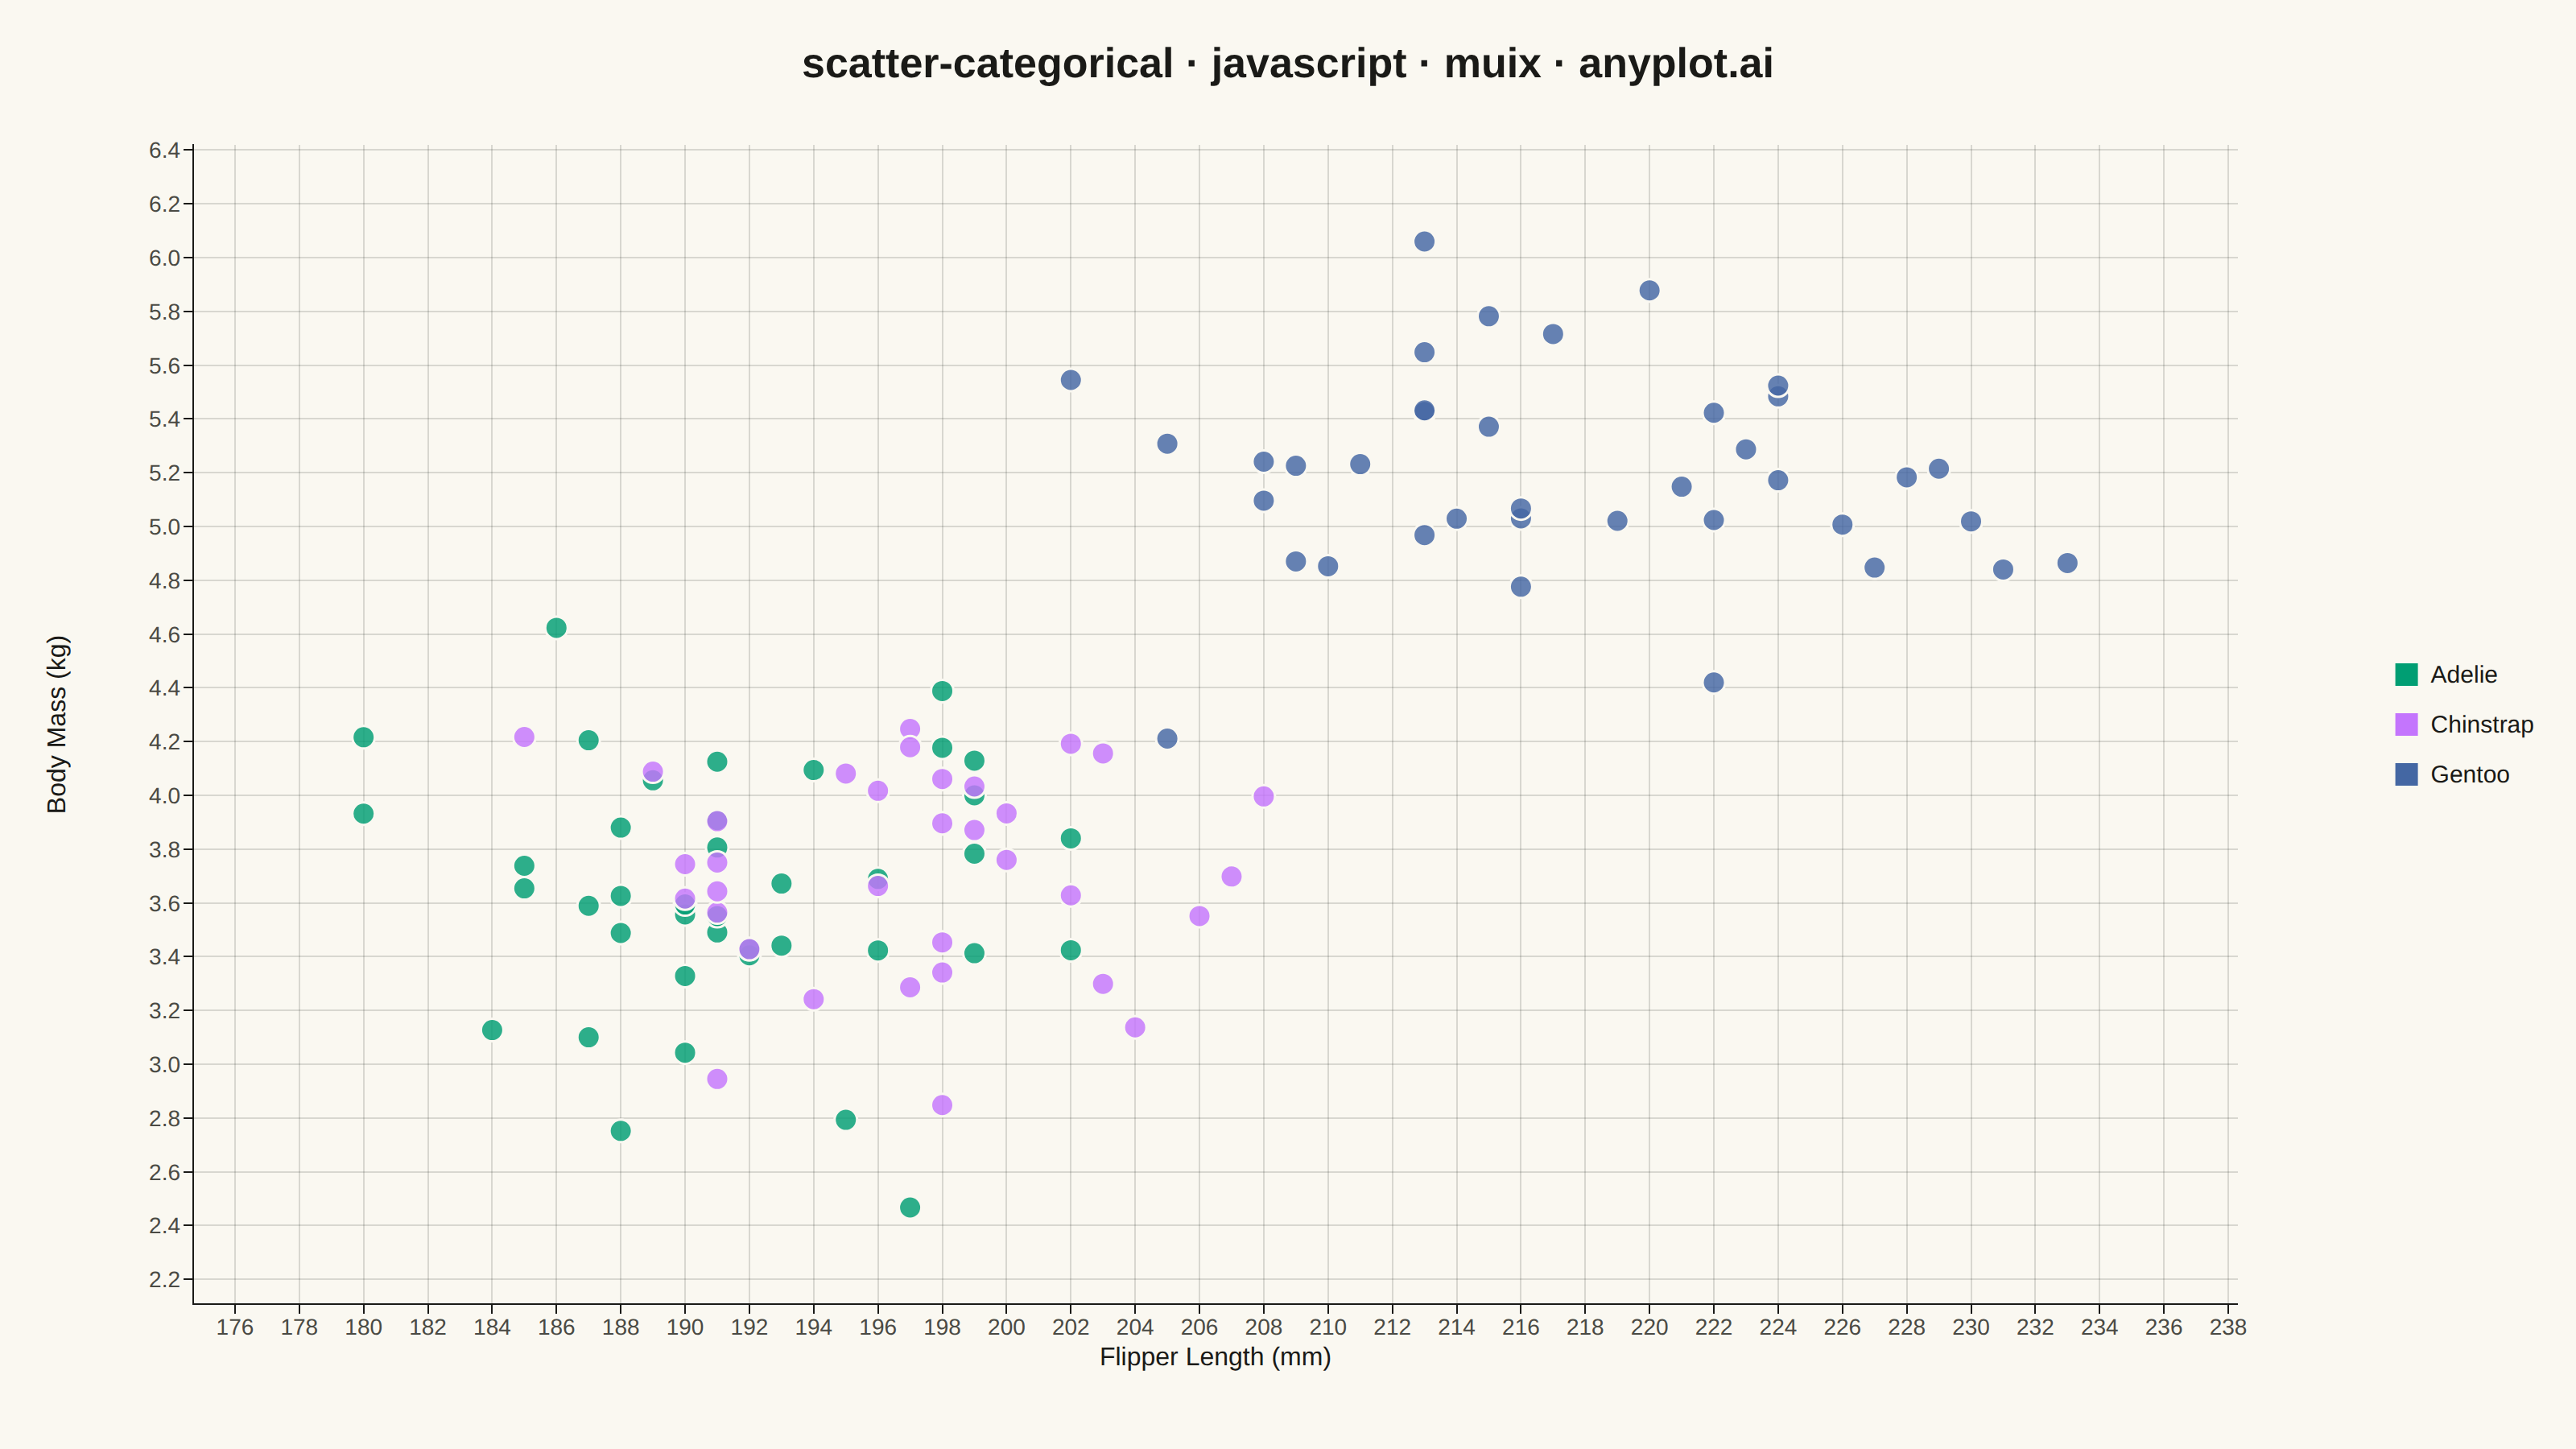
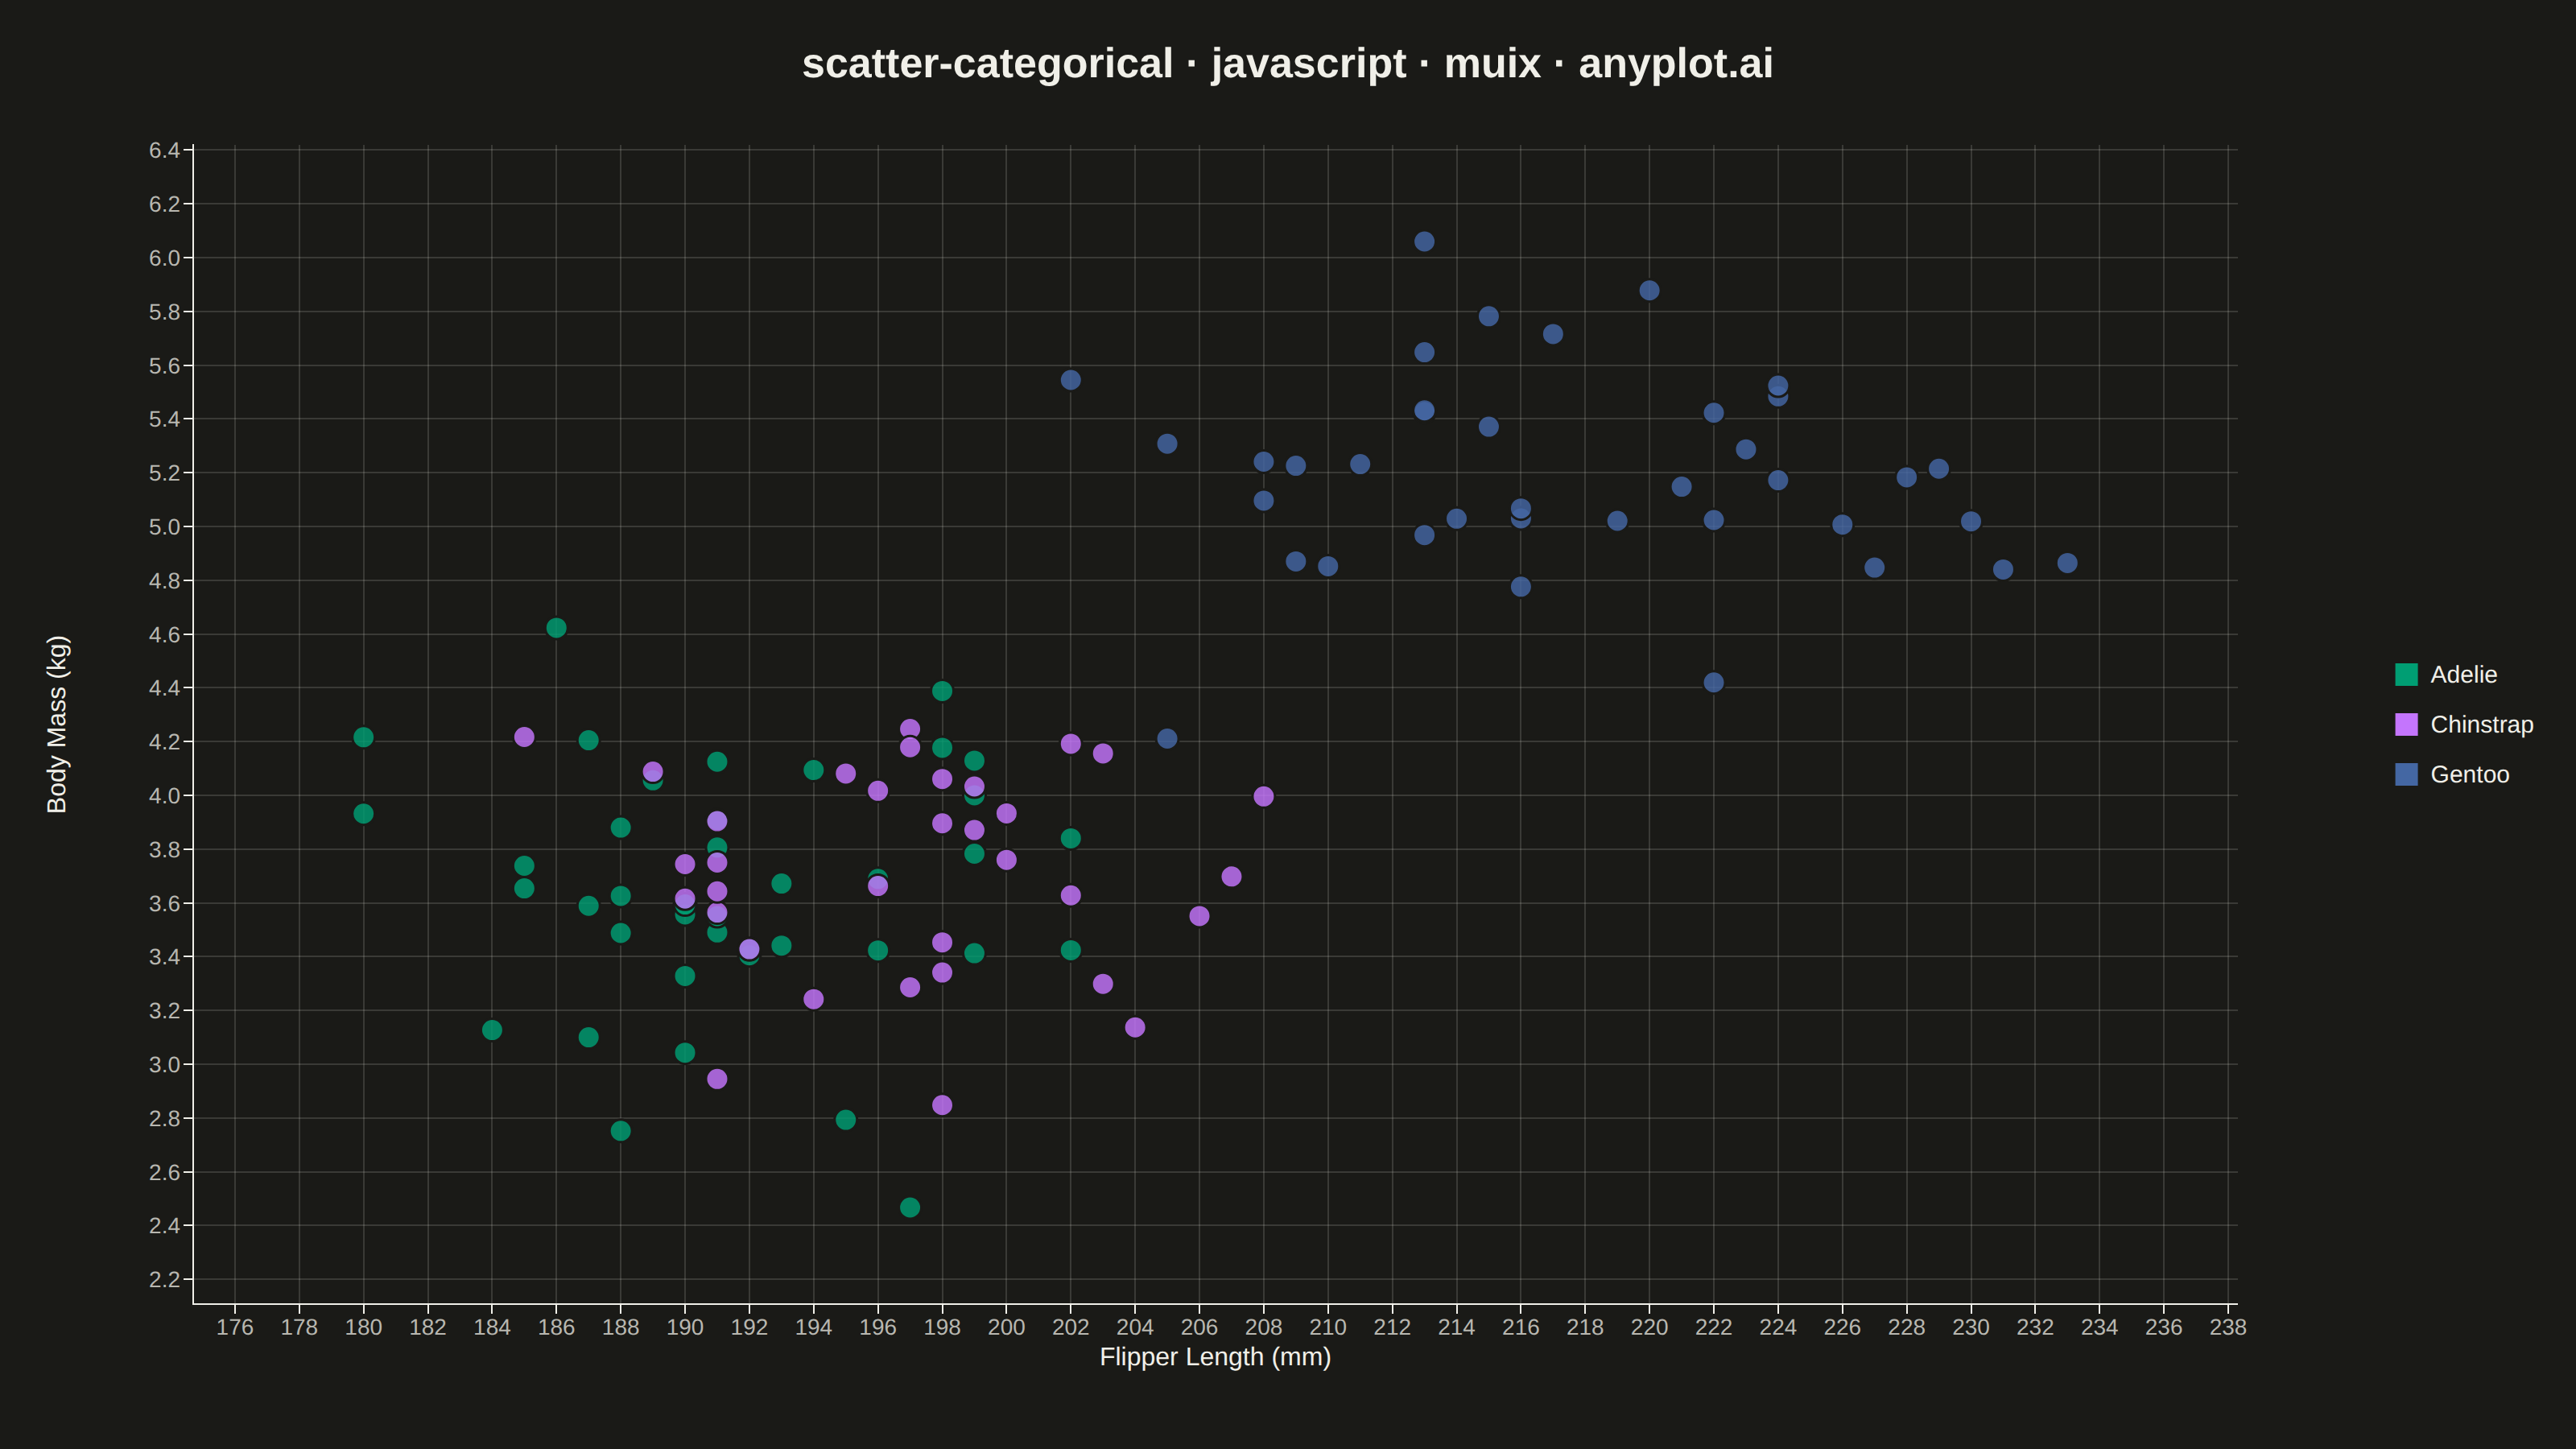
A scatter plot where points are colored according to a categorical variable. Each category has a distinct color, allowing visual comparison of patterns across groups. A legend maps colors to category names.
// anyplot.ai
// scatter-categorical: Categorical Scatter Plot
// Library: muix 7.29.1 | JavaScript 22.23.2
// Quality: 86/100 | Created: 2026-09-05
//# anyplot-orientation: landscape
// anyplot.ai
// scatter-categorical: Categorical Scatter Plot
// Library: MUI X Charts | React | Node 22
// License: @mui/x-charts — MIT (community). Pro/Premium are out of scope.
// Quality: pending | Created: 2026-09-05
import { ScatterChart } from "@mui/x-charts/ScatterChart";

const t = window.ANYPLOT_TOKENS;
const { width, height } = window.ANYPLOT_SIZE;

// Deterministic LCG (seed 42) — no Math.random() in the browser harness
let seed = 42;
function rng() {
  seed = (1664525 * seed + 1013904223) >>> 0;
  return seed / 4294967296;
}
function randn() {
  const u = Math.max(rng(), 1e-9);
  const v = rng();
  return Math.sqrt(-2 * Math.log(u)) * Math.cos(2 * Math.PI * v);
}

// --- Data: penguin body measurements by species — flipper length vs body
// mass, three overlapping-but-separable clusters (a classic categorical
// scatter scenario). ---------------------------------------------------------
const SPECIES = [
  {
    name: "Adelie",
    flipperMean: 190,
    flipperSd: 6.5,
    massMean: 3700,
    massSd: 460,
    n: 40,
  },
  {
    name: "Chinstrap",
    flipperMean: 196,
    flipperSd: 7.2,
    massMean: 3730,
    massSd: 380,
    n: 34,
  },
  {
    name: "Gentoo",
    flipperMean: 217,
    flipperSd: 6.5,
    massMean: 5090,
    massSd: 500,
    n: 38,
  },
];

let pointId = 0;
const series = SPECIES.map((sp, i) => ({
  id: sp.name,
  label: sp.name,
  color: t.palette[i],
  markerSize: 7,
  // Fade the other two species when one is hovered, showcasing MUI X's
  // built-in cross-series highlight/fade interaction (purely additive —
  // has no effect on the static screenshot).
  highlightScope: { highlight: "series", fade: "global" },
  data: Array.from({ length: sp.n }, () => ({
    x: Math.round(sp.flipperMean + randn() * sp.flipperSd),
    // Body mass in kg (not g) — keeps y tick labels short ("3.7", not
    // "3,700"), which avoids the label colliding with the axis title (MUI X
    // offsets the y-axis title from a fixed tick-fontsize heuristic, not the
    // tick label's actual rendered width).
    y: Math.round(sp.massMean + randn() * sp.massSd) / 1000,
    id: pointId++,
  })),
}));

const allPoints = series.flatMap((s) => s.data);
const xs = allPoints.map((p) => p.x);
const ys = allPoints.map((p) => p.y);
const xPad = (Math.max(...xs) - Math.min(...xs)) * 0.1;
const yPad = (Math.max(...ys) - Math.min(...ys)) * 0.1;
const X_MIN = Math.min(...xs) - xPad;
const X_MAX = Math.max(...xs) + xPad;
const Y_MIN = Math.min(...ys) - yPad;
const Y_MAX = Math.max(...ys) + yPad;

const TITLE = "scatter-categorical · javascript · muix · anyplot.ai";
const MARGIN = { top: 90, right: 210, bottom: 90, left: 120 };
const Y_LABEL_X = 36;
const Y_LABEL_Y = MARGIN.top + (height - MARGIN.top - MARGIN.bottom) / 2;

// --- Chart (default-exported component — the harness mounts it) -------------
export default function Chart() {
  return (
    <ScatterChart
      width={width}
      height={height}
      margin={MARGIN}
      series={series}
      skipAnimation
      grid={{ vertical: true, horizontal: true }}
      // Scatter markers are the only <circle> elements this chart renders
      // (legend swatches are <rect>s) — a page-background-colored edge
      // stroke plus slight fill transparency keeps overlapping Adelie/
      // Chinstrap points individually distinguishable instead of merging
      // into solid blobs, in both themes.
      sx={{
        "& circle": {
          stroke: t.pageBg,
          strokeWidth: 1.5,
          fillOpacity: 0.82,
        },
      }}
      xAxis={[
        {
          min: X_MIN,
          max: X_MAX,
          label: "Flipper Length (mm)",
          labelStyle: { fontSize: 16, fill: t.ink, fontWeight: 500 },
          tickLabelStyle: { fontSize: 14, fill: t.inkSoft },
          stroke: t.inkSoft,
        },
      ]}
      yAxis={[
        {
          min: Y_MIN,
          max: Y_MAX,
          valueFormatter: (v) => v.toFixed(1),
          tickLabelStyle: { fontSize: 14, fill: t.inkSoft },
          stroke: t.inkSoft,
        },
      ]}
      legend={{
        position: { vertical: "middle", horizontal: "right" },
        direction: "column",
        labelStyle: { fontSize: 15, fill: t.ink },
        itemMarkWidth: 14,
        itemMarkHeight: 14,
        markGap: 8,
        itemGap: 16,
      }}
    >
      <text
        x={width / 2}
        y={48}
        textAnchor="middle"
        fontSize={26}
        fontWeight={600}
        fill={t.ink}
      >
        {TITLE}
      </text>
      {/* Manually placed y-axis title (independent of MUI X's built-in
          label offset, which is sized off tickFontSize rather than the tick
          labels' actual rendered width) — guarantees no collision with the
          tick numbers regardless of their digit count. */}
      <text
        x={Y_LABEL_X}
        y={Y_LABEL_Y}
        textAnchor="middle"
        dominantBaseline="central"
        fontSize={16}
        fontWeight={500}
        fill={t.ink}
        transform={`rotate(-90, ${Y_LABEL_X}, ${Y_LABEL_Y})`}
      >
        Body Mass (kg)
      </text>
    </ScatterChart>
  );
}
Runnable source as JSON, for any HTTP client: https://api.anyplot.ai/specs/scatter-categorical/muix/code. Any spec id and library id listed in llms-full.txt fit the same URL shape; every URL below is complete and callable.
{
  "spec_id": "scatter-categorical",
  "language": "javascript",
  "library": "muix",
  "page": "https://anyplot.ai/scatter-categorical/javascript/muix",
  "hub": "https://anyplot.ai/scatter-categorical",
  "code_json": "https://api.anyplot.ai/specs/scatter-categorical/muix/code",
  "spec_json": "https://api.anyplot.ai/specs/scatter-categorical",
  "render_light_png": "https://storage.googleapis.com/anyplot-images/plots/scatter-categorical/javascript/muix/plot-light.png",
  "render_dark_png": "https://storage.googleapis.com/anyplot-images/plots/scatter-categorical/javascript/muix/plot-dark.png",
  "interactive_light_html": "https://storage.googleapis.com/anyplot-images/plots/scatter-categorical/javascript/muix/plot-light.html",
  "interactive_dark_html": "https://storage.googleapis.com/anyplot-images/plots/scatter-categorical/javascript/muix/plot-dark.html",
  "quality_score": 86.0,
  "license": "MIT",
  "guide": "https://anyplot.ai/llms.txt"
}
Part of Categorical Scatter Plot on anyplot.ai.