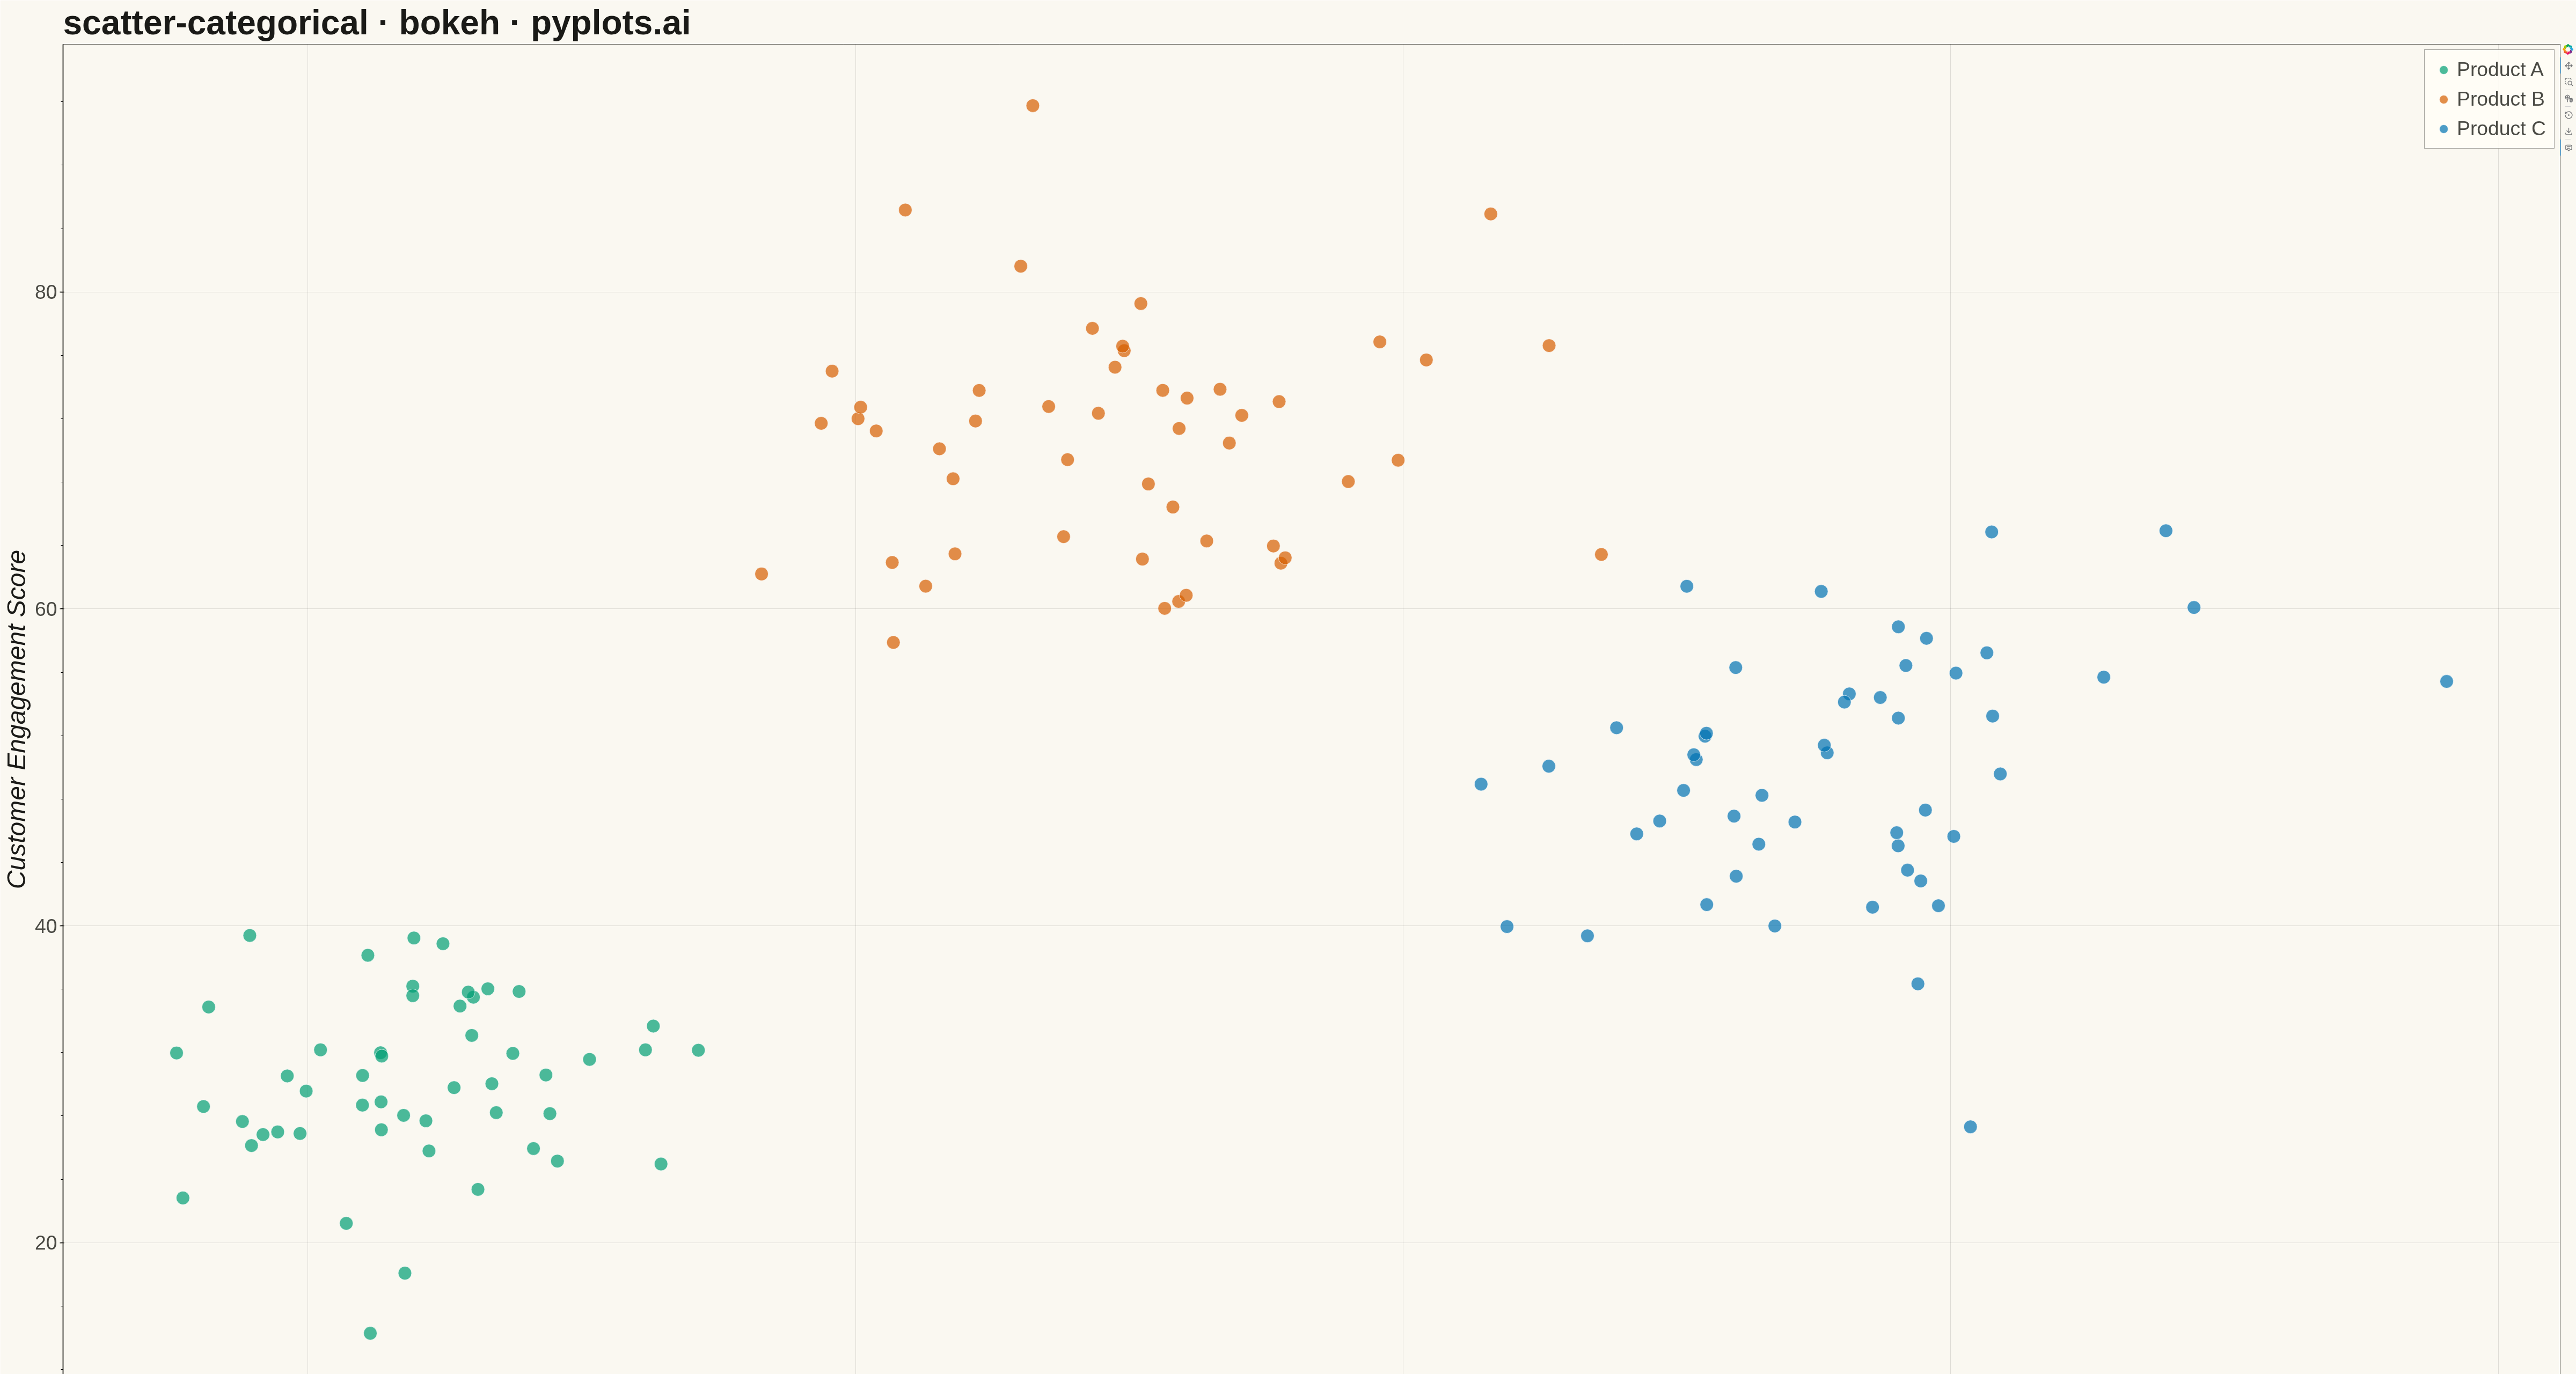
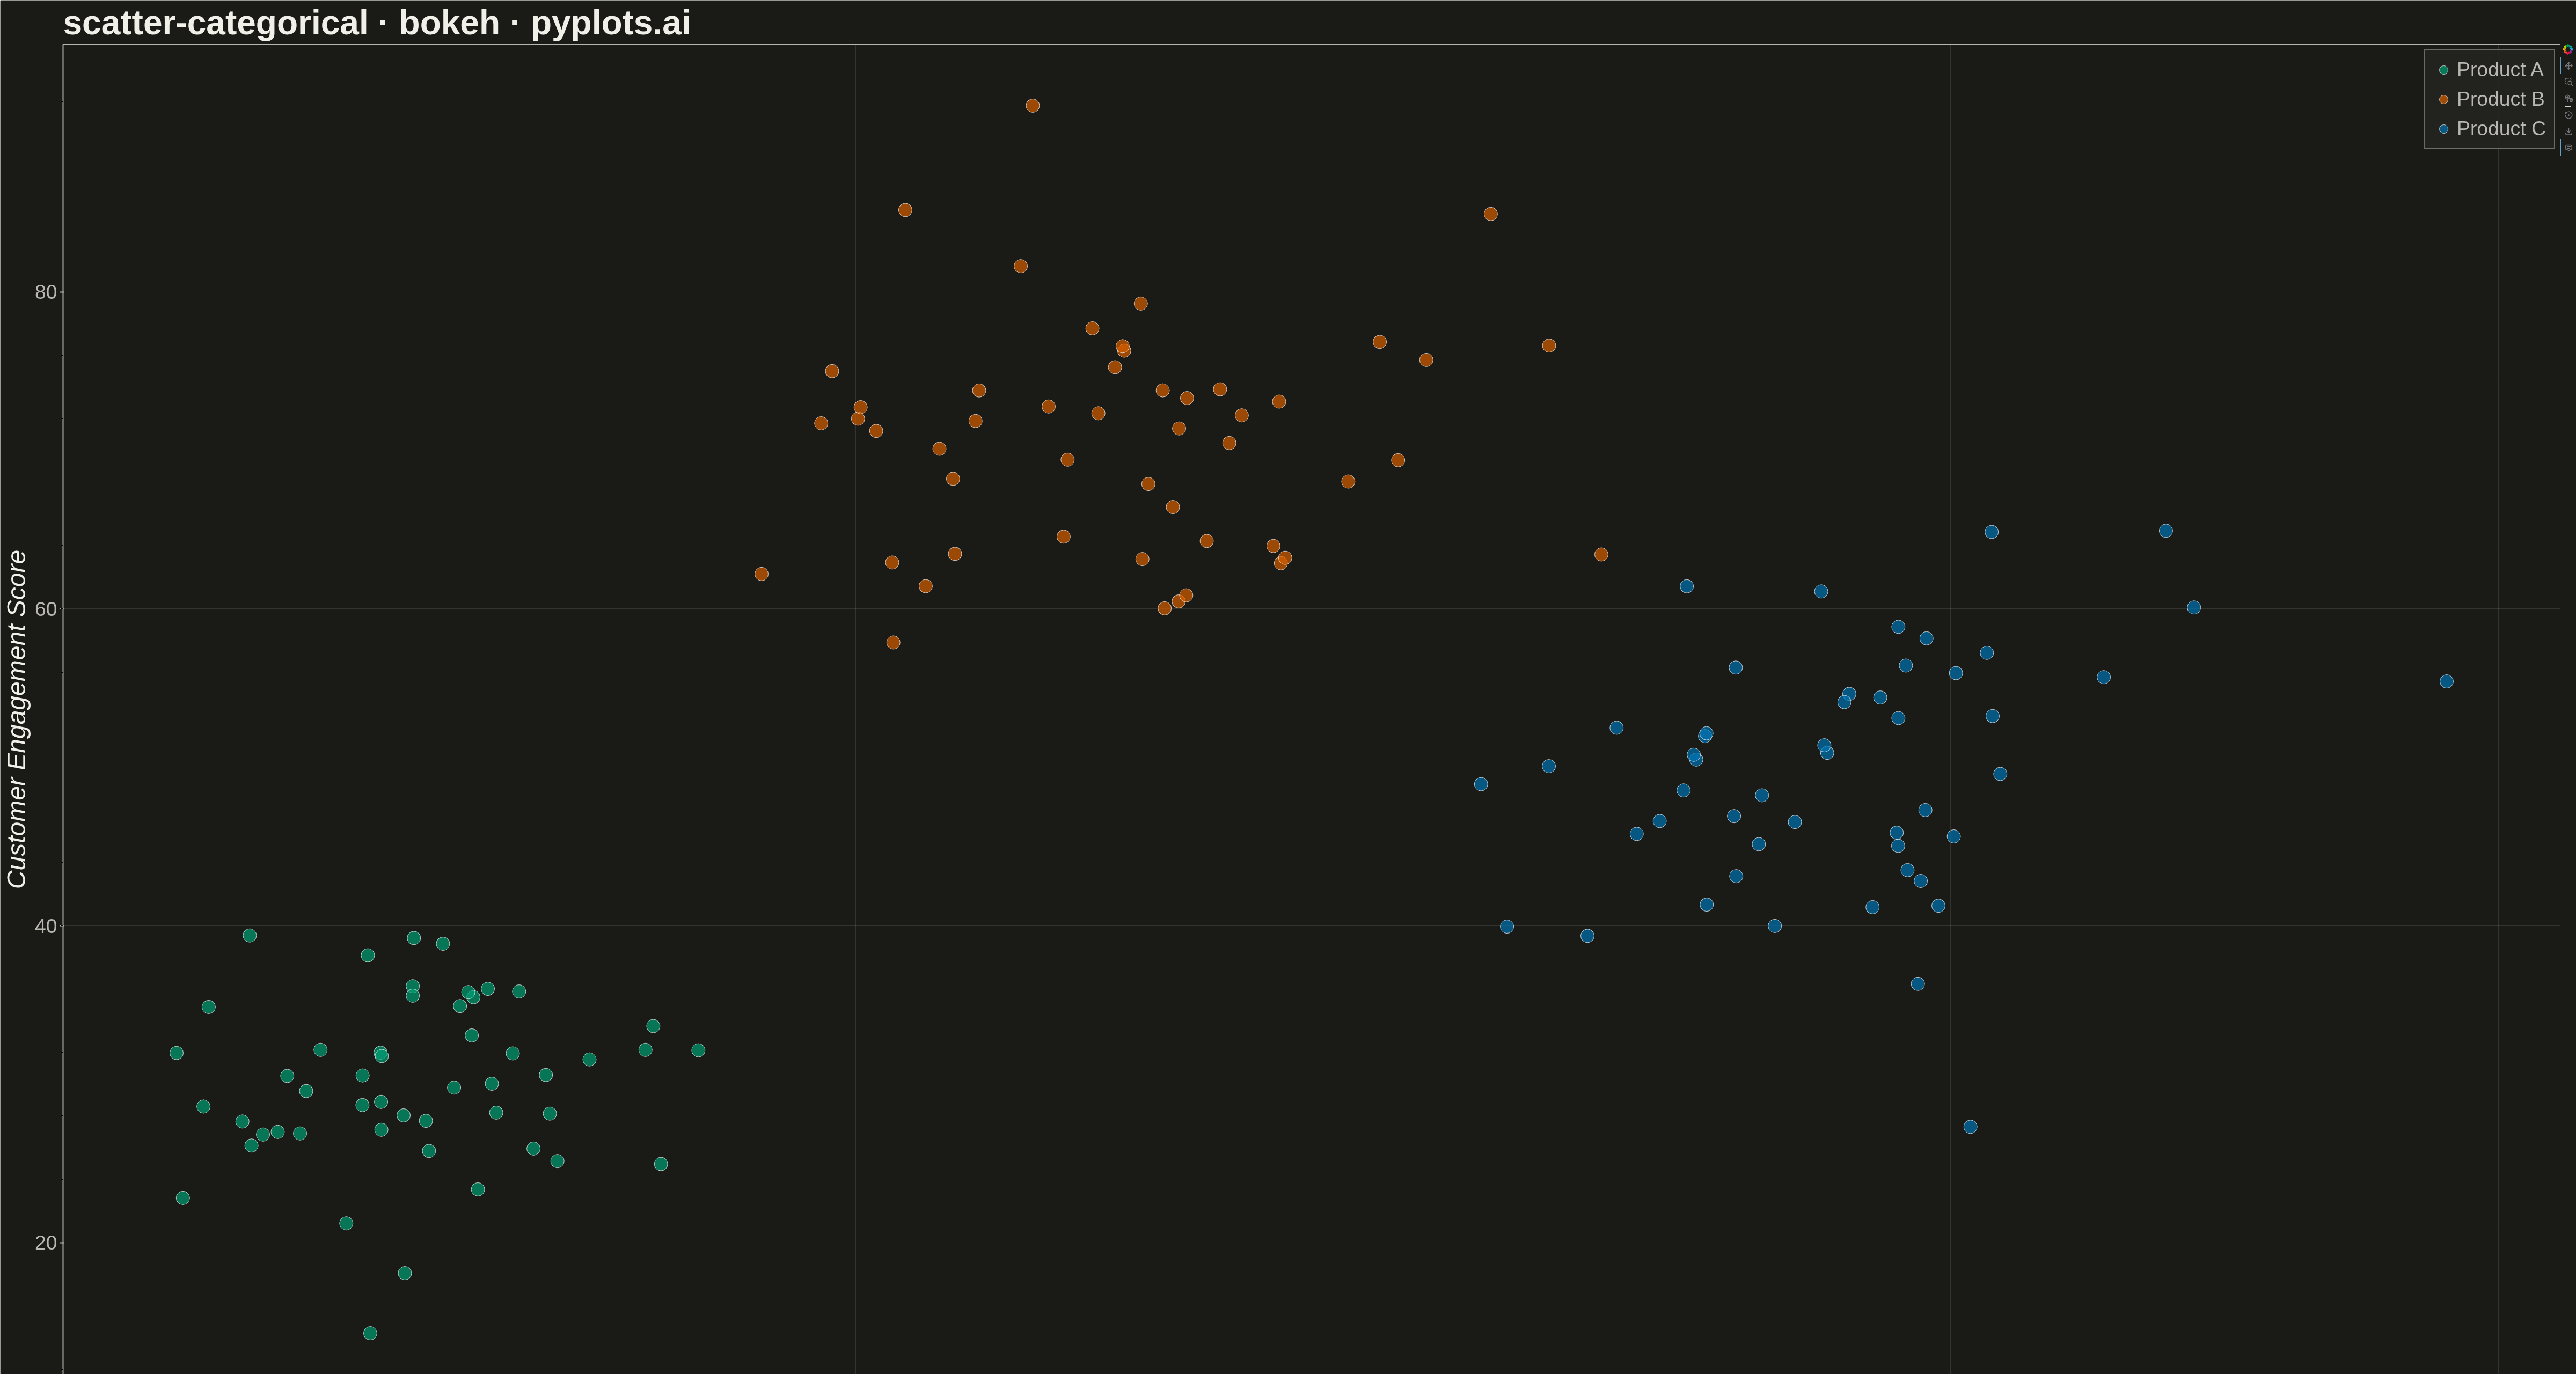
A scatter plot where points are colored according to a categorical variable. Each category has a distinct color, allowing visual comparison of patterns across groups. A legend maps colors to category names.
""" anyplot.ai
scatter-categorical: Categorical Scatter Plot
Library: bokeh 3.9.0 | Python 3.13.13
Quality: 70/100 | Updated: 2026-05-12
"""

import numpy as np
from bokeh.io import export_png, output_file, save
from bokeh.models import ColumnDataSource, Legend
from bokeh.plotting import figure


# Data
np.random.seed(42)

# Generate three distinct groups with different patterns
n_per_group = 50

# Group A: Lower left cluster
x_a = np.random.normal(25, 5, n_per_group)
y_a = np.random.normal(30, 6, n_per_group)
cat_a = ["Product A"] * n_per_group

# Group B: Upper middle cluster
x_b = np.random.normal(50, 7, n_per_group)
y_b = np.random.normal(70, 8, n_per_group)
cat_b = ["Product B"] * n_per_group

# Group C: Right side, moderate y
x_c = np.random.normal(75, 6, n_per_group)
y_c = np.random.normal(50, 7, n_per_group)
cat_c = ["Product C"] * n_per_group

# Combine data
x = np.concatenate([x_a, x_b, x_c])
y = np.concatenate([y_a, y_b, y_c])
categories = cat_a + cat_b + cat_c

# Define colors for each category (Python Blue, Python Yellow, colorblind-safe red)
color_map = {"Product A": "#306998", "Product B": "#FFD43B", "Product C": "#E74C3C"}

# Create figure with interactive tools
p = figure(
    width=4800,
    height=2700,
    title="scatter-categorical · bokeh · pyplots.ai",
    x_axis_label="Marketing Spend ($K)",
    y_axis_label="Customer Engagement Score",
    tools="pan,wheel_zoom,box_zoom,reset,hover,save",
    tooltips=[("Category", "@cat"), ("X", "@x{0.1}"), ("Y", "@y{0.1}")],
)

# Plot each category separately for legend
legend_items = []

for cat, color in color_map.items():
    mask = [categories[i] == cat for i in range(len(categories))]
    cat_x = [x[i] for i in range(len(x)) if mask[i]]
    cat_y = [y[i] for i in range(len(y)) if mask[i]]
    cat_source = ColumnDataSource(data={"x": cat_x, "y": cat_y, "cat": [cat] * len(cat_x)})
    r = p.scatter(x="x", y="y", source=cat_source, size=25, color=color, alpha=0.7, line_color="white", line_width=1)
    legend_items.append((cat, [r]))

# Add legend
legend = Legend(items=legend_items, location="top_right")
legend.label_text_font_size = "28pt"
legend.glyph_height = 40
legend.glyph_width = 40
legend.spacing = 12
legend.padding = 15
legend.background_fill_alpha = 0.8
p.add_layout(legend)

# Title styling
p.title.text_font_size = "48pt"
p.title.text_font_style = "bold"

# Axis label styling
p.xaxis.axis_label_text_font_size = "36pt"
p.yaxis.axis_label_text_font_size = "36pt"

# Tick label styling
p.xaxis.major_label_text_font_size = "28pt"
p.yaxis.major_label_text_font_size = "28pt"

# Grid styling
p.grid.grid_line_alpha = 0.3
p.grid.grid_line_dash = "dashed"

# Background
p.background_fill_color = "#fafafa"

# Axis styling
p.axis.axis_line_width = 2
p.axis.major_tick_line_width = 2

# Save PNG
export_png(p, filename="plot.png")

# Save interactive HTML
output_file("plot.html", title="scatter-categorical · bokeh · pyplots.ai")
save(p)
Runnable source as JSON, for any HTTP client: https://api.anyplot.ai/specs/scatter-categorical/bokeh/code. Any spec id and library id listed in llms-full.txt fit the same URL shape; every URL below is complete and callable.
{
  "spec_id": "scatter-categorical",
  "language": "python",
  "library": "bokeh",
  "page": "https://anyplot.ai/scatter-categorical/python/bokeh",
  "hub": "https://anyplot.ai/scatter-categorical",
  "code_json": "https://api.anyplot.ai/specs/scatter-categorical/bokeh/code",
  "spec_json": "https://api.anyplot.ai/specs/scatter-categorical",
  "render_light_png": "https://storage.googleapis.com/anyplot-images/plots/scatter-categorical/python/bokeh/plot-light.png",
  "render_dark_png": "https://storage.googleapis.com/anyplot-images/plots/scatter-categorical/python/bokeh/plot-dark.png",
  "interactive_light_html": "https://storage.googleapis.com/anyplot-images/plots/scatter-categorical/python/bokeh/plot-light.html",
  "interactive_dark_html": "https://storage.googleapis.com/anyplot-images/plots/scatter-categorical/python/bokeh/plot-dark.html",
  "quality_score": 70.0,
  "license": "MIT",
  "guide": "https://anyplot.ai/llms.txt"
}
Part of Categorical Scatter Plot on anyplot.ai.