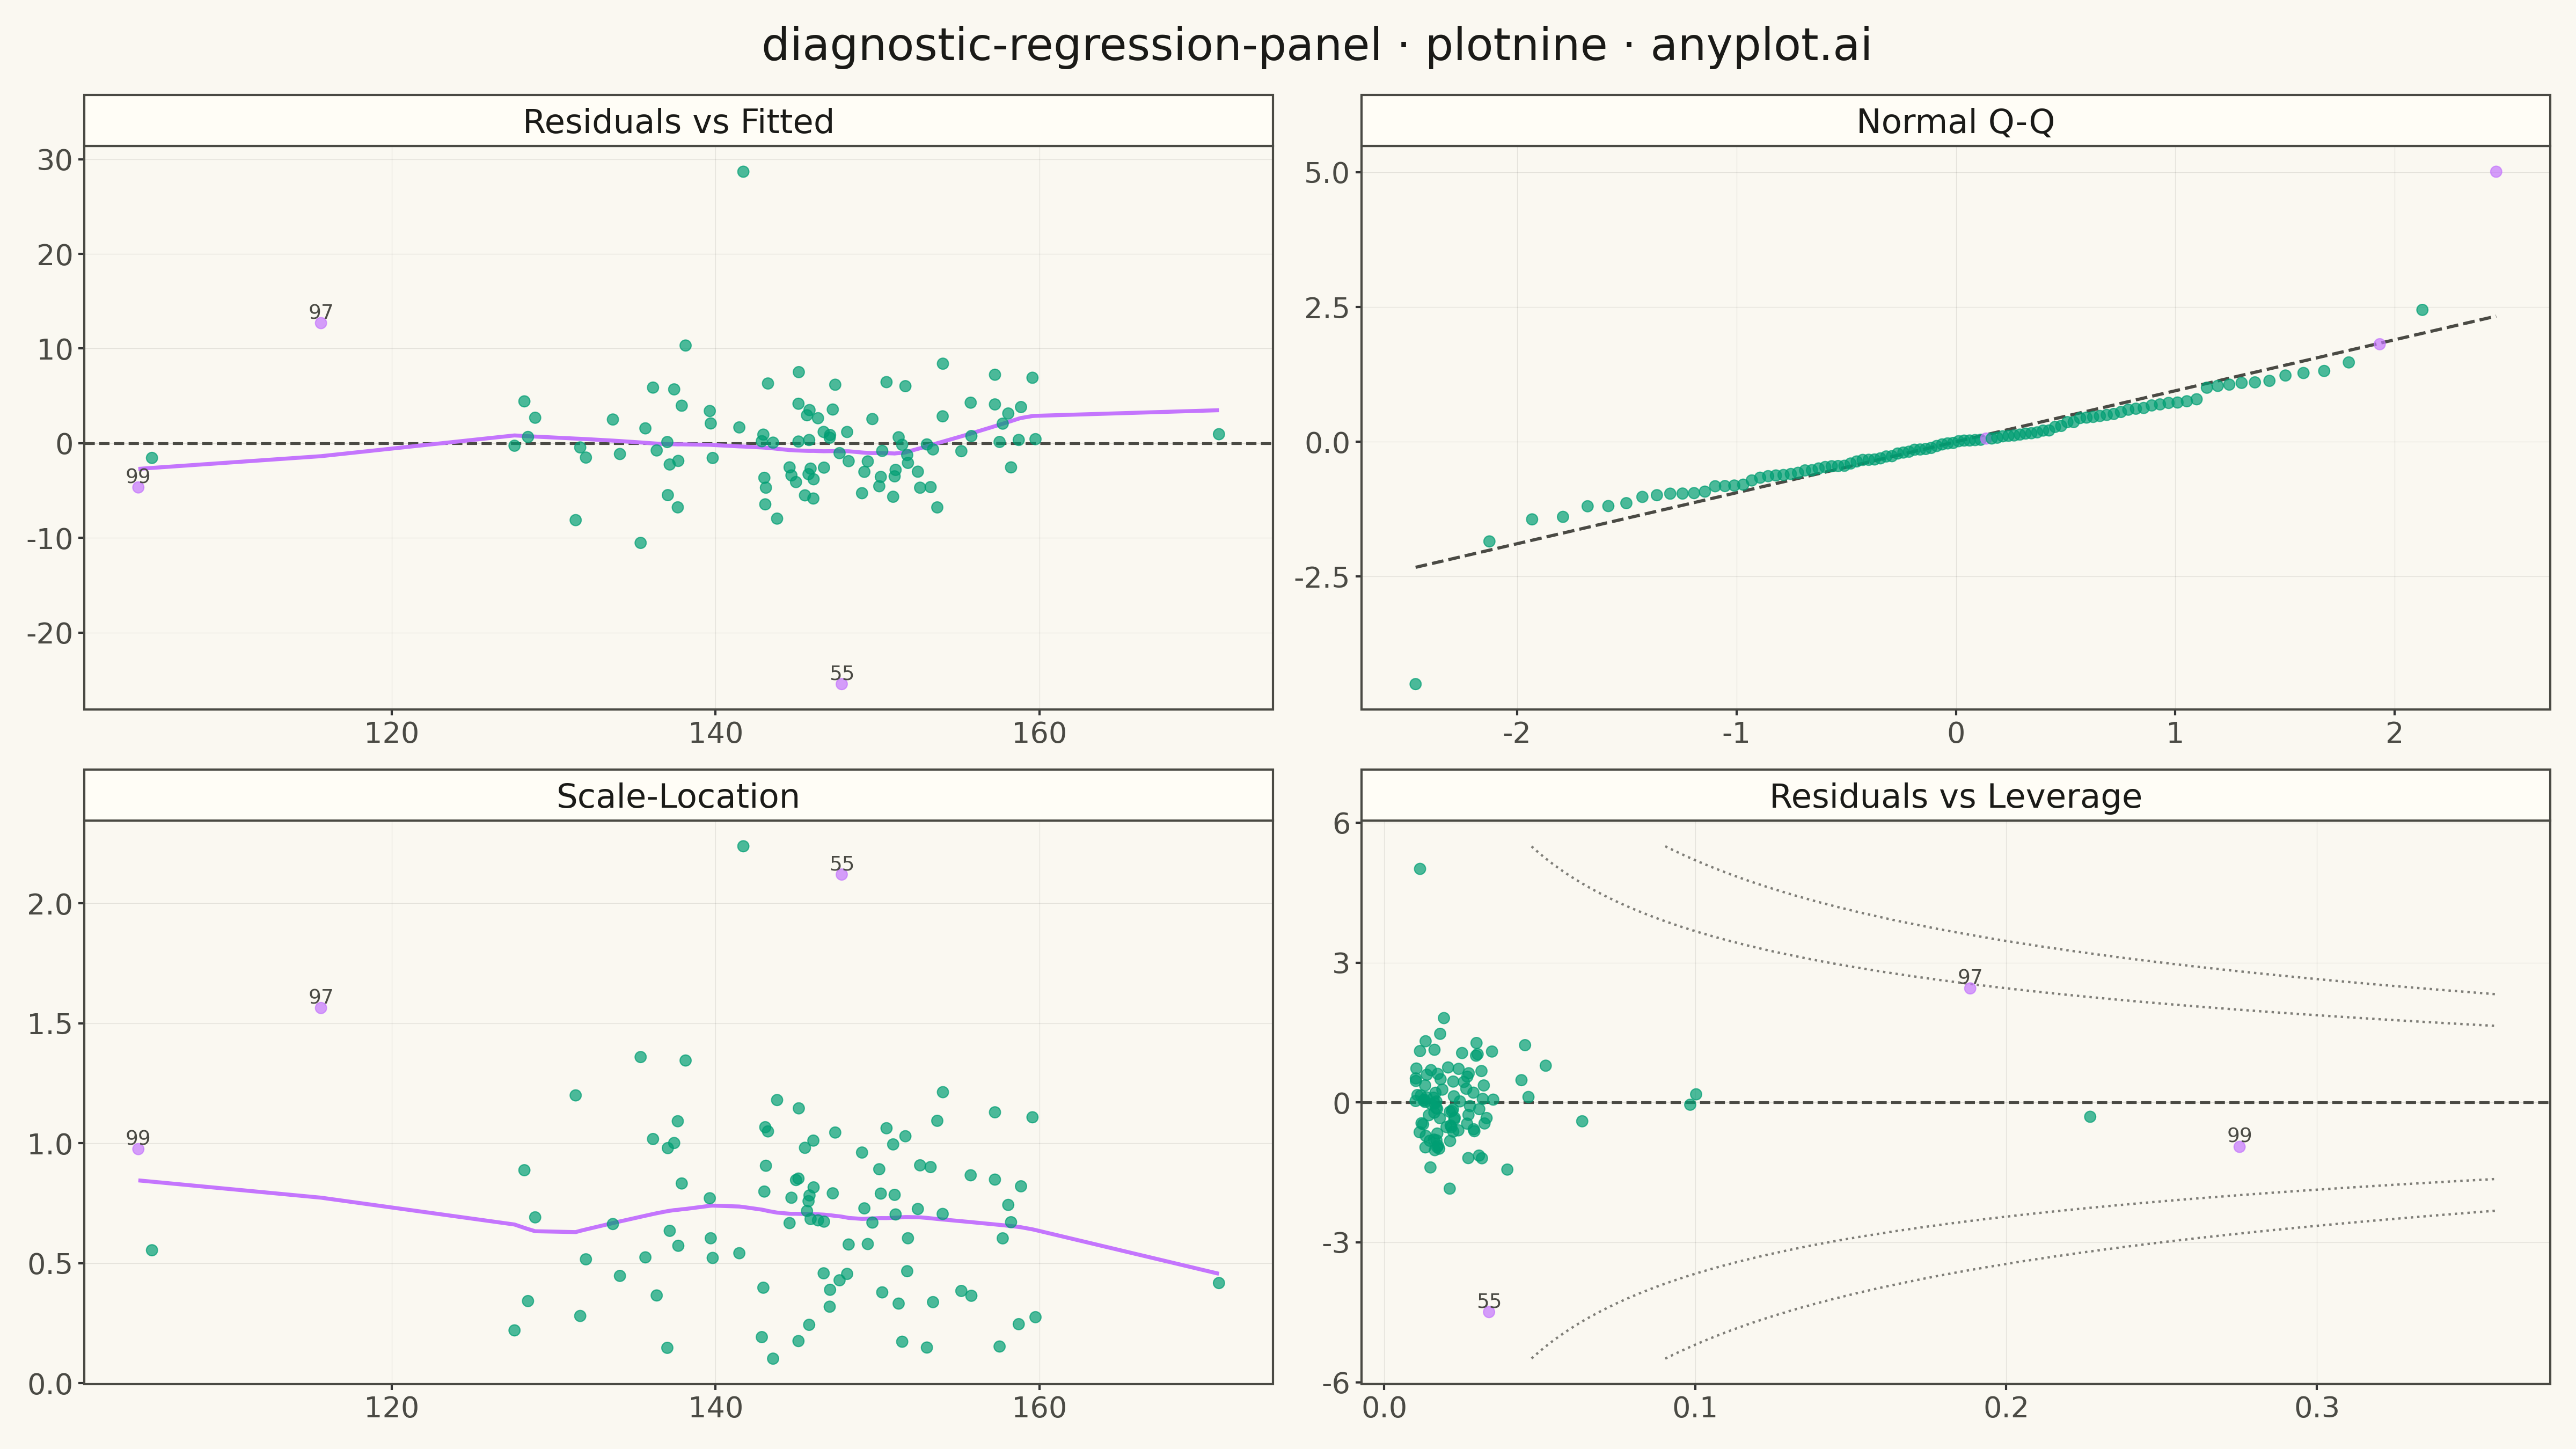
The same plot in 14 other libraries — Python: Altair, Bokeh, lets-plot, Matplotlib, Plotly, Pygal, Seaborn; R: ggplot2; Julia: Makie.jl; JavaScript: Chart.js, D3.js, Apache ECharts, Highcharts, MUI X Charts. Compare all 15 side by side: Regression Diagnostic Panel (Four-Plot Display) in Python, R, Julia and JavaScript.
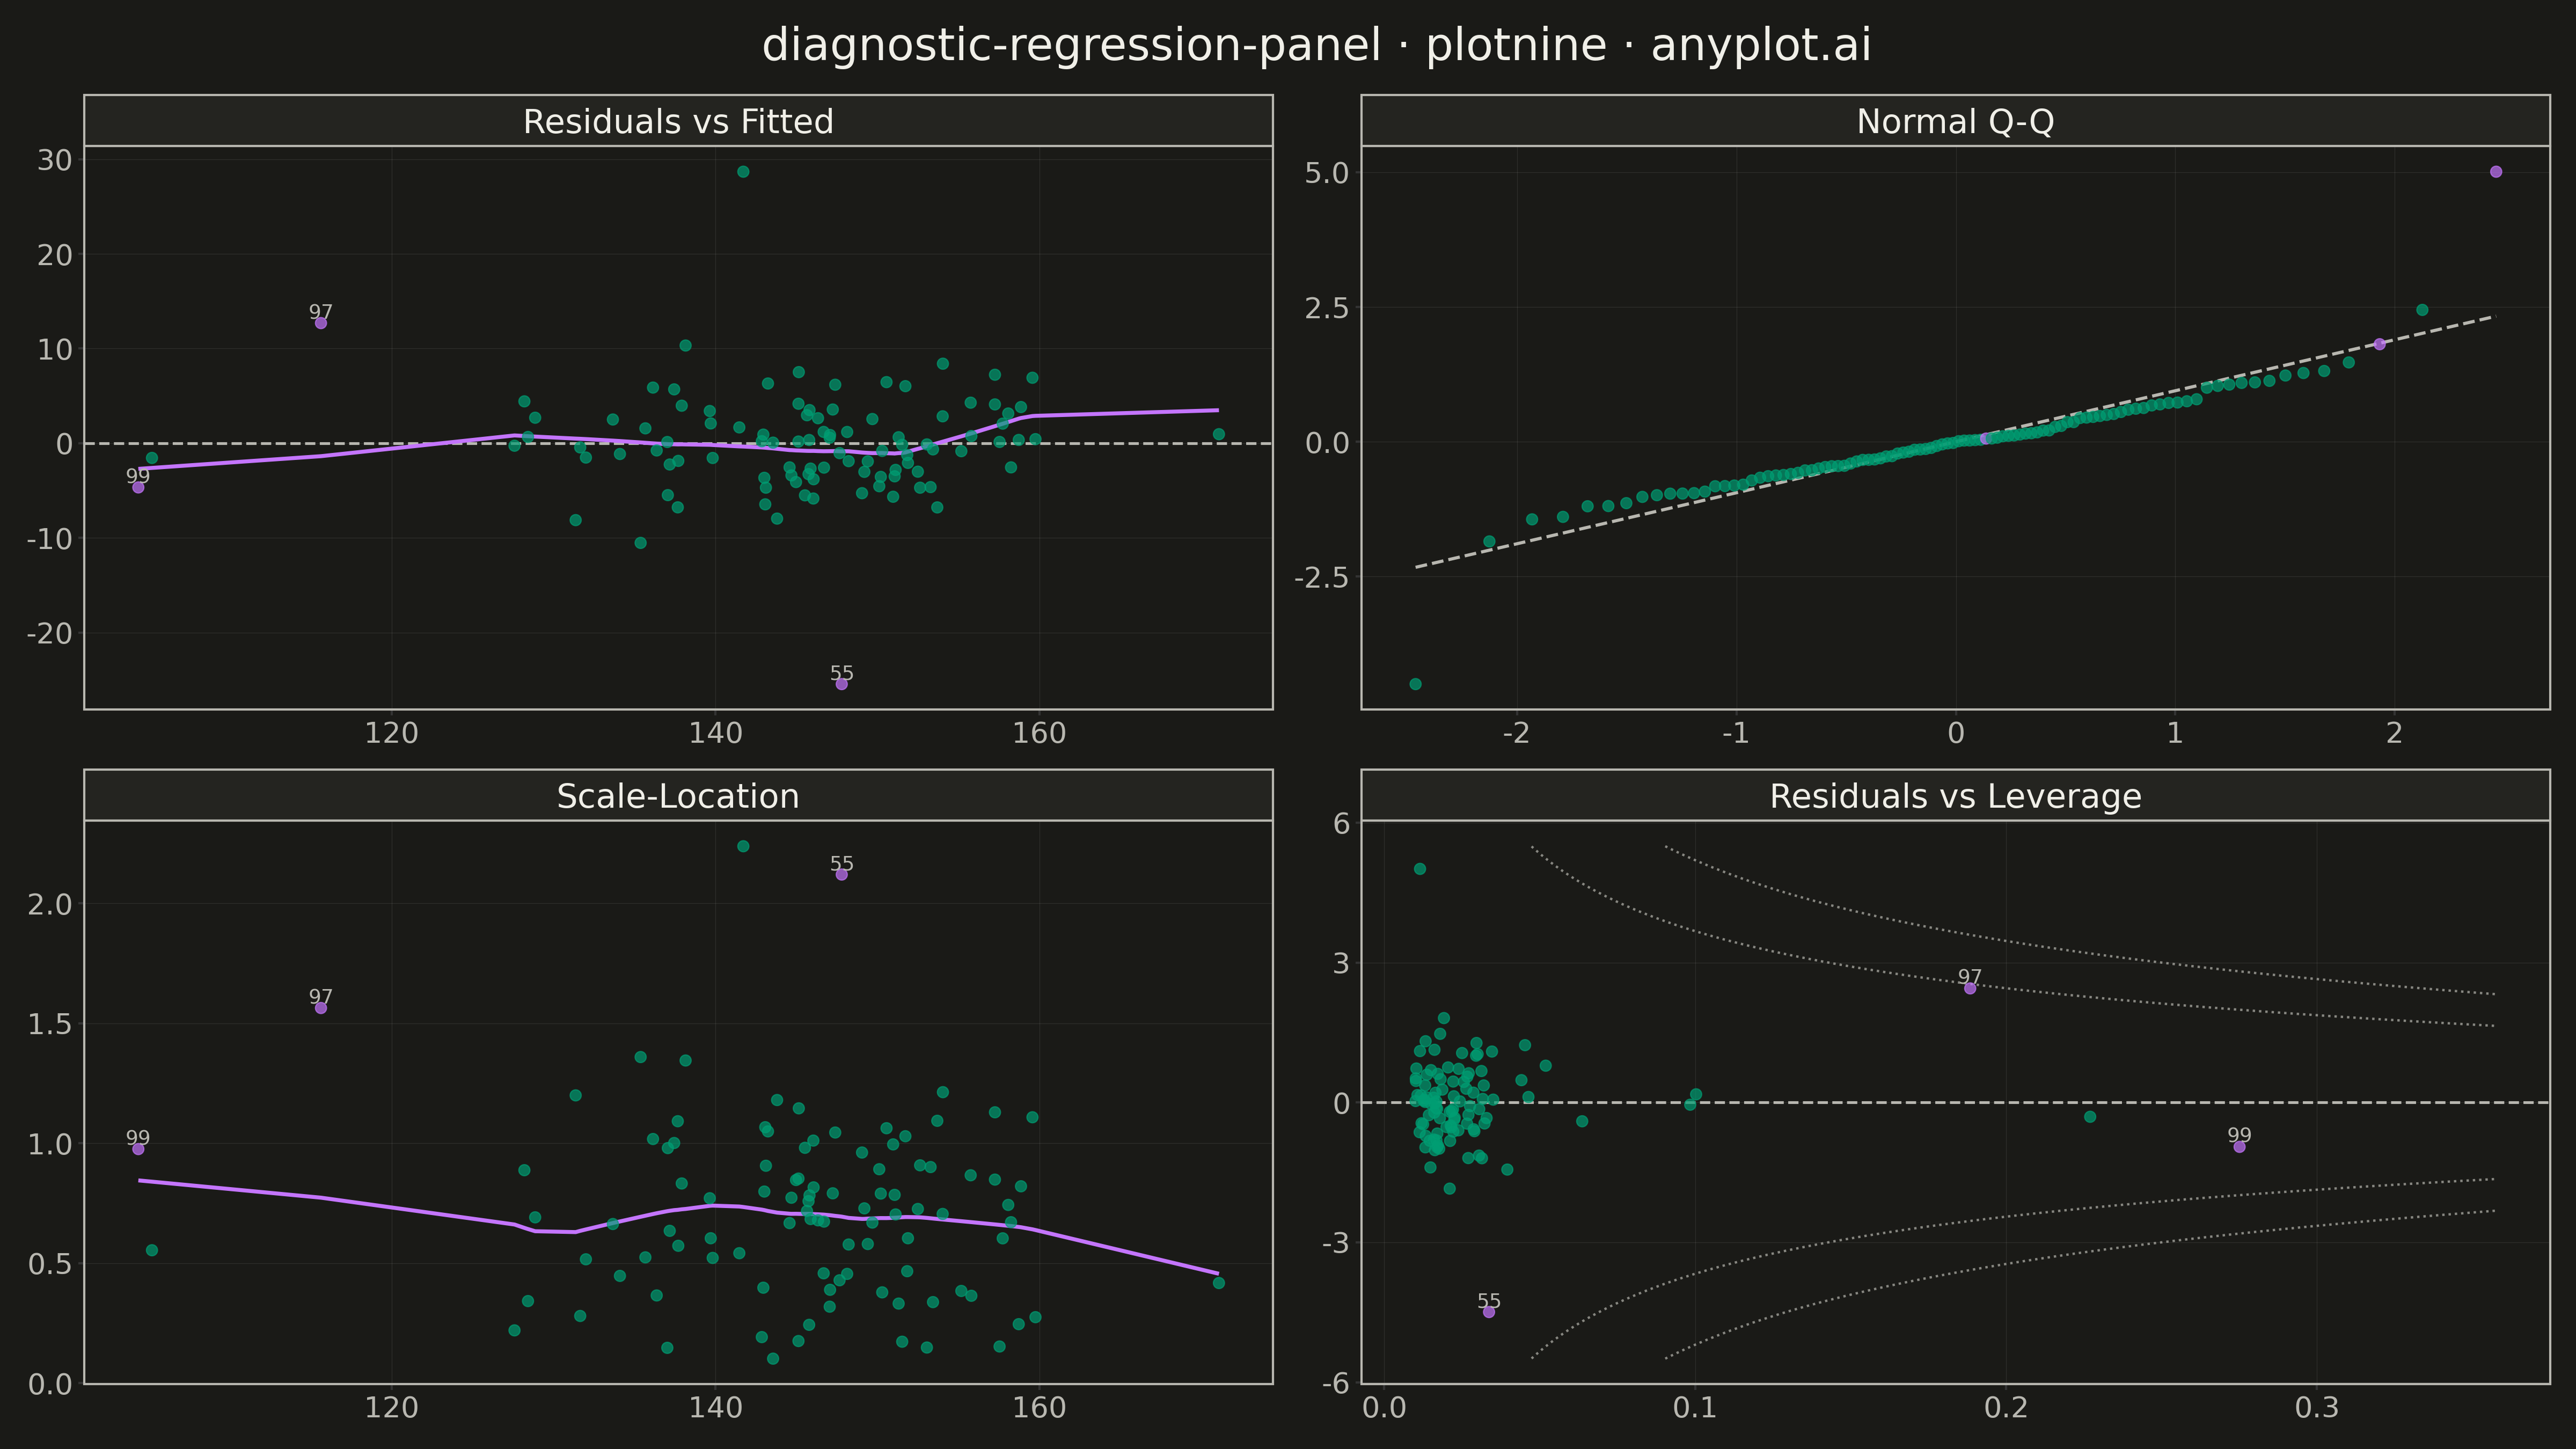
A 2x2 panel of diagnostic plots for evaluating linear regression model assumptions, replicating the classic output of R's `plot(lm)`. The four subplots are: (1) Residuals vs Fitted values to detect non-linearity and heteroscedasticity, (2) Normal Q-Q plot of standardized residuals to assess normality, (3) Scale-Location plot (square root of standardized residuals vs fitted values) to check homoscedasticity, and (4) Residuals vs Leverage with Cook's distance contours to identify influential observations. This composite display is the standard first step in regression model validation across statistics, academia, and regulated industries.
""" anyplot.ai
diagnostic-regression-panel: Regression Diagnostic Panel (Four-Plot Display)
Library: plotnine 0.15.4 | Python 3.13.13
Quality: 85/100 | Created: 2026-05-13
"""

import os
import site
import sys


# 'python plotnine.py' adds this file's directory to sys.path[0], shadowing
# the installed plotnine library. Insert site-packages at the front so the
# library is found before this file. ruff recognises sys.path.insert() as a
# valid pre-import path setup and does not raise E402 for subsequent imports.
sys.path.insert(0, site.getsitepackages()[0])

import numpy as np
import pandas as pd
from plotnine import (
    aes,
    element_blank,
    element_line,
    element_rect,
    element_text,
    facet_wrap,
    geom_hline,
    geom_line,
    geom_point,
    geom_text,
    ggplot,
    labs,
    scale_color_manual,
    theme,
)
from scipy.stats import probplot
from sklearn.linear_model import LinearRegression
from statsmodels.nonparametric.smoothers_lowess import lowess


# Theme tokens
THEME = os.getenv("ANYPLOT_THEME", "light")
PAGE_BG = "#FAF8F1" if THEME == "light" else "#1A1A17"
ELEVATED_BG = "#FFFDF6" if THEME == "light" else "#242420"
INK = "#1A1A17" if THEME == "light" else "#F0EFE8"
INK_SOFT = "#4A4A44" if THEME == "light" else "#B8B7B0"
BRAND = "#009E73"
ACCENT = "#C475FD"

# Data — materials-testing regression: tensile strength vs temperature and load
# Three high-leverage observations at extreme temperatures reveal influential points
np.random.seed(42)
n_main = 97
n_extreme = 3

temp_main = np.random.uniform(20, 80, n_main)
temp_extreme = np.array([180.0, 195.0, 210.0])
temperature = np.concatenate([temp_main, temp_extreme])

load_main = np.random.normal(50, 10, n_main)
load_extreme = np.random.normal(50, 10, n_extreme)
load = np.concatenate([load_main, load_extreme])

n = n_main + n_extreme
X = np.column_stack([np.ones(n), temperature, load])
p_full = X.shape[1]  # includes intercept column

# True relationship: strength declines with temperature, rises with load
# Heteroscedastic errors: variance grows with temperature
errors = np.random.normal(0, 2 + 0.04 * temperature, n)
strength = 120 - 0.3 * temperature + 0.8 * load + errors

# Add two response outliers at ordinary x-values
strength[20] += 25.0
strength[55] -= 28.0

# Fit OLS (without intercept column — sklearn adds intercept internally)
X_fit = np.column_stack([temperature, load])
model = LinearRegression()
model.fit(X_fit, strength)
fitted_vals = model.predict(X_fit)
residuals = strength - fitted_vals
k = X_fit.shape[1]  # number of predictors (excludes intercept)
p_hat = k + 1  # number of estimated parameters (including intercept)

# Hat matrix for leverage (include intercept column)
XtXinv = np.linalg.inv(X.T @ X)
H = X @ XtXinv @ X.T
leverage = np.diag(H)

# Internally studentized (standardized) residuals
sigma2 = np.sum(residuals**2) / (n - p_hat)
sigma = np.sqrt(sigma2)
std_residuals = residuals / (sigma * np.sqrt(np.clip(1 - leverage, 1e-10, None)))

# Cook's distance
cooks_d = (std_residuals**2 * leverage) / (p_hat * (1 - leverage))
top3_idx = set(np.argsort(cooks_d)[-3:])

# Q-Q data
(qq_theoretical, qq_observed), (qq_slope, qq_intercept, _) = probplot(std_residuals, dist="norm")

# LOWESS smoothers for panels 1 and 3
lw1 = lowess(residuals, fitted_vals, frac=0.55, return_sorted=True)
sqrt_abs_std = np.sqrt(np.abs(std_residuals))
lw3 = lowess(sqrt_abs_std, fitted_vals, frac=0.55, return_sorted=True)

# Panel names
PANELS = ["Residuals vs Fitted", "Normal Q-Q", "Scale-Location", "Residuals vs Leverage"]

# Main scatter data (long form)
obs_ids = list(range(n))
influence_flags = ["high" if i in top3_idx else "normal" for i in obs_ids]

df_main = pd.DataFrame(
    {
        "x_val": np.concatenate([fitted_vals, qq_theoretical, fitted_vals, leverage]),
        "y_val": np.concatenate([residuals, qq_observed, sqrt_abs_std, std_residuals]),
        "panel": pd.Categorical(
            PANELS[0:1] * n + PANELS[1:2] * n + PANELS[2:3] * n + PANELS[3:4] * n, categories=PANELS, ordered=True
        ),
        "obs_id": obs_ids * 4,
        "influence": pd.Categorical(influence_flags * 4, categories=["normal", "high"]),
    }
)

# LOWESS overlay — panels 1 and 3 only
df_lowess = pd.DataFrame(
    {
        "x_val": np.concatenate([lw1[:, 0], lw3[:, 0]]),
        "y_val": np.concatenate([lw1[:, 1], lw3[:, 1]]),
        "panel": pd.Categorical(PANELS[0:1] * len(lw1) + PANELS[2:3] * len(lw3), categories=PANELS, ordered=True),
    }
)

# Q-Q reference line — panel 2 only
qq_x_ends = np.array([qq_theoretical.min(), qq_theoretical.max()])
qq_y_ends = qq_slope * qq_x_ends + qq_intercept
df_qq_ref = pd.DataFrame(
    {"x_val": qq_x_ends, "y_val": qq_y_ends, "panel": pd.Categorical(PANELS[1:2] * 2, categories=PANELS, ordered=True)}
)

# Zero reference lines — panels 1 and 4
df_hline = pd.DataFrame(
    {"yintercept": [0.0, 0.0], "panel": pd.Categorical([PANELS[0], PANELS[3]], categories=PANELS, ordered=True)}
)

# Cook's distance contours — panel 4
# With high-leverage extreme-temperature observations, h can reach ~0.3,
# making D=0.5 and D=1.0 contours visible within |std_resid| ≤ 3
h_max_plot = leverage.max() * 1.3
h_grid = np.linspace(1e-4, min(h_max_plot, 0.995), 500)
sr_clip = max(np.abs(std_residuals).max() * 1.1, 3.5)
cook_segs = []
for gid, (level, sign) in enumerate([(0.5, 1), (0.5, -1), (1.0, 1), (1.0, -1)]):
    sr = sign * np.sqrt(level * p_hat * (1 - h_grid) / h_grid)
    mask = np.abs(sr) <= sr_clip
    if mask.sum() > 1:
        cook_segs.append(
            pd.DataFrame(
                {
                    "x_val": h_grid[mask],
                    "y_val": sr[mask],
                    "panel": pd.Categorical([PANELS[3]] * mask.sum(), categories=PANELS, ordered=True),
                    "cook_group": [gid] * mask.sum(),
                }
            )
        )

if cook_segs:
    df_cook = pd.concat(cook_segs, ignore_index=True)
else:
    df_cook = pd.DataFrame(
        {
            "x_val": pd.Series(dtype=float),
            "y_val": pd.Series(dtype=float),
            "panel": pd.Categorical([], categories=PANELS, ordered=True),
            "cook_group": pd.Series(dtype=int),
        }
    )

# Labels for top influential points (panels 1, 3, 4 — not Q-Q)
label_panels = [PANELS[0], PANELS[2], PANELS[3]]
df_labels = df_main[(df_main["influence"] == "high") & df_main["panel"].isin(label_panels)].copy()
df_labels["label"] = df_labels["obs_id"].astype(str)

# Theme
anyplot_theme = theme(
    figure_size=(16, 9),
    plot_background=element_rect(fill=PAGE_BG, color=PAGE_BG),
    panel_background=element_rect(fill=PAGE_BG),
    panel_grid_major=element_line(color=INK, size=0.3, alpha=0.10),
    panel_grid_minor=element_blank(),
    panel_border=element_rect(color=INK_SOFT, fill=None),
    axis_title=element_text(color=INK, size=16),
    axis_text=element_text(color=INK_SOFT, size=13),
    plot_title=element_text(color=INK, size=20),
    strip_background=element_rect(fill=ELEVATED_BG, color=INK_SOFT),
    strip_text=element_text(color=INK, size=15),
    legend_position="none",
)

# Plot
plot = (
    ggplot(df_main, aes(x="x_val", y="y_val"))
    + geom_hline(data=df_hline, mapping=aes(yintercept="yintercept"), color=INK_SOFT, linetype="dashed", size=0.7)
    + geom_line(data=df_lowess, mapping=aes(x="x_val", y="y_val"), color=ACCENT, size=1.0)
    + geom_line(data=df_qq_ref, mapping=aes(x="x_val", y="y_val"), color=INK_SOFT, size=0.8, linetype="dashed")
    + geom_line(
        data=df_cook,
        mapping=aes(x="x_val", y="y_val", group="cook_group"),
        color=INK_SOFT,
        size=0.6,
        linetype="dotted",
        alpha=0.7,
    )
    + geom_point(aes(color="influence"), size=2.5, alpha=0.7, stroke=0.3)
    + scale_color_manual(values={"normal": BRAND, "high": ACCENT})
    + geom_text(data=df_labels, mapping=aes(label="label"), va="bottom", size=9, color=INK_SOFT)
    + facet_wrap("~panel", scales="free", ncol=2)
    + labs(title="diagnostic-regression-panel · plotnine · anyplot.ai", x="", y="")
    + anyplot_theme
)

# Save
plot.save(f"plot-{THEME}.png", dpi=300)
Runnable source as JSON, for any HTTP client: https://api.anyplot.ai/specs/diagnostic-regression-panel/plotnine/code. Any spec id and library id listed in llms-full.txt fit the same URL shape; every URL below is complete and callable.
{
  "spec_id": "diagnostic-regression-panel",
  "language": "python",
  "library": "plotnine",
  "page": "https://anyplot.ai/diagnostic-regression-panel/python/plotnine",
  "hub": "https://anyplot.ai/diagnostic-regression-panel",
  "code_json": "https://api.anyplot.ai/specs/diagnostic-regression-panel/plotnine/code",
  "spec_json": "https://api.anyplot.ai/specs/diagnostic-regression-panel",
  "render_light_png": "https://storage.googleapis.com/anyplot-images/plots/diagnostic-regression-panel/python/plotnine/plot-light.png",
  "render_dark_png": "https://storage.googleapis.com/anyplot-images/plots/diagnostic-regression-panel/python/plotnine/plot-dark.png",
  "quality_score": 85.0,
  "license": "MIT",
  "guide": "https://anyplot.ai/llms.txt"
}
Part of Regression Diagnostic Panel (Four-Plot Display) on anyplot.ai.