The same plot in 14 other libraries — JavaScript: Chart.js, Apache ECharts, Highcharts, MUI X Charts; Python: Altair, Bokeh, lets-plot, Matplotlib, Plotly, plotnine, Pygal, Seaborn; R: ggplot2; Julia: Makie.jl. Compare all 15 side by side: Step Histogram in Python, R, Julia and JavaScript.
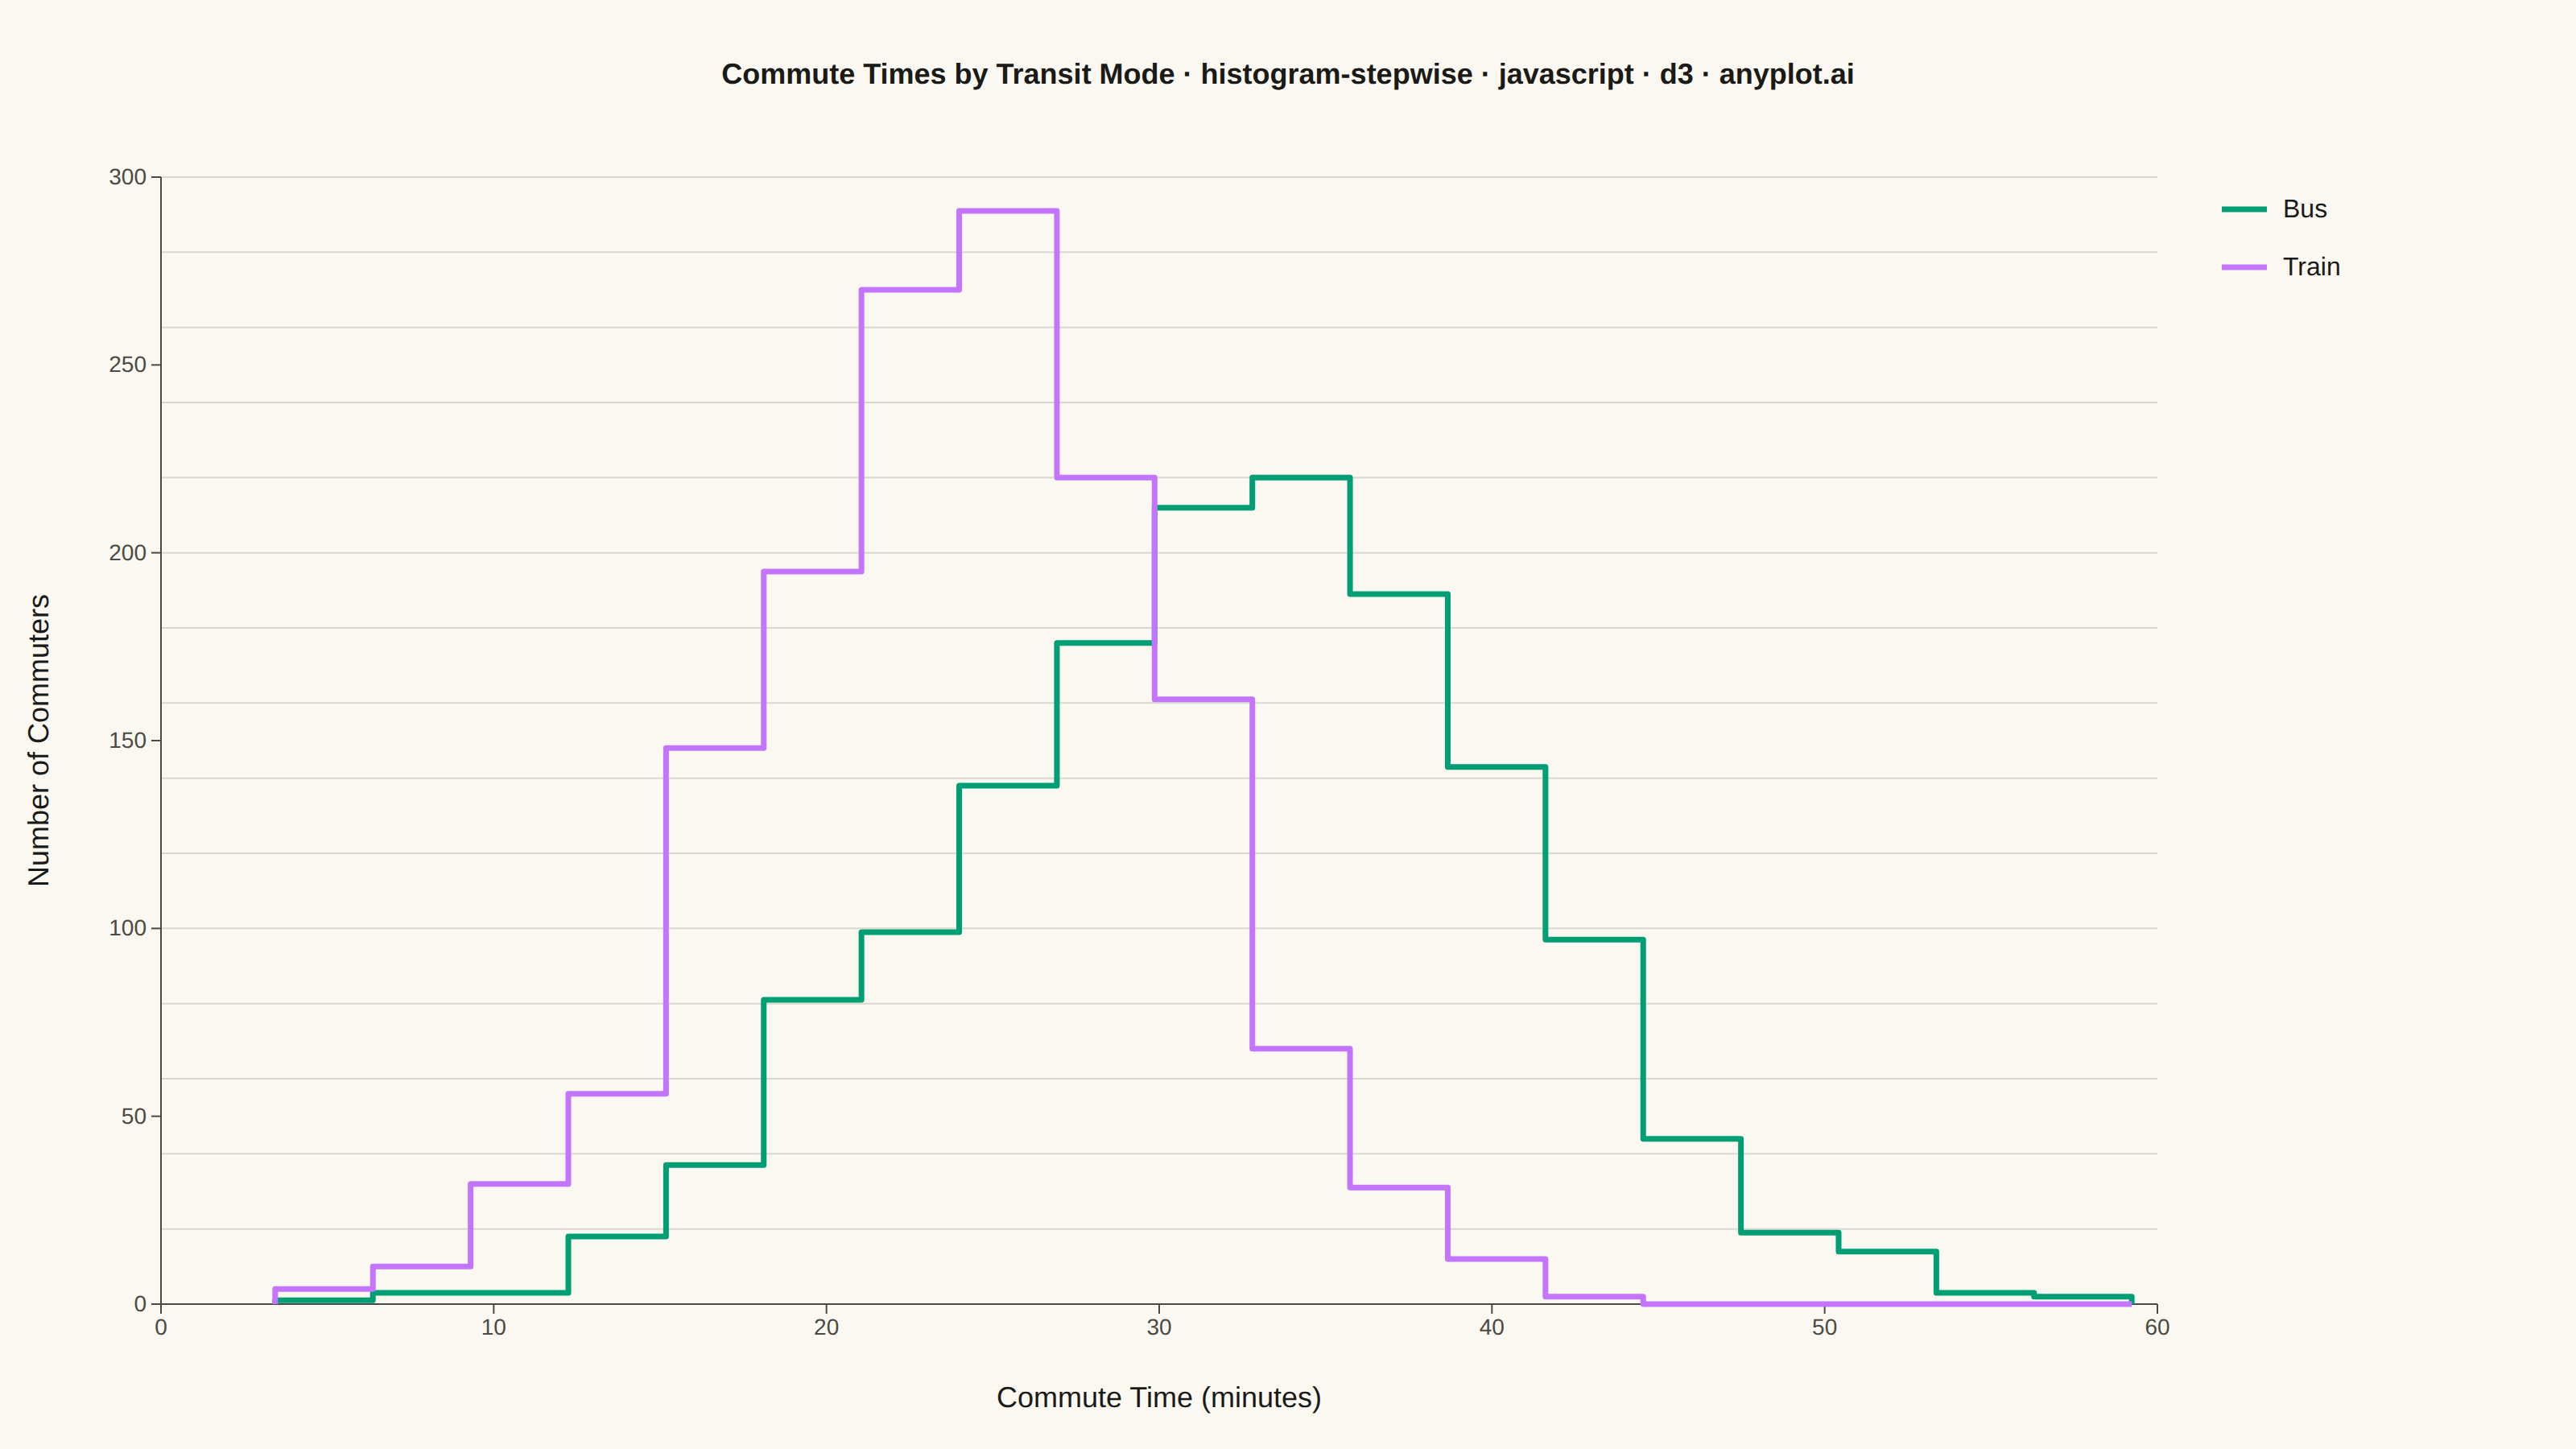
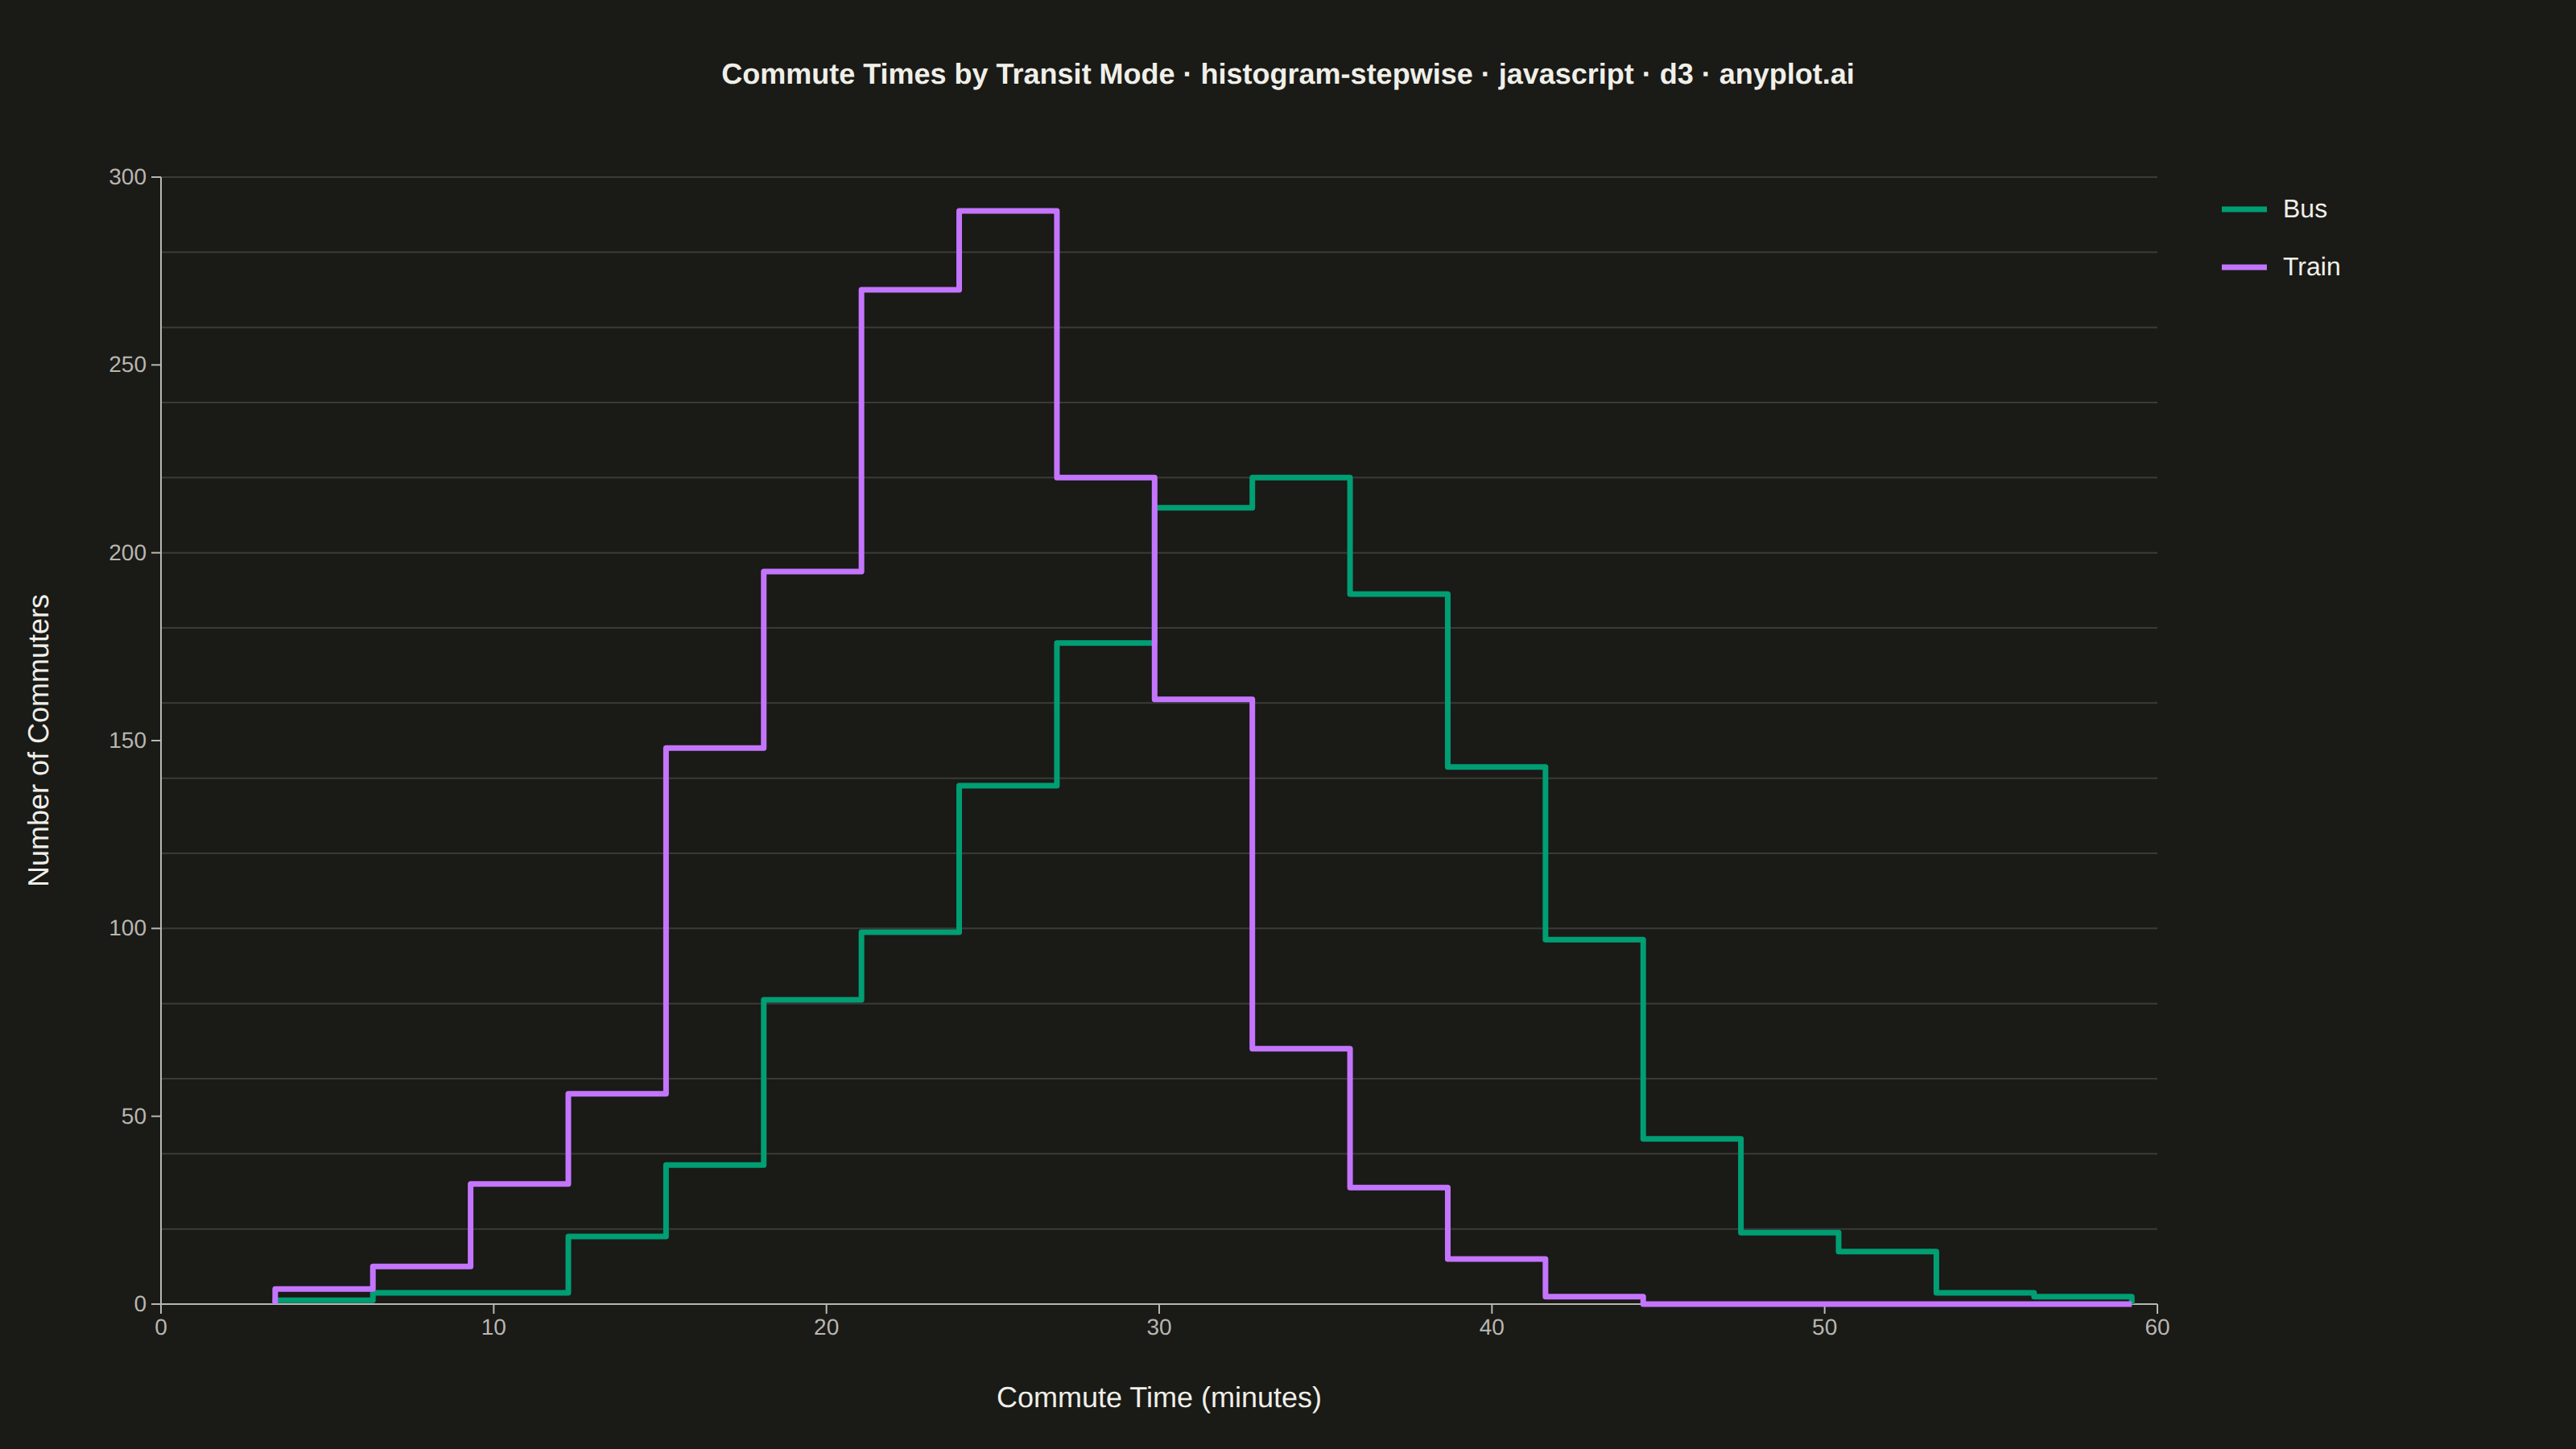
A histogram displayed as step lines (outline only) without filled bars. The distribution is shown as connected horizontal and vertical line segments, creating a step function appearance.
// anyplot.ai
// histogram-stepwise: Step Histogram
// Library: d3 7.9.0 | JavaScript 22.23.2
// Quality: 86/100 | Created: 2026-09-05

const t = window.ANYPLOT_TOKENS;
const { width, height } = window.ANYPLOT_SIZE;
const margin = { top: 110, right: 260, bottom: 90, left: 100 };
const iw = width - margin.left - margin.right;
const ih = height - margin.top - margin.bottom;

// --- Data (in-memory, deterministic LCG — no seeded RNG in the browser) -----
function lcg(seed) {
  let state = seed >>> 0;
  return () => {
    state = (state * 1664525 + 1013904223) >>> 0;
    return state / 4294967296;
  };
}

function approxNormal(rand) {
  // Irwin-Hall sum-of-12-uniforms approximation of a standard normal draw
  let sum = 0;
  for (let i = 0; i < 12; i += 1) sum += rand();
  return sum - 6;
}

function commuteTimes(rand, mean, sd, n) {
  const out = [];
  for (let i = 0; i < n; i += 1) {
    out.push(Math.max(2, mean + sd * approxNormal(rand)));
  }
  return out;
}

const busTimes = commuteTimes(lcg(42), 32, 8, 1500);
const trainTimes = commuteTimes(lcg(1337), 24, 6, 1500);

// Shared bin thresholds so both step outlines are directly comparable
const combined = busTimes.concat(trainTimes);
const domainMin = d3.min(combined);
const domainMax = d3.max(combined);
const thresholds = d3.range(20).map((i) => domainMin + ((domainMax - domainMin) * i) / 19);

const bin = d3.bin().domain([domainMin, domainMax]).thresholds(thresholds);
const busBins = bin(busTimes);
const trainBins = bin(trainTimes);

// --- Scales -------------------------------------------------------------
const x = d3.scaleLinear().domain([domainMin, domainMax]).nice().range([0, iw]);
const maxCount = Math.max(d3.max(busBins, (b) => b.length), d3.max(trainBins, (b) => b.length));
const y = d3.scaleLinear().domain([0, maxCount]).nice().range([ih, 0]);

// Build step-outline points: horizontal segment per bin, vertical connector
// between bins, and a drop to zero at both ends — matplotlib histtype='step' style
function stepPoints(bins) {
  const points = [[bins[0].x0, 0]];
  for (const b of bins) {
    points.push([b.x0, b.length]);
    points.push([b.x1, b.length]);
  }
  points.push([bins[bins.length - 1].x1, 0]);
  return points;
}

const stepLine = d3
  .line()
  .x((d) => x(d[0]))
  .y((d) => y(d[1]));

// --- SVG mount ------------------------------------------------------------
const svg = d3.select("#container").append("svg").attr("width", width).attr("height", height);
svg.append("rect").attr("width", width).attr("height", height).attr("fill", t.pageBg);
const g = svg.append("g").attr("transform", `translate(${margin.left},${margin.top})`);

// --- Gridlines (y-axis only, subtle) ---------------------------------------
g.append("g")
  .attr("class", "grid")
  .call(d3.axisLeft(y).tickSize(-iw).tickFormat(""))
  .selectAll("line")
  .attr("stroke", t.grid);
g.select(".grid .domain").remove();

// --- Axes -------------------------------------------------------------------
const xAxis = g
  .append("g")
  .attr("transform", `translate(0,${ih})`)
  .call(d3.axisBottom(x).ticks(8).tickSizeOuter(0));
const yAxis = g.append("g").call(d3.axisLeft(y).ticks(6).tickSizeOuter(0));
for (const ax of [xAxis, yAxis]) {
  ax.selectAll("text").attr("fill", t.inkSoft).style("font-size", "14px");
  ax.selectAll("line").attr("stroke", t.inkSoft);
  ax.select(".domain").attr("stroke", t.inkSoft);
}

// --- Step outlines (no fill, matching the spec's unfilled requirement) ----
const series = [
  { label: "Bus", bins: busBins, color: t.palette[0] },
  { label: "Train", bins: trainBins, color: t.palette[1] },
];

for (const s of series) {
  g.append("path")
    .datum(stepPoints(s.bins))
    .attr("fill", "none")
    .attr("stroke", s.color)
    .attr("stroke-width", 3.5)
    .attr("stroke-linejoin", "round")
    .attr("d", stepLine);
}

// --- Axis labels --------------------------------------------------------
g.append("text")
  .attr("x", iw / 2)
  .attr("y", ih + 64)
  .attr("text-anchor", "middle")
  .attr("fill", t.ink)
  .style("font-size", "18px")
  .text("Commute Time (minutes)");

g.append("text")
  .attr("transform", "rotate(-90)")
  .attr("x", -ih / 2)
  .attr("y", -70)
  .attr("text-anchor", "middle")
  .attr("fill", t.ink)
  .style("font-size", "18px")
  .text("Number of Commuters");

// --- Legend -----------------------------------------------------------------
const legend = svg
  .append("g")
  .attr("transform", `translate(${margin.left + iw + 40},${margin.top + 20})`);
series.forEach((s, i) => {
  const row = legend.append("g").attr("transform", `translate(0,${i * 36})`);
  row.append("line").attr("x1", 0).attr("x2", 28).attr("y1", 0).attr("y2", 0)
    .attr("stroke", s.color).attr("stroke-width", 3.5);
  row.append("text").attr("x", 38).attr("y", 5).attr("fill", t.ink)
    .style("font-size", "16px").text(s.label);
});

// --- Title ------------------------------------------------------------------
svg
  .append("text")
  .attr("x", width / 2)
  .attr("y", 52)
  .attr("text-anchor", "middle")
  .attr("fill", t.ink)
  .style("font-size", "18px")
  .style("font-weight", "600")
  .text("Commute Times by Transit Mode · histogram-stepwise · javascript · d3 · anyplot.ai");
Runnable source as JSON, for any HTTP client: https://api.anyplot.ai/specs/histogram-stepwise/d3/code. Any spec id and library id listed in llms-full.txt fit the same URL shape; every URL below is complete and callable.
{
  "spec_id": "histogram-stepwise",
  "language": "javascript",
  "library": "d3",
  "page": "https://anyplot.ai/histogram-stepwise/javascript/d3",
  "hub": "https://anyplot.ai/histogram-stepwise",
  "code_json": "https://api.anyplot.ai/specs/histogram-stepwise/d3/code",
  "spec_json": "https://api.anyplot.ai/specs/histogram-stepwise",
  "render_light_png": "https://storage.googleapis.com/anyplot-images/plots/histogram-stepwise/javascript/d3/plot-light.png",
  "render_dark_png": "https://storage.googleapis.com/anyplot-images/plots/histogram-stepwise/javascript/d3/plot-dark.png",
  "interactive_light_html": "https://storage.googleapis.com/anyplot-images/plots/histogram-stepwise/javascript/d3/plot-light.html",
  "interactive_dark_html": "https://storage.googleapis.com/anyplot-images/plots/histogram-stepwise/javascript/d3/plot-dark.html",
  "quality_score": 86.0,
  "license": "MIT",
  "guide": "https://anyplot.ai/llms.txt"
}
Part of Step Histogram on anyplot.ai.