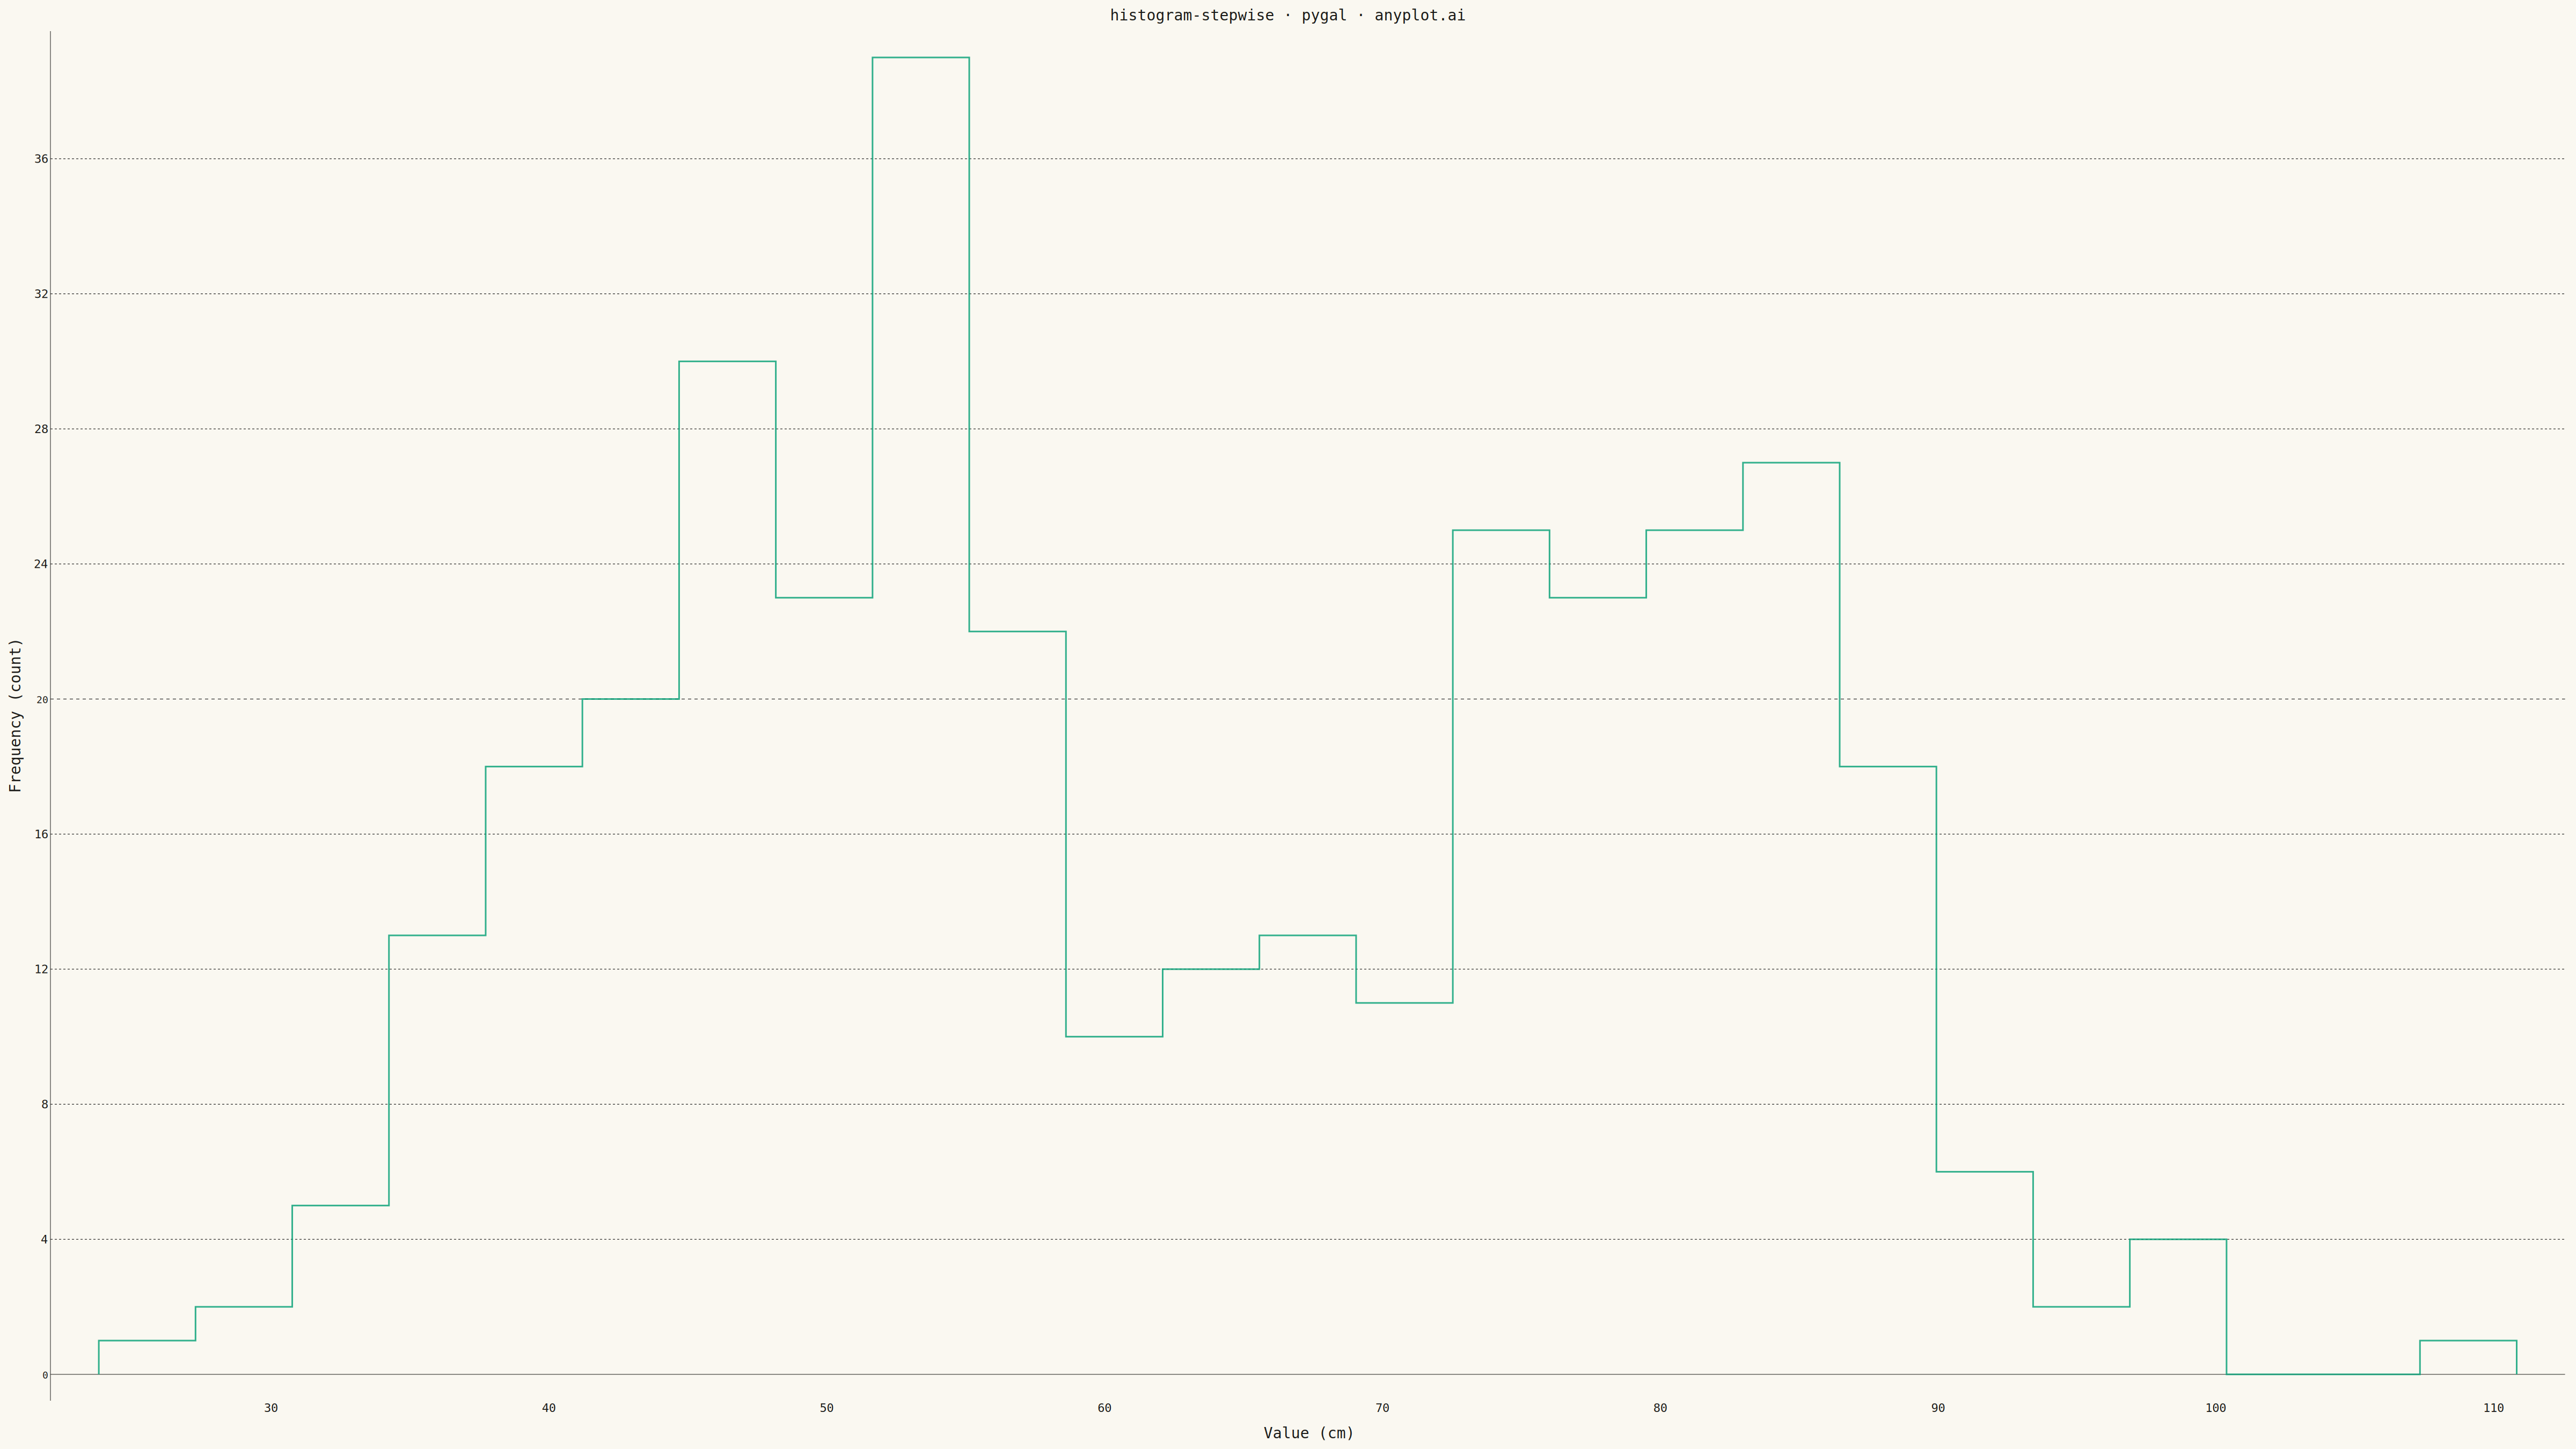
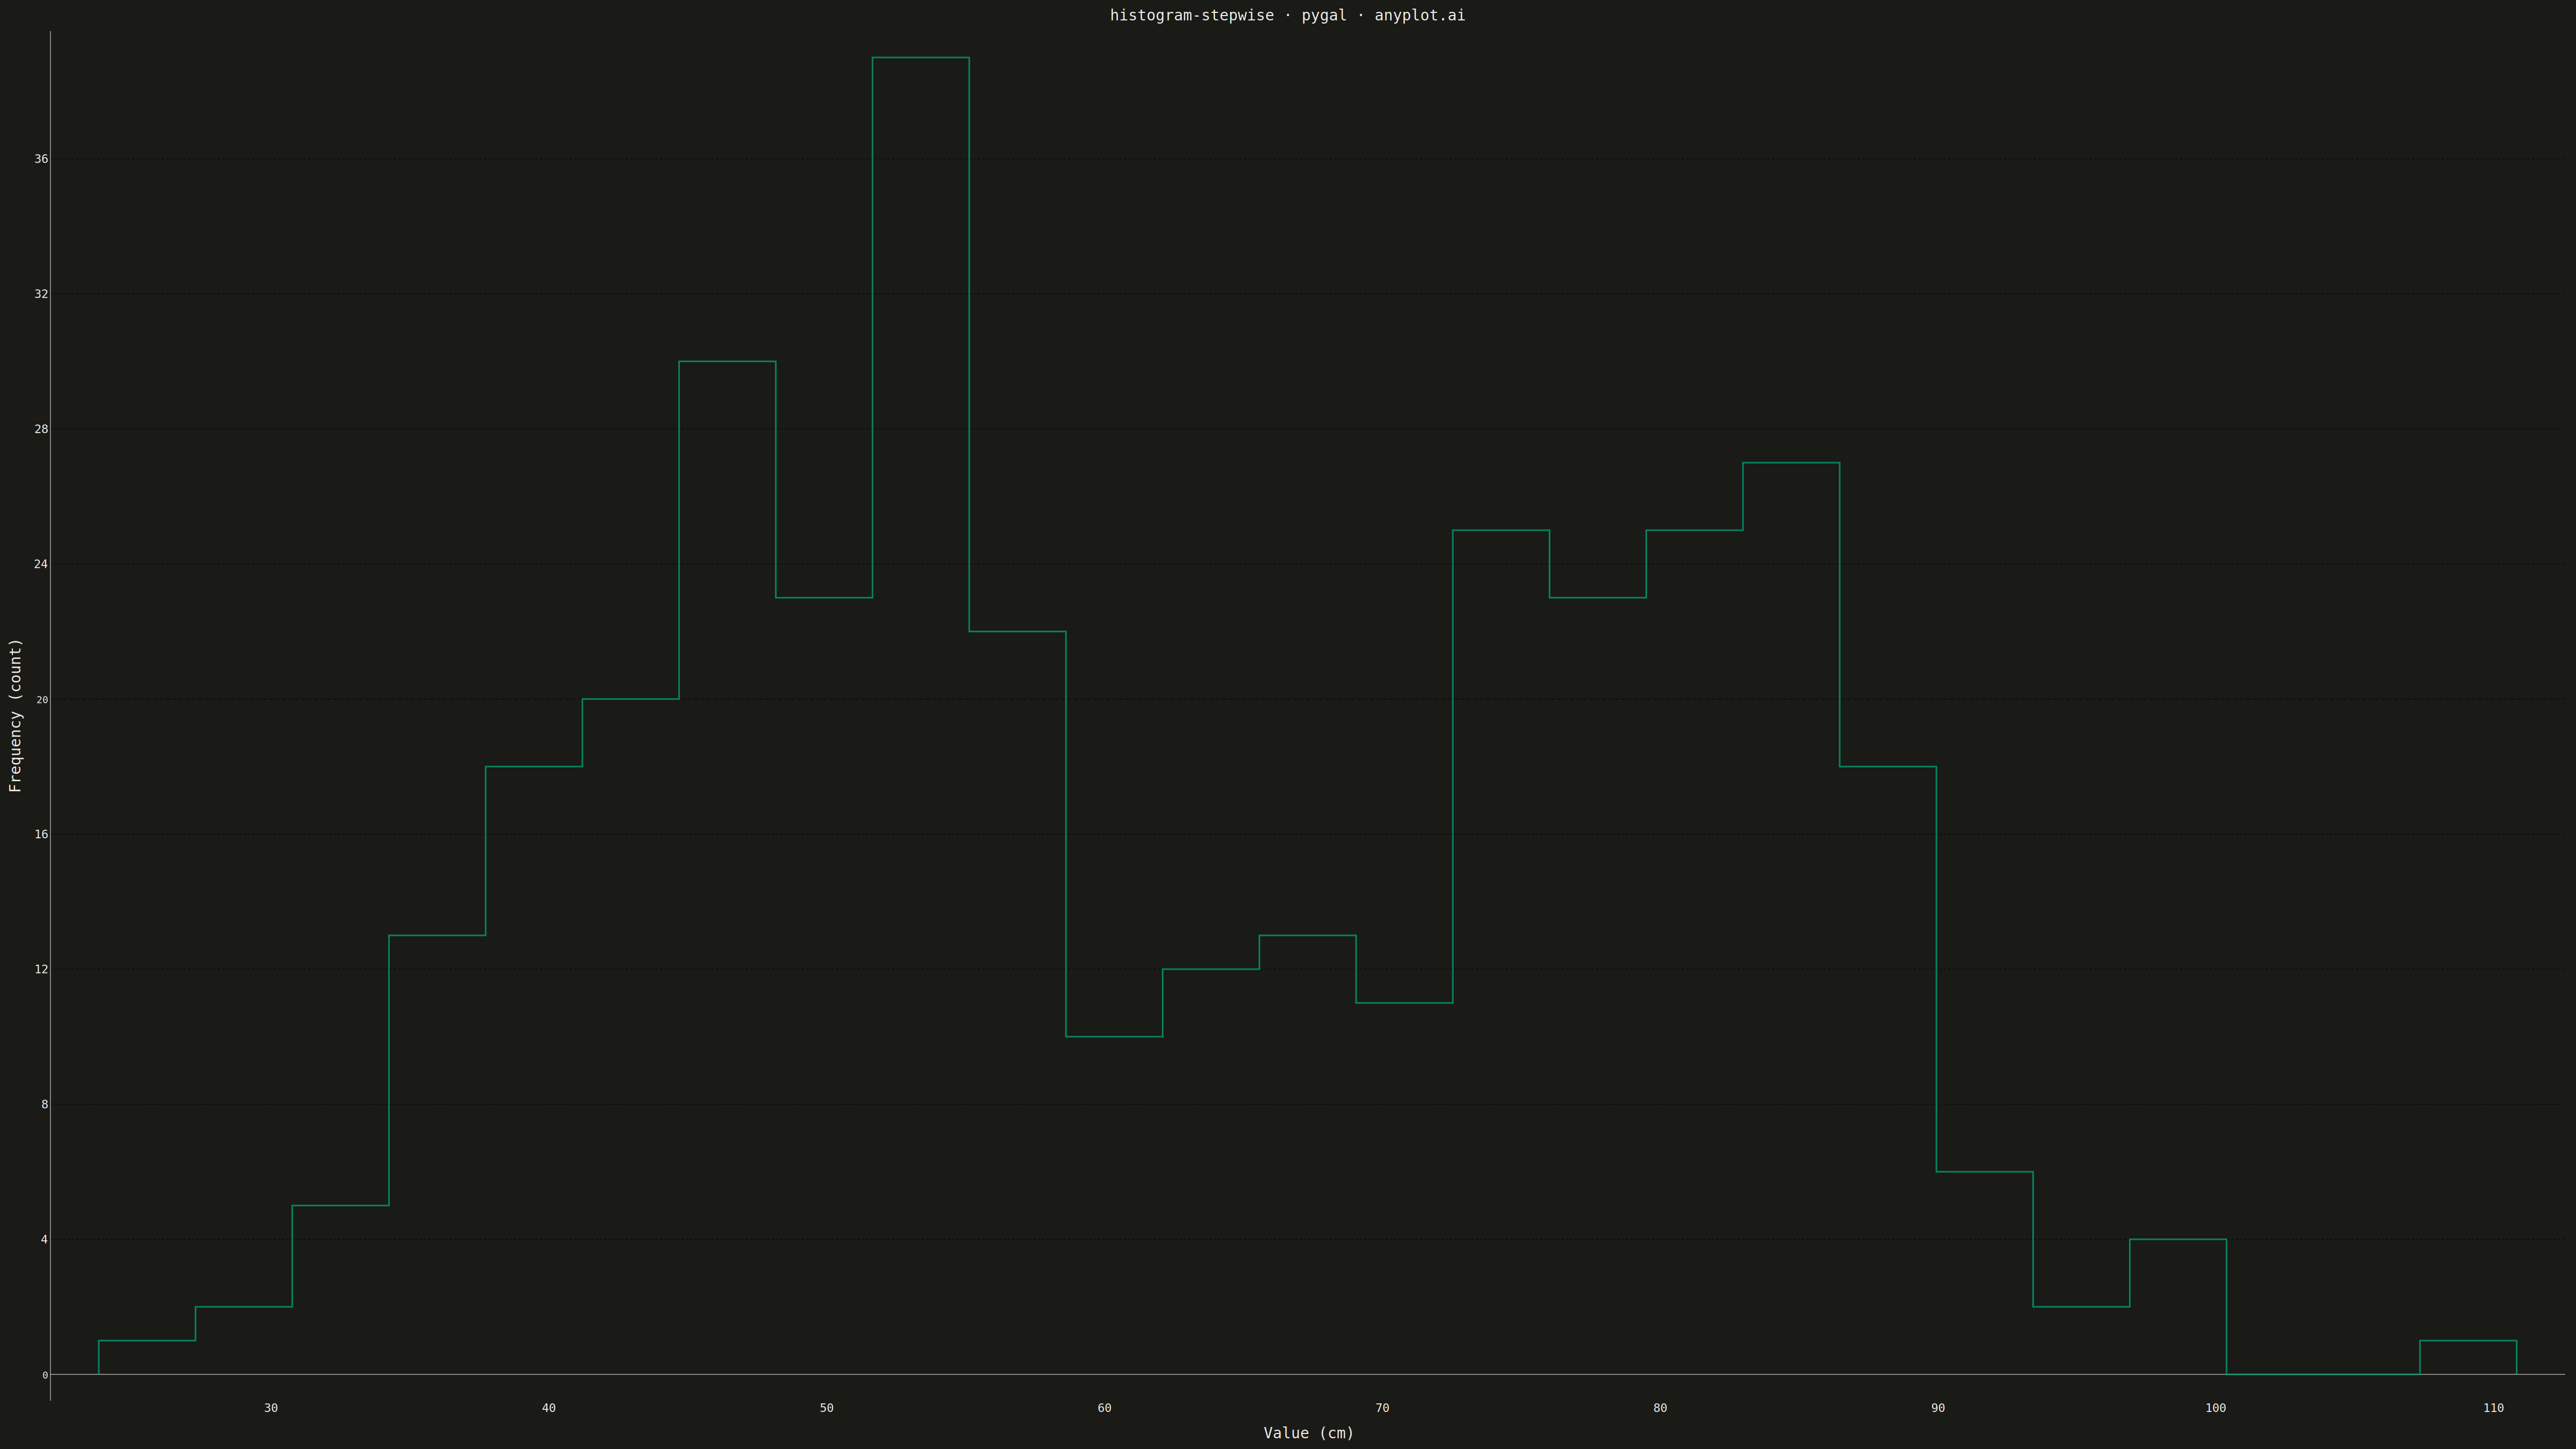
A histogram displayed as step lines (outline only) without filled bars. The distribution is shown as connected horizontal and vertical line segments, creating a step function appearance.
""" anyplot.ai
histogram-stepwise: Step Histogram
Library: pygal 3.1.0 | Python 3.13.13
Quality: 85/100 | Updated: 2026-05-12
"""

import os

import numpy as np
import pygal
from pygal.style import Style


# Theme tokens
THEME = os.getenv("ANYPLOT_THEME", "light")
PAGE_BG = "#FAF8F1" if THEME == "light" else "#1A1A17"
ELEVATED_BG = "#FFFDF6" if THEME == "light" else "#242420"
INK = "#1A1A17" if THEME == "light" else "#F0EFE8"
INK_SOFT = "#4A4A44" if THEME == "light" else "#B8B7B0"
INK_MUTED = "#6B6A63" if THEME == "light" else "#A8A79F"

IMPRINT = ("#009E73", "#C475FD", "#4467A3", "#BD8233", "#AE3030", "#2ABCCD", "#954477")

# Data
np.random.seed(42)
values = np.concatenate([np.random.normal(50, 10, 200), np.random.normal(80, 8, 150)])

# Compute histogram bins
counts, bin_edges = np.histogram(values, bins=25)

# Build step coordinates for pygal.XY
# Step histogram: horizontal segments at count levels, vertical connections
step_data = []
for i in range(len(counts)):
    left = bin_edges[i]
    right = bin_edges[i + 1]
    count = counts[i]
    # Horizontal segment for this bin
    step_data.append((left, count))
    step_data.append((right, count))

# Add baseline at start and end
step_data.insert(0, (bin_edges[0], 0))
step_data.append((bin_edges[-1], 0))

# Custom style for large canvas
custom_style = Style(
    background=PAGE_BG,
    plot_background=PAGE_BG,
    foreground=INK,
    foreground_strong=INK,
    foreground_subtle=INK_MUTED,
    colors=IMPRINT,
    title_font_size=28,
    label_font_size=22,
    major_label_font_size=18,
    legend_font_size=16,
    value_font_size=14,
    stroke_width=3,
)

# Create XY chart for step lines
chart = pygal.XY(
    width=4800,
    height=2700,
    style=custom_style,
    title="histogram-stepwise · pygal · anyplot.ai",
    x_title="Value (cm)",
    y_title="Frequency (count)",
    show_dots=False,
    stroke_style={"width": 3},
    fill=False,
    show_legend=False,
    show_y_guides=True,
    show_x_guides=False,
    x_label_rotation=0,
)

# Add step line data
chart.add("Distribution", step_data)

# Save outputs
chart.render_to_file(f"plot-{THEME}.html")
chart.render_to_png(f"plot-{THEME}.png")
Runnable source as JSON, for any HTTP client: https://api.anyplot.ai/specs/histogram-stepwise/pygal/code. Any spec id and library id listed in llms-full.txt fit the same URL shape; every URL below is complete and callable.
{
  "spec_id": "histogram-stepwise",
  "language": "python",
  "library": "pygal",
  "page": "https://anyplot.ai/histogram-stepwise/python/pygal",
  "hub": "https://anyplot.ai/histogram-stepwise",
  "code_json": "https://api.anyplot.ai/specs/histogram-stepwise/pygal/code",
  "spec_json": "https://api.anyplot.ai/specs/histogram-stepwise",
  "render_light_png": "https://storage.googleapis.com/anyplot-images/plots/histogram-stepwise/python/pygal/plot-light.png",
  "render_dark_png": "https://storage.googleapis.com/anyplot-images/plots/histogram-stepwise/python/pygal/plot-dark.png",
  "interactive_light_html": "https://storage.googleapis.com/anyplot-images/plots/histogram-stepwise/python/pygal/plot-light.html",
  "interactive_dark_html": "https://storage.googleapis.com/anyplot-images/plots/histogram-stepwise/python/pygal/plot-dark.html",
  "quality_score": 85.0,
  "license": "MIT",
  "guide": "https://anyplot.ai/llms.txt"
}
Part of Step Histogram on anyplot.ai.