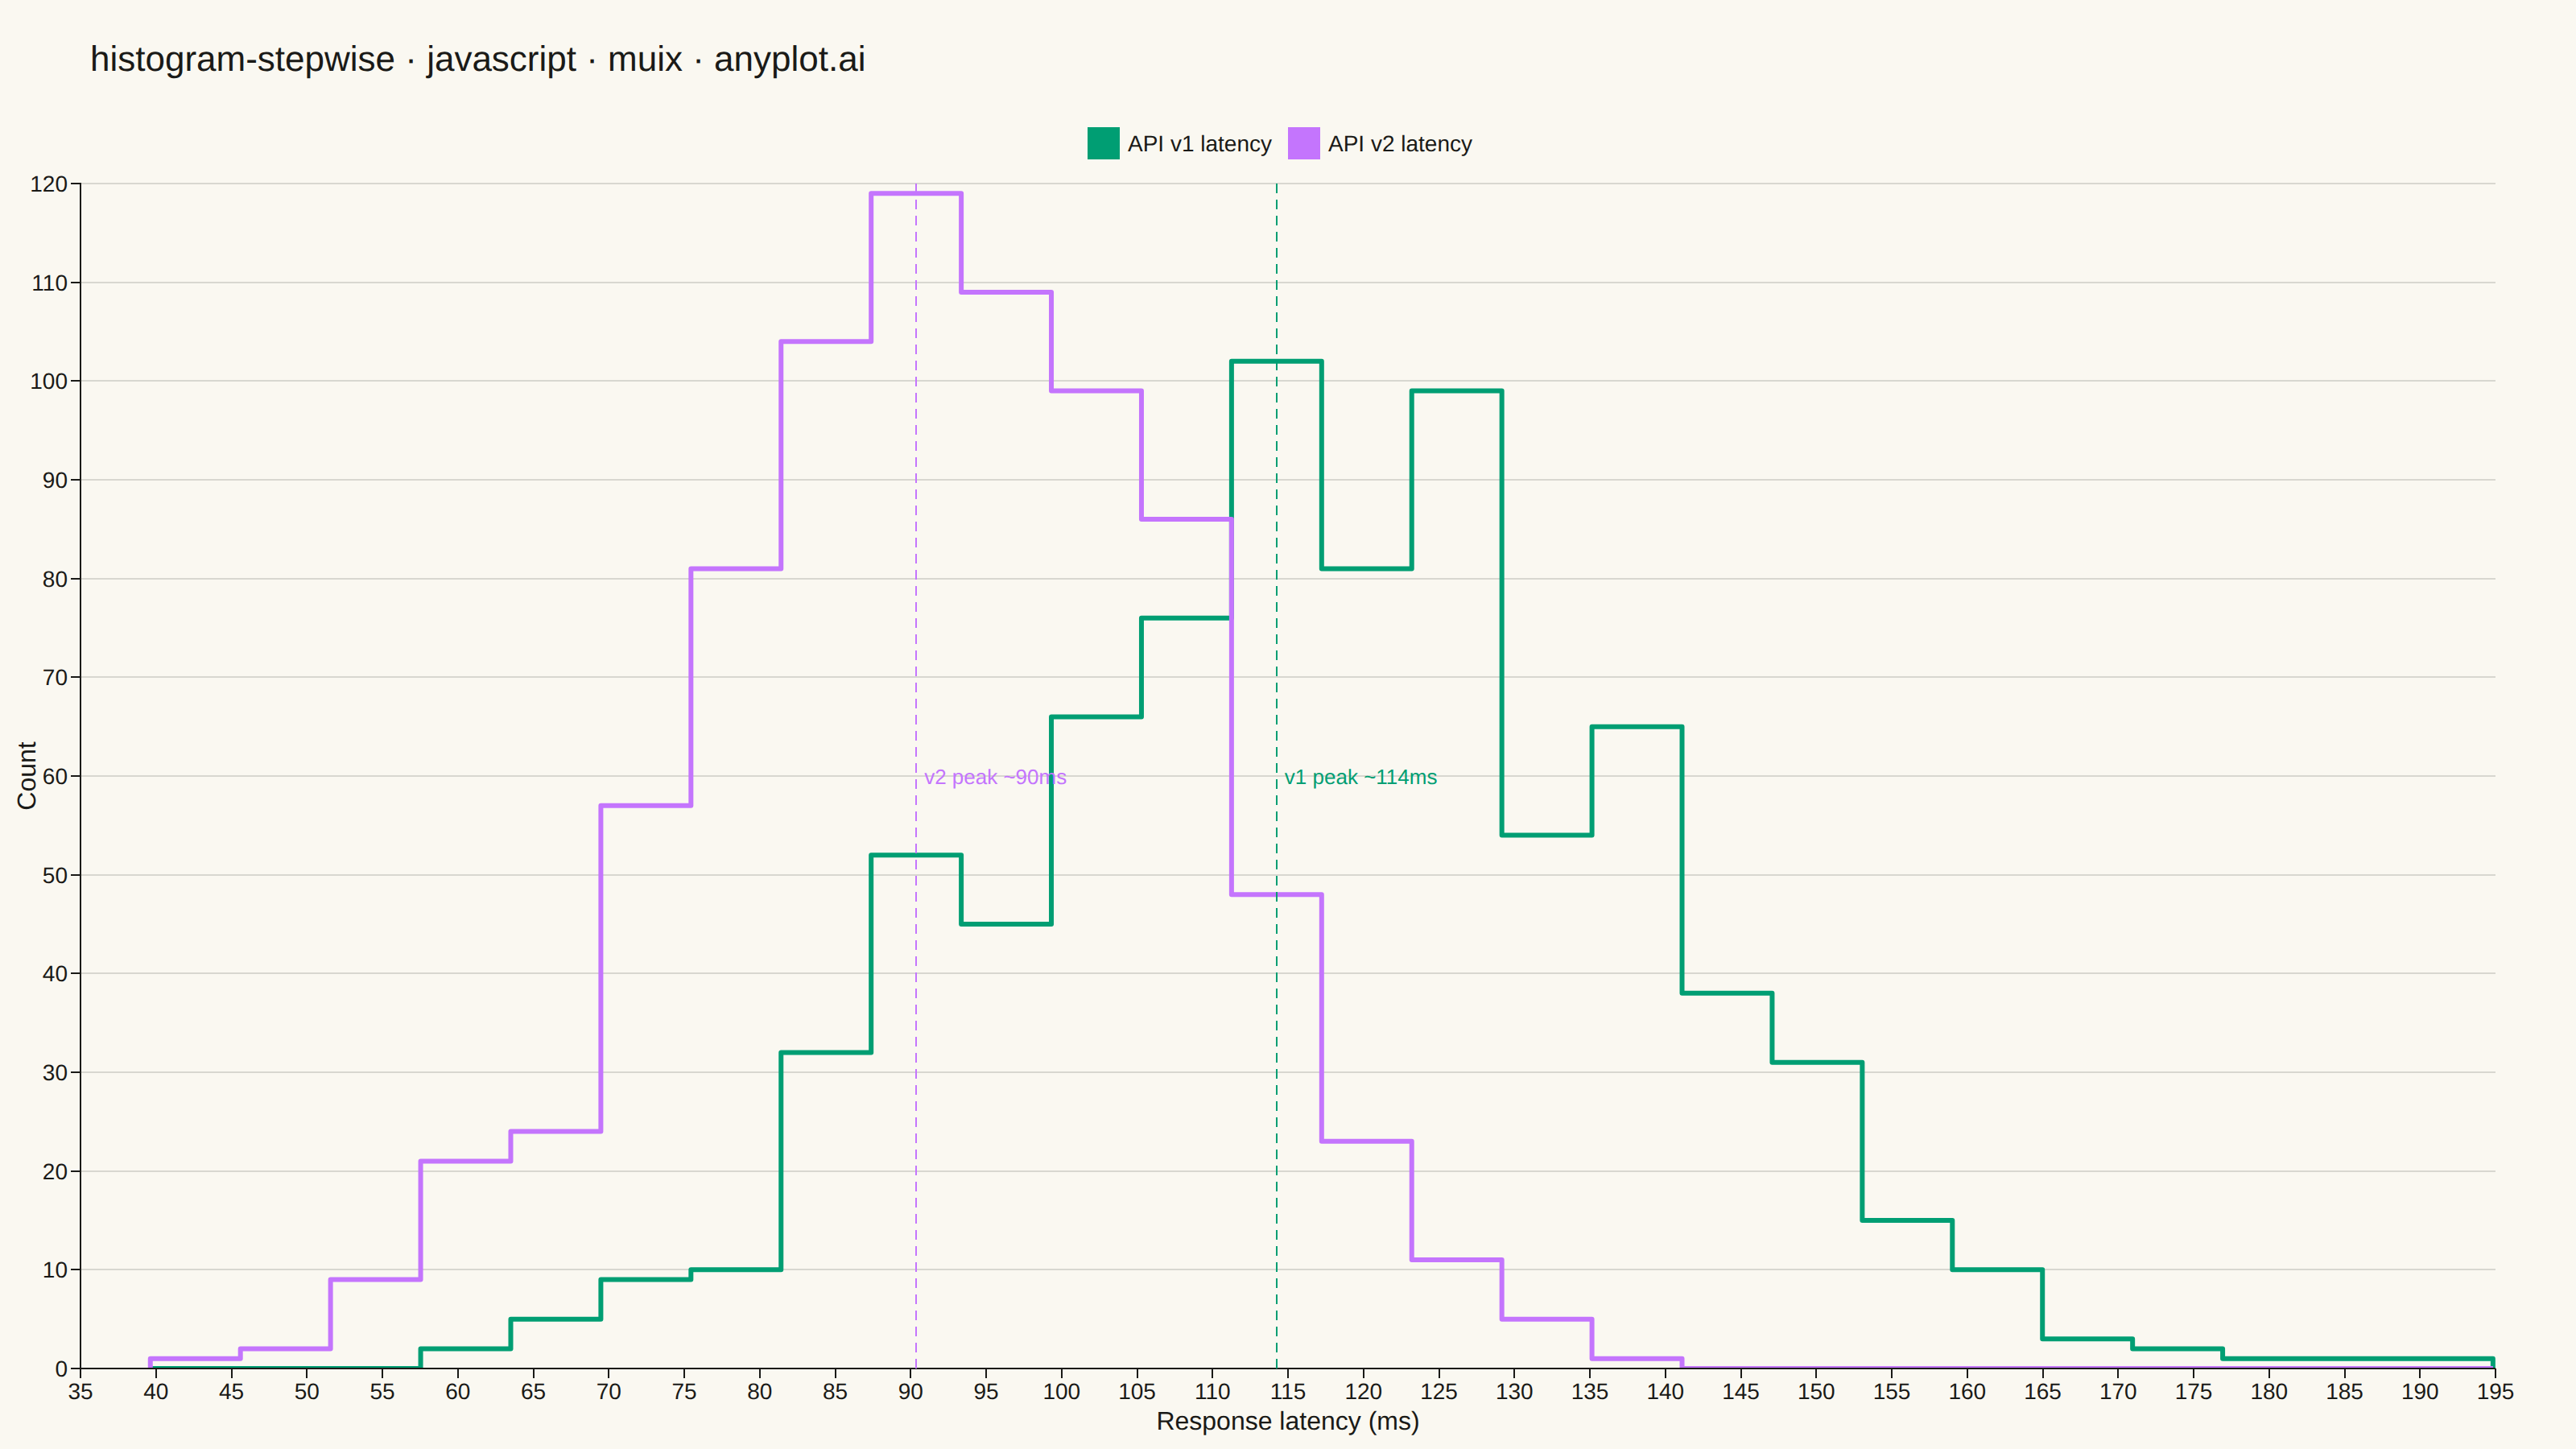
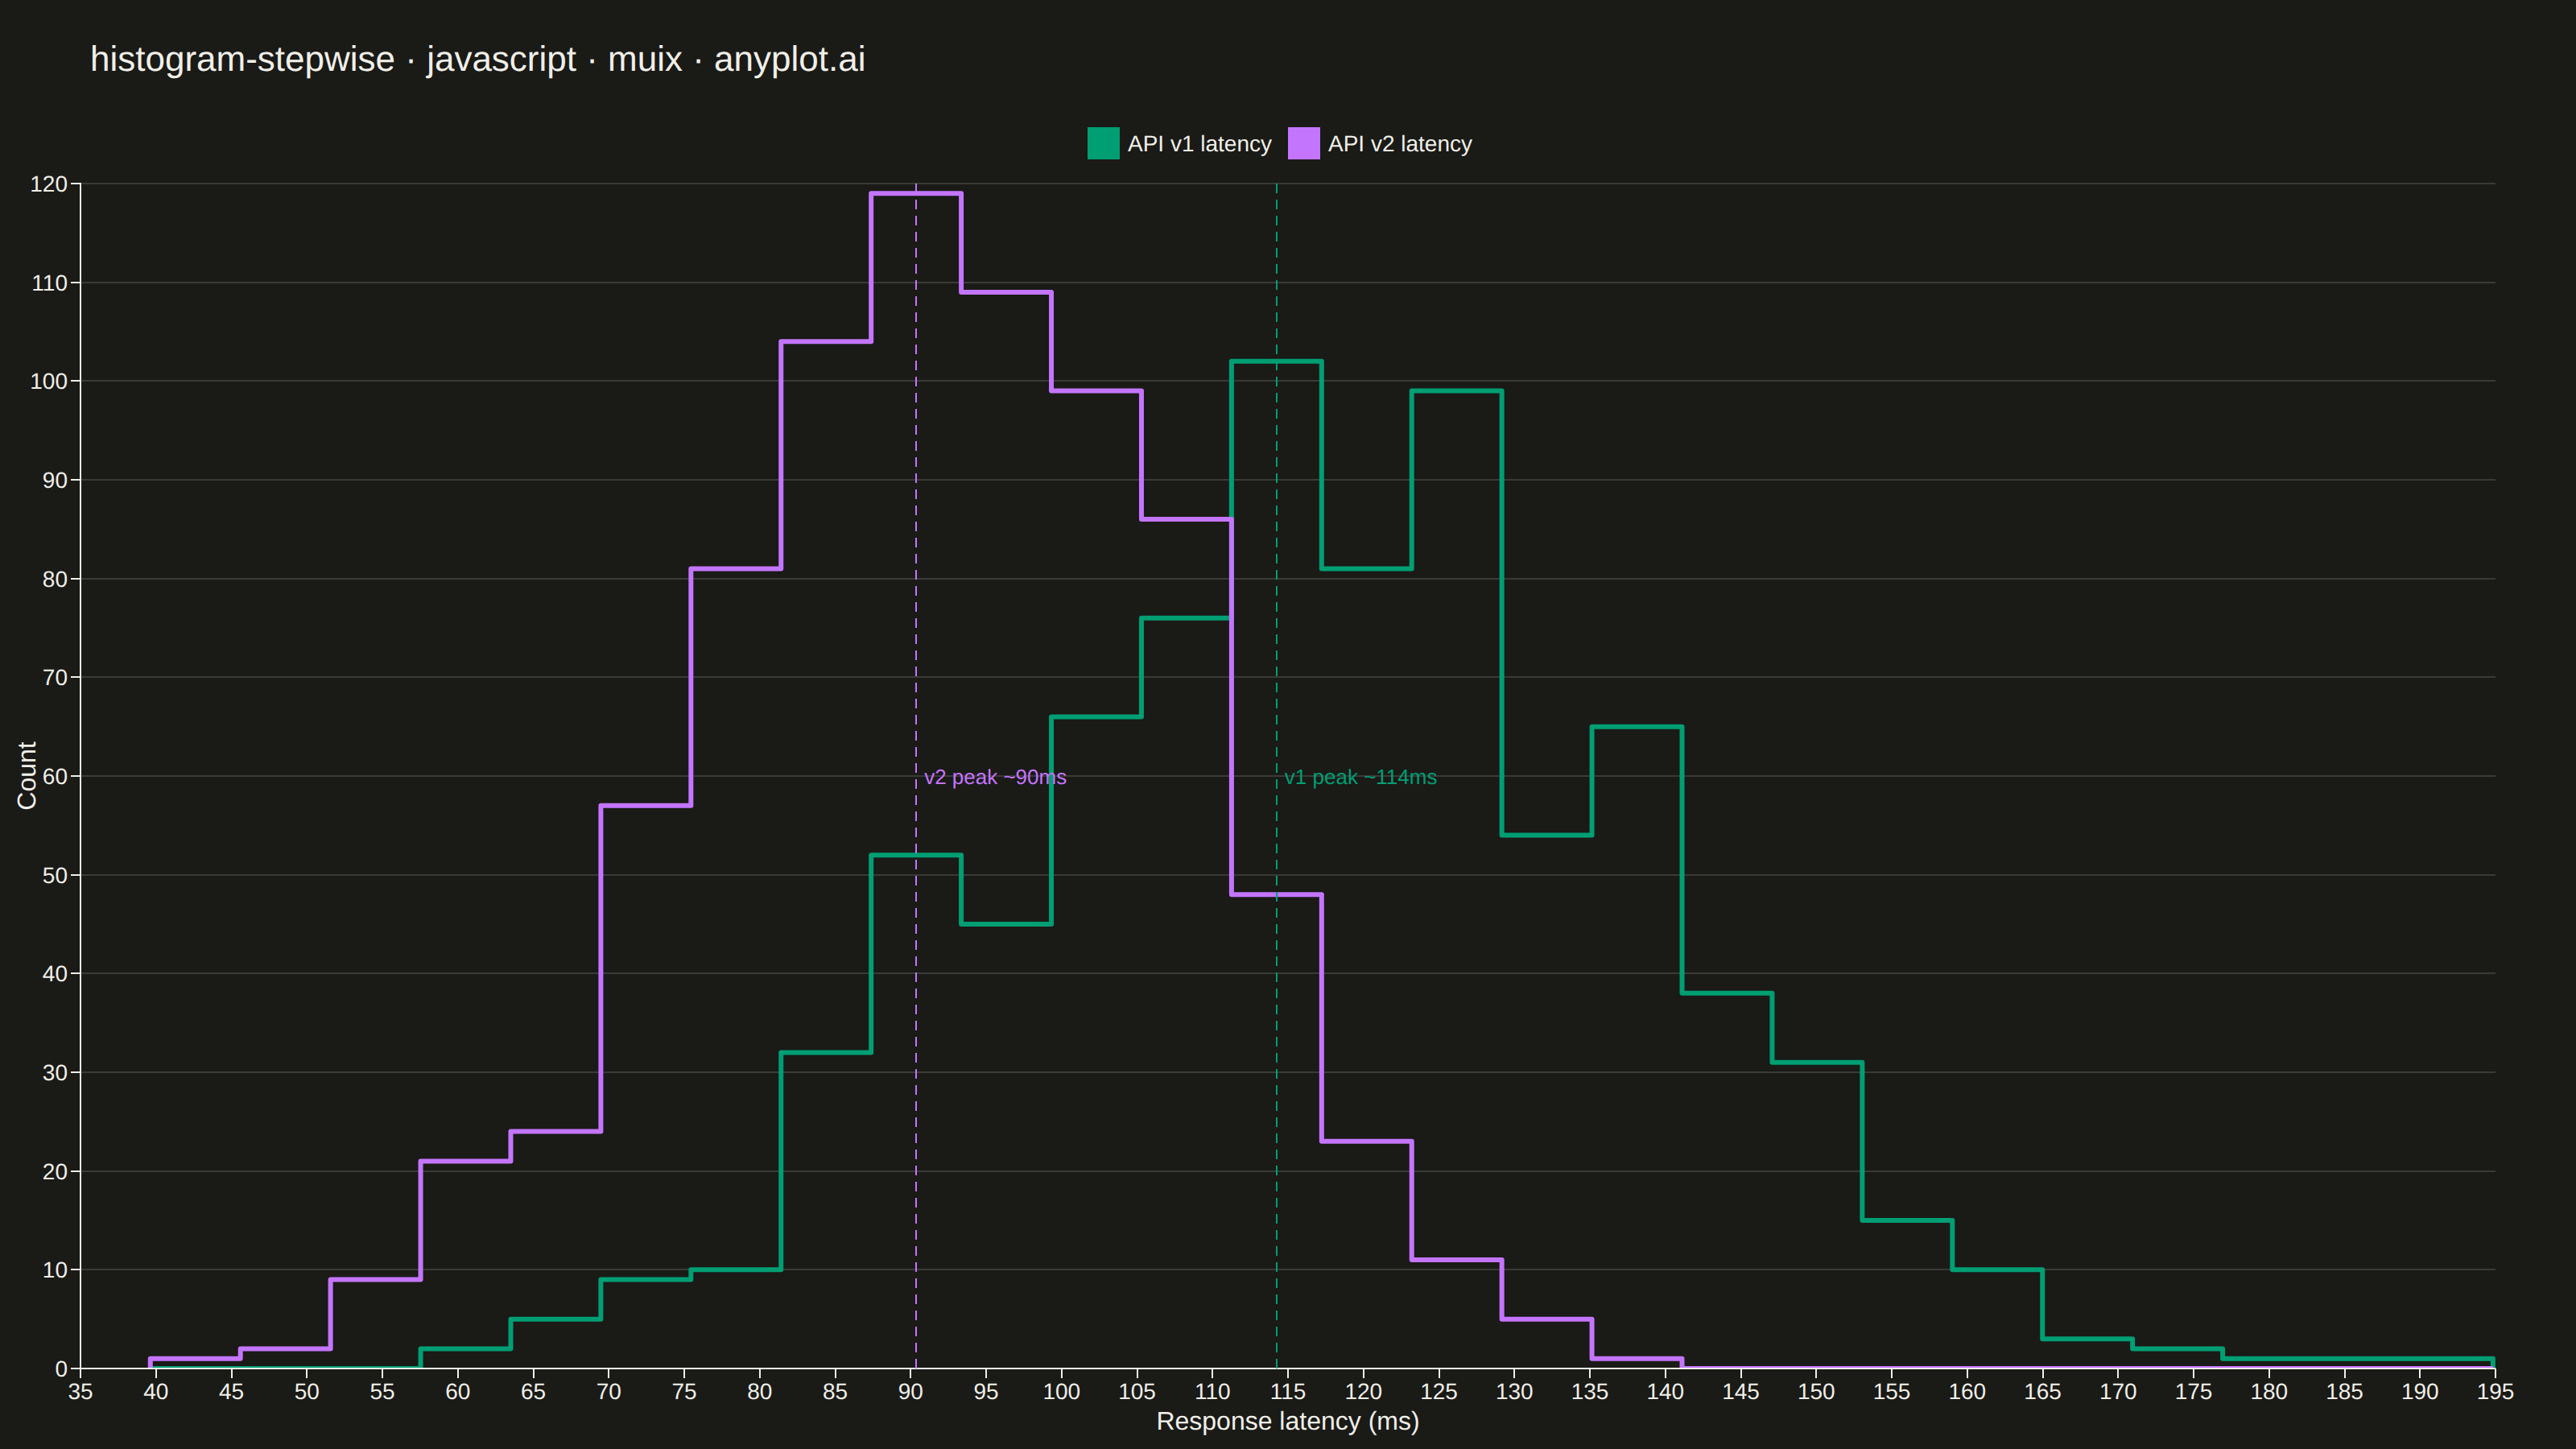
The same plot in 14 other libraries — JavaScript: Chart.js, D3.js, Apache ECharts, Highcharts; Python: Altair, Bokeh, lets-plot, Matplotlib, Plotly, plotnine, Pygal, Seaborn; R: ggplot2; Julia: Makie.jl. Compare all 15 side by side: Step Histogram in Python, R, Julia and JavaScript.
A histogram displayed as step lines (outline only) without filled bars. The distribution is shown as connected horizontal and vertical line segments, creating a step function appearance.
// anyplot.ai
// histogram-stepwise: Step Histogram
// Library: muix 7.29.1 | JavaScript 22.23.2
// Quality: 91/100 | Created: 2026-09-05
import { LineChart } from "@mui/x-charts/LineChart";
import { ChartsReferenceLine } from "@mui/x-charts/ChartsReferenceLine";
import Box from "@mui/material/Box";
import Typography from "@mui/material/Typography";

const t = window.ANYPLOT_TOKENS;

// --- Data (in-memory, deterministic) ---------------------------------------
// Tiny fixed-seed LCG — the browser has no seeded RNG.
function makeLcg(seed: number) {
  let state = seed >>> 0;
  return function next() {
    state = (Math.imul(state, 1664525) + 1013904223) >>> 0;
    return state / 4294967296;
  };
}

function randNormal(rng: () => number) {
  const u1 = Math.max(rng(), 1e-9);
  const u2 = rng();
  return Math.sqrt(-2 * Math.log(u1)) * Math.cos(2 * Math.PI * u2);
}

const rng = makeLcg(42);
const SAMPLE_SIZE = 800;

// API response latency (ms) before / after an optimization pass.
const latencyV1 = Array.from({ length: SAMPLE_SIZE }, () =>
  Math.max(8, 118 + randNormal(rng) * 22),
);
const latencyV2 = Array.from({ length: SAMPLE_SIZE }, () =>
  Math.max(8, 92 + randNormal(rng) * 16),
);

const BIN_COUNT = 26;
const allValues = latencyV1.concat(latencyV2);
const minValue = Math.min(...allValues);
const maxValue = Math.max(...allValues);
const binWidth = (maxValue - minValue) / BIN_COUNT;
const binEdges = Array.from({ length: BIN_COUNT + 1 }, (_, i) => minValue + i * binWidth);

function binCounts(values: number[]) {
  const counts = new Array(BIN_COUNT).fill(0);
  for (const value of values) {
    const index = Math.min(BIN_COUNT - 1, Math.floor((value - minValue) / binWidth));
    counts[index] += 1;
  }
  return counts;
}

// One x-point per bin edge (not per corner) — MUI X's native `curve="stepAfter"`
// draws the horizontal/vertical step segments itself. The leading edge is
// duplicated once (0 -> count[0]) so the outline rises from zero, and a
// trailing 0 closes it back to the axis at the final edge.
const stepX = [binEdges[0], binEdges[0], ...binEdges.slice(1)];
const countsV1 = binCounts(latencyV1);
const countsV2 = binCounts(latencyV2);
const stepV1 = [0, ...countsV1, 0];
const stepV2 = [0, ...countsV2, 0];

// Bin-center of each distribution's tallest bar — used to call out the
// before/after latency shift with reference lines.
function peakCenter(counts: number[]) {
  const peakIndex = counts.indexOf(Math.max(...counts));
  return (binEdges[peakIndex] + binEdges[peakIndex + 1]) / 2;
}

const peakV1 = peakCenter(countsV1);
const peakV2 = peakCenter(countsV2);

// --- Chart (default-exported component — the harness mounts it) -------------
export default function Chart() {
  const W = window.ANYPLOT_SIZE.width;
  const H = window.ANYPLOT_SIZE.height;
  const CHART_TOP = 64;

  const title = "histogram-stepwise · javascript · muix · anyplot.ai";
  const titleSize = title.length > 67 ? Math.round((22 * 67) / title.length) : 22;

  return (
    <Box sx={{ position: "relative", width: W, height: H, bgcolor: t.pageBg }}>
      <Box sx={{ position: "absolute", top: 20, left: 56, right: 56 }}>
        <Typography sx={{ color: t.ink, fontSize: titleSize, fontWeight: 500 }}>{title}</Typography>
      </Box>
      <Box sx={{ position: "absolute", top: CHART_TOP, left: 0, right: 0, bottom: 0 }}>
        <LineChart
          width={W}
          height={H - CHART_TOP}
          skipAnimation
          series={[
            {
              data: stepV1,
              label: "API v1 latency",
              color: t.palette[0],
              curve: "stepAfter",
              area: false,
              showMark: false,
            },
            {
              data: stepV2,
              label: "API v2 latency",
              color: t.palette[1],
              curve: "stepAfter",
              area: false,
              showMark: false,
            },
          ]}
          xAxis={[
            {
              data: stepX,
              scaleType: "linear",
              label: "Response latency (ms)",
              labelStyle: { fontSize: 16 },
              tickLabelStyle: { fontSize: 14 },
              valueFormatter: (value: number) => value.toFixed(0),
            },
          ]}
          yAxis={[
            {
              label: "Count",
              labelStyle: { fontSize: 16 },
              tickLabelStyle: { fontSize: 14 },
            },
          ]}
          grid={{ horizontal: true }}
          slotProps={{ legend: { labelStyle: { fontSize: 14 } } }}
          sx={{ "& .MuiLineElement-root": { strokeWidth: 3 } }}
        >
          <ChartsReferenceLine
            x={peakV1}
            label={`v1 peak ~${peakV1.toFixed(0)}ms`}
            labelStyle={{ fontSize: 13, fill: t.palette[0] }}
            lineStyle={{ stroke: t.palette[0], strokeDasharray: "6 4" }}
          />
          <ChartsReferenceLine
            x={peakV2}
            label={`v2 peak ~${peakV2.toFixed(0)}ms`}
            labelStyle={{ fontSize: 13, fill: t.palette[1] }}
            lineStyle={{ stroke: t.palette[1], strokeDasharray: "6 4" }}
          />
        </LineChart>
      </Box>
    </Box>
  );
}
Runnable source as JSON, for any HTTP client: https://api.anyplot.ai/specs/histogram-stepwise/muix/code. Any spec id and library id listed in llms-full.txt fit the same URL shape; every URL below is complete and callable.
{
  "spec_id": "histogram-stepwise",
  "language": "javascript",
  "library": "muix",
  "page": "https://anyplot.ai/histogram-stepwise/javascript/muix",
  "hub": "https://anyplot.ai/histogram-stepwise",
  "code_json": "https://api.anyplot.ai/specs/histogram-stepwise/muix/code",
  "spec_json": "https://api.anyplot.ai/specs/histogram-stepwise",
  "render_light_png": "https://storage.googleapis.com/anyplot-images/plots/histogram-stepwise/javascript/muix/plot-light.png",
  "render_dark_png": "https://storage.googleapis.com/anyplot-images/plots/histogram-stepwise/javascript/muix/plot-dark.png",
  "interactive_light_html": "https://storage.googleapis.com/anyplot-images/plots/histogram-stepwise/javascript/muix/plot-light.html",
  "interactive_dark_html": "https://storage.googleapis.com/anyplot-images/plots/histogram-stepwise/javascript/muix/plot-dark.html",
  "quality_score": 91.0,
  "license": "MIT",
  "guide": "https://anyplot.ai/llms.txt"
}
Part of Step Histogram on anyplot.ai.