The same plot in 14 other libraries — JavaScript: Chart.js, D3.js, Apache ECharts, MUI X Charts; Python: Altair, Bokeh, lets-plot, Matplotlib, Plotly, plotnine, Pygal, Seaborn; R: ggplot2; Julia: Makie.jl. Compare all 15 side by side: Step Histogram in Python, R, Julia and JavaScript.
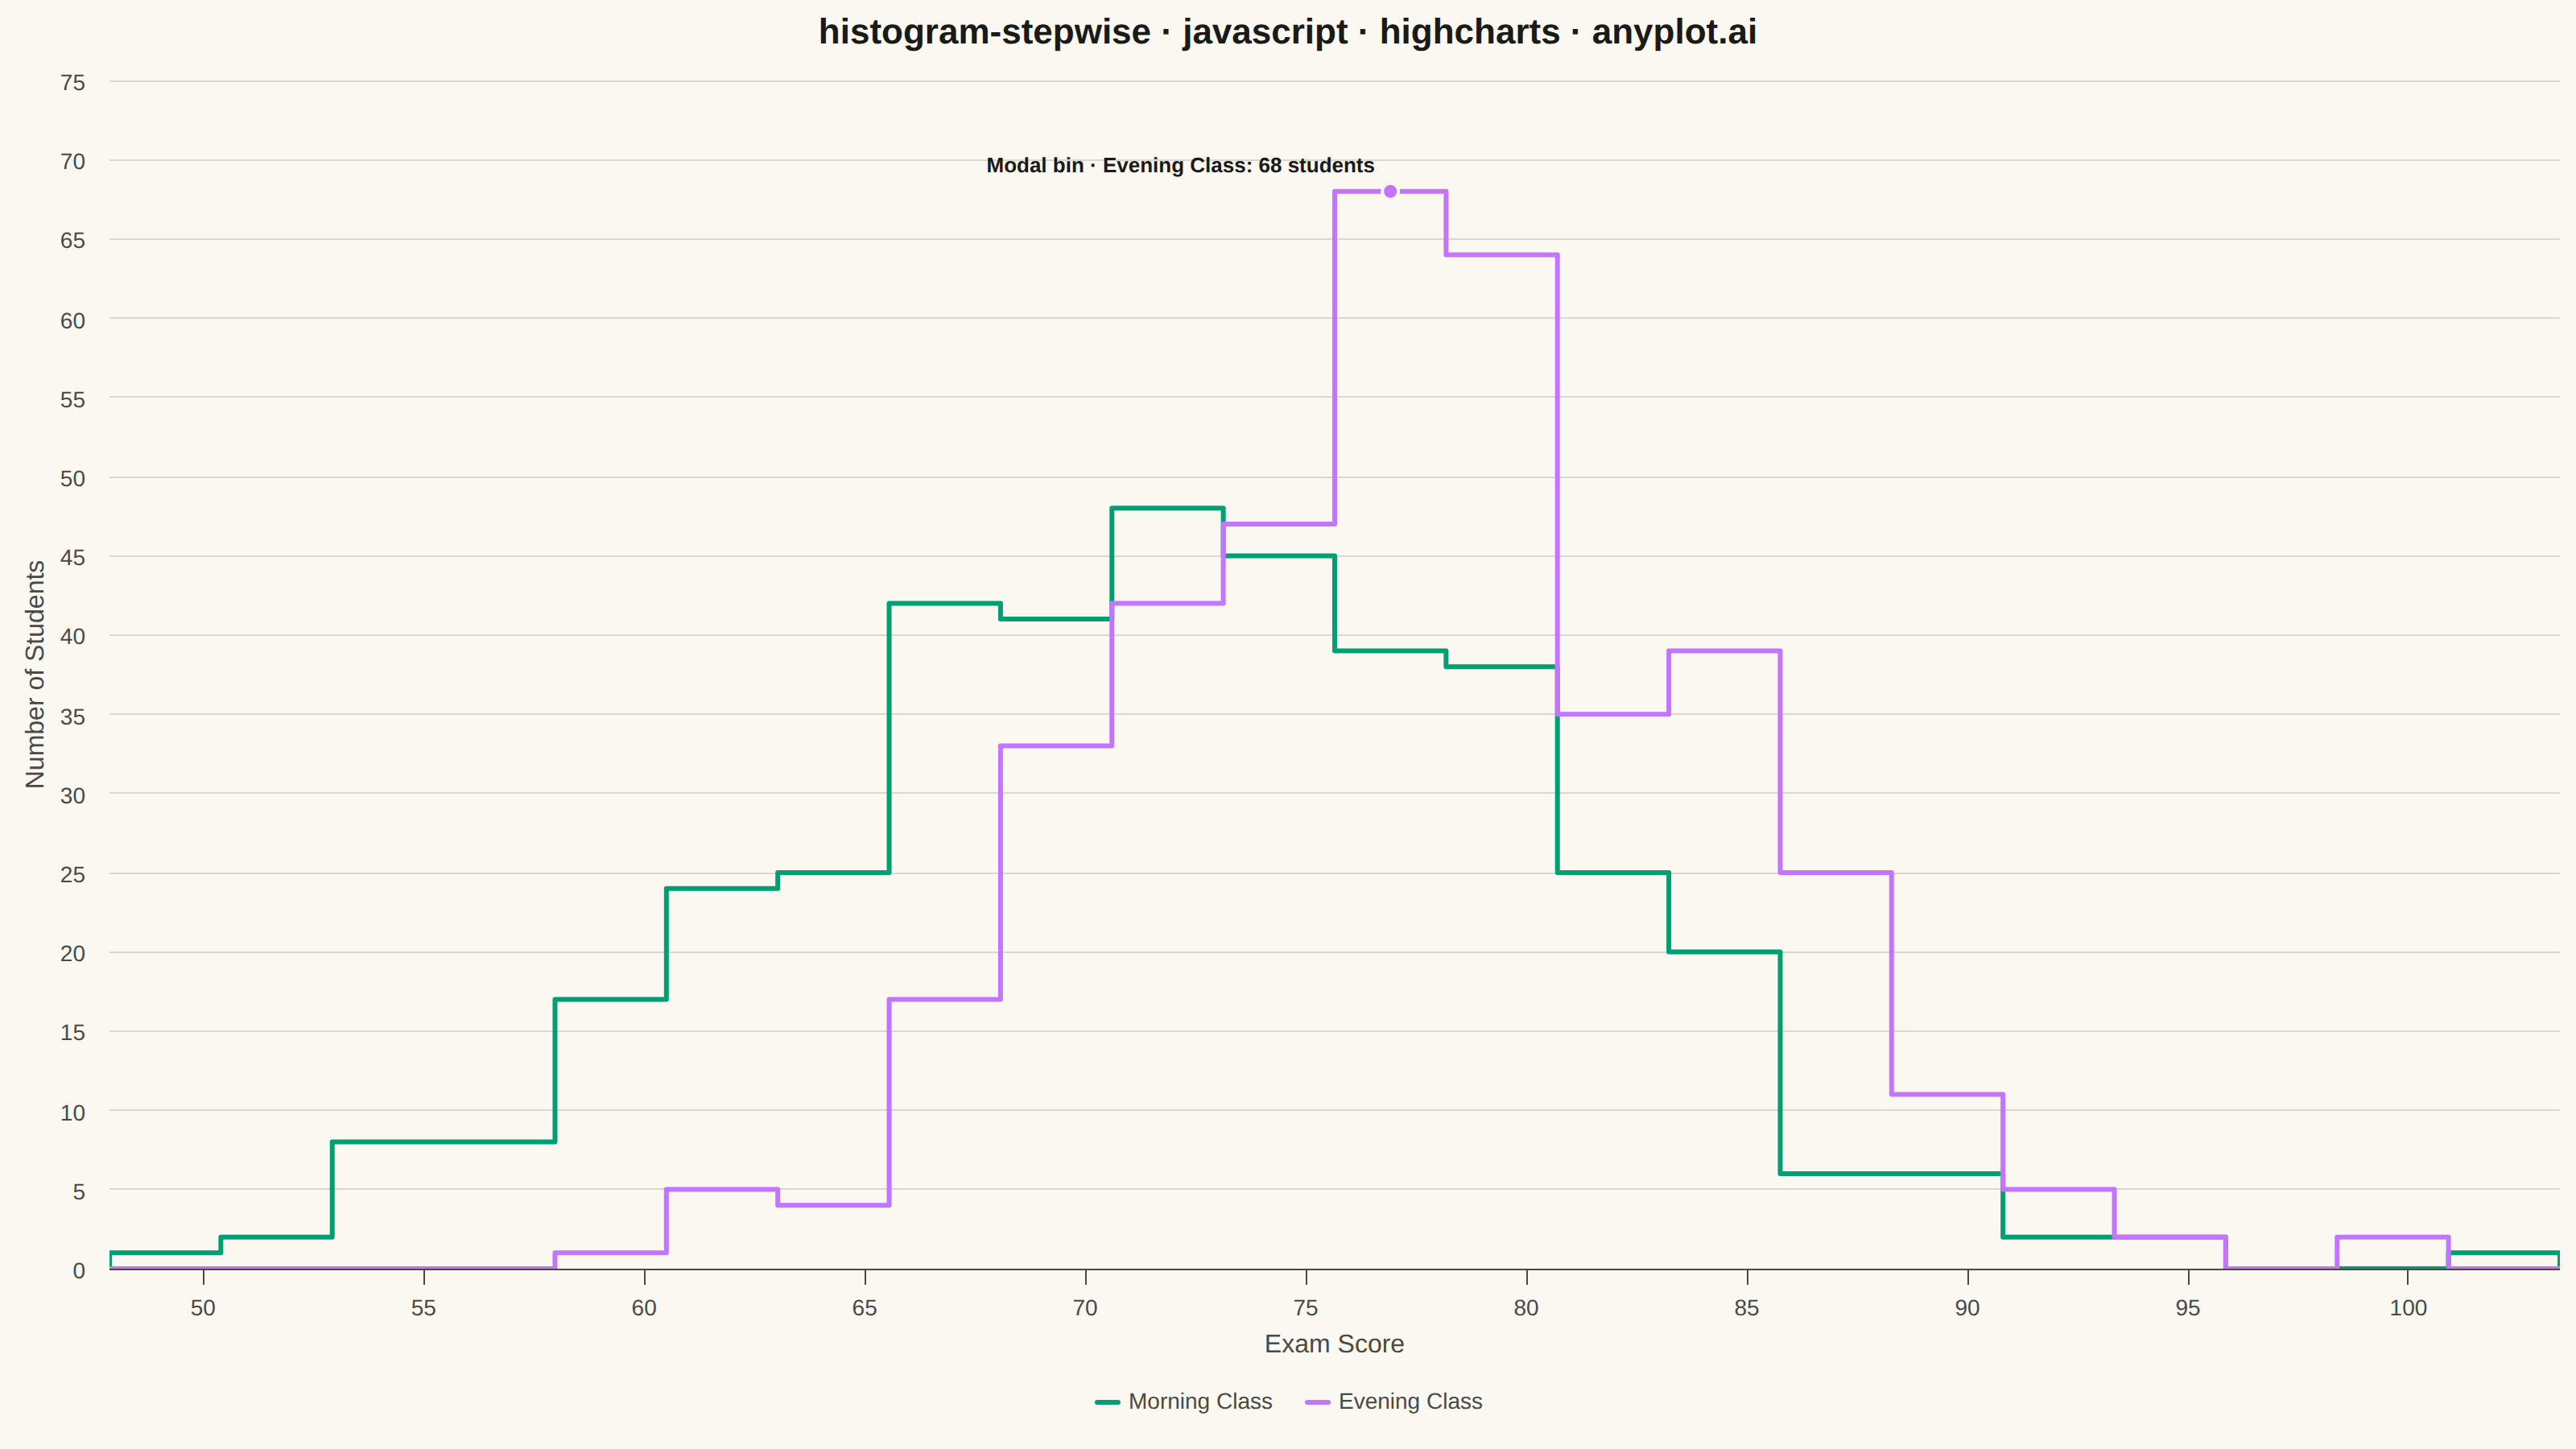
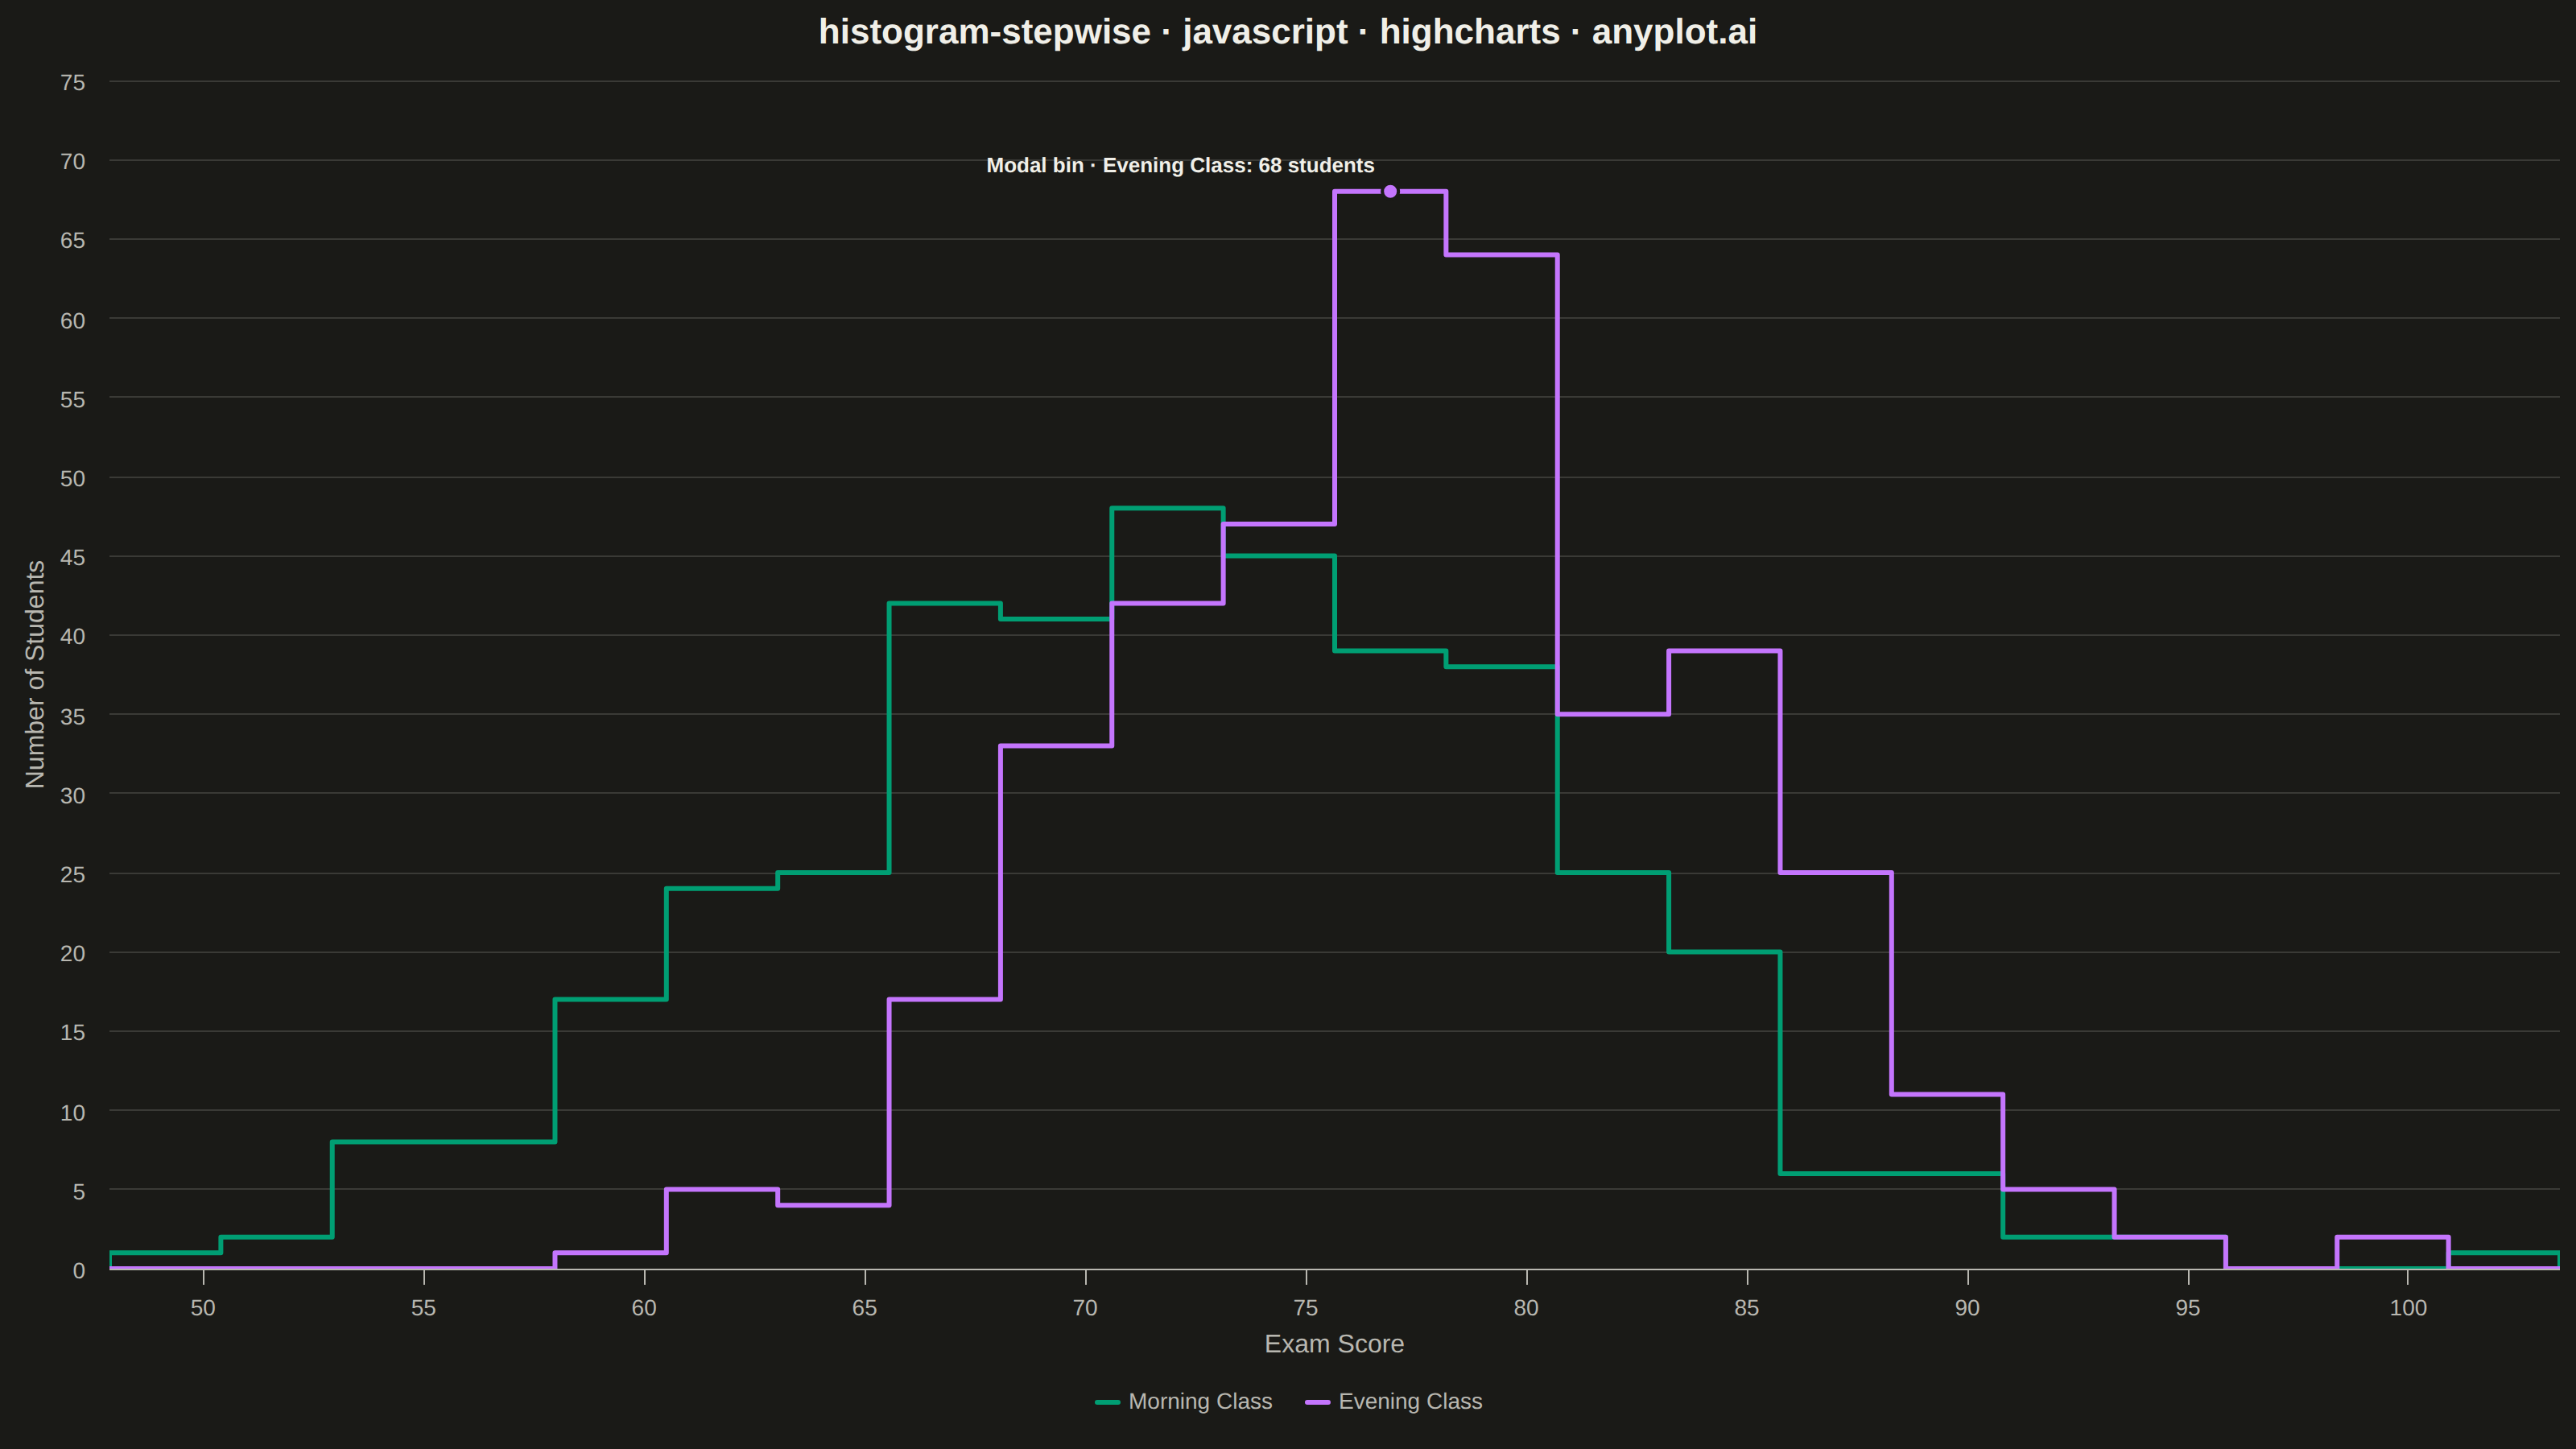
A histogram displayed as step lines (outline only) without filled bars. The distribution is shown as connected horizontal and vertical line segments, creating a step function appearance.
// anyplot.ai
// histogram-stepwise: Step Histogram
// Library: highcharts 12.6.0 | JavaScript 22.23.2
// Quality: 89/100 | Created: 2026-09-05

const t = window.ANYPLOT_TOKENS;

// --- Data (in-memory, deterministic) ----------------------------------------
// Tiny LCG so the browser (no seeded Math.random) still reproduces the sample.
function lcg(seed) {
  let state = seed >>> 0;
  return function () {
    state = (1664525 * state + 1013904223) >>> 0;
    return state / 4294967296;
  };
}
const rand = lcg(42);
function randNormal(mean, std) {
  const u1 = Math.max(rand(), 1e-9);
  const u2 = rand();
  const z = Math.sqrt(-2 * Math.log(u1)) * Math.cos(2 * Math.PI * u2);
  return mean + z * std;
}

const sampleSize = 400;
const morningScores = Array.from({ length: sampleSize }, () => randNormal(72, 9));
const eveningScores = Array.from({ length: sampleSize }, () => randNormal(78, 7));

// Shared bin edges so both step outlines overlay on the same axis.
const allScores = morningScores.concat(eveningScores);
const dataMin = Math.min(...allScores);
const dataMax = Math.max(...allScores);
const binCount = 22;
const binWidth = (dataMax - dataMin) / binCount;
const edges = Array.from({ length: binCount + 1 }, (_, i) => dataMin + i * binWidth);

function histogram(values) {
  const counts = new Array(binCount).fill(0);
  values.forEach((v) => {
    let idx = Math.floor((v - dataMin) / binWidth);
    if (idx < 0) idx = 0;
    if (idx >= binCount) idx = binCount - 1;
    counts[idx] += 1;
  });
  return counts;
}

// One (left-edge, count) point per bin plus a leading/trailing zero — with
// `plotOptions.series.step: "left"` Highcharts interpolates the horizontal
// bin segments and vertical connectors itself, dropping to zero at both ends.
function stepPoints(counts) {
  const points = [[edges[0], 0]];
  counts.forEach((count, i) => points.push([edges[i], count]));
  points.push([edges[edges.length - 1], 0]);
  return points;
}

function argmax(arr) {
  return arr.reduce((best, v, i) => (v > arr[best] ? i : best), 0);
}

const morningCounts = histogram(morningScores);
const eveningCounts = histogram(eveningScores);

// Callout on the modal (tallest) bin across both classes — a small design
// touch that adds a focal point beyond the plain overlay comparison.
const morningPeakIdx = argmax(morningCounts);
const eveningPeakIdx = argmax(eveningCounts);
const morningIsPeak = morningCounts[morningPeakIdx] >= eveningCounts[eveningPeakIdx];
const peakIdx = morningIsPeak ? morningPeakIdx : eveningPeakIdx;
const peakCount = morningIsPeak ? morningCounts[morningPeakIdx] : eveningCounts[eveningPeakIdx];
const peakSeriesName = morningIsPeak ? "Morning Class" : "Evening Class";
const peakColor = morningIsPeak ? t.palette[0] : t.palette[1];
const peakX = (edges[peakIdx] + edges[peakIdx + 1]) / 2;

// --- Chart -------------------------------------------------------------------
Highcharts.chart("container", {
  chart: {
    type: "line",
    backgroundColor: "transparent",
    animation: false,
    style: { fontFamily: "inherit" },
    events: {
      load() {
        const chart = this;
        const px = chart.xAxis[0].toPixels(peakX);
        const py = Math.max(chart.yAxis[0].toPixels(peakCount), chart.plotTop + 14);
        const labelOnRight = px < chart.plotLeft + chart.plotWidth / 2;
        chart.renderer
          .circle(px, py, 5)
          .attr({ fill: peakColor, stroke: t.pageBg, "stroke-width": 2, zIndex: 6 })
          .add();
        chart.renderer
          .text(`Modal bin · ${peakSeriesName}: ${peakCount} students`, px + (labelOnRight ? 10 : -10), py - 12)
          .css({ color: t.ink, fontSize: "13px", fontWeight: "600" })
          .attr({ align: labelOnRight ? "left" : "right" })
          .add();
      },
    },
  },
  credits: { enabled: false },
  colors: t.palette,
  title: {
    text: "histogram-stepwise · javascript · highcharts · anyplot.ai",
    style: { color: t.ink, fontSize: "22px", fontWeight: "600" },
  },
  xAxis: {
    title: { text: "Exam Score", style: { color: t.inkSoft, fontSize: "16px" } },
    min: edges[0],
    max: edges[edges.length - 1],
    lineColor: t.inkSoft,
    tickColor: t.inkSoft,
    gridLineWidth: 0,
    labels: { style: { color: t.inkSoft, fontSize: "14px" } },
  },
  yAxis: {
    title: { text: "Number of Students", style: { color: t.inkSoft, fontSize: "16px" } },
    min: 0,
    gridLineColor: t.grid,
    labels: { style: { color: t.inkSoft, fontSize: "14px" } },
  },
  legend: {
    itemStyle: { color: t.inkSoft, fontSize: "14px" },
    itemHoverStyle: { color: t.ink },
  },
  tooltip: {
    headerFormat: "",
    pointFormat: "Score {point.x:.1f}<br/>Count: <b>{point.y}</b>",
  },
  plotOptions: {
    series: {
      animation: false,
      marker: { enabled: false },
      lineWidth: 3,
      step: "left",
      states: { hover: { lineWidthPlus: 0 } },
    },
  },
  series: [
    { name: "Morning Class", data: stepPoints(morningCounts) },
    { name: "Evening Class", data: stepPoints(eveningCounts) },
  ],
});
Runnable source as JSON, for any HTTP client: https://api.anyplot.ai/specs/histogram-stepwise/highcharts/code. Any spec id and library id listed in llms-full.txt fit the same URL shape; every URL below is complete and callable.
{
  "spec_id": "histogram-stepwise",
  "language": "javascript",
  "library": "highcharts",
  "page": "https://anyplot.ai/histogram-stepwise/javascript/highcharts",
  "hub": "https://anyplot.ai/histogram-stepwise",
  "code_json": "https://api.anyplot.ai/specs/histogram-stepwise/highcharts/code",
  "spec_json": "https://api.anyplot.ai/specs/histogram-stepwise",
  "render_light_png": "https://storage.googleapis.com/anyplot-images/plots/histogram-stepwise/javascript/highcharts/plot-light.png",
  "render_dark_png": "https://storage.googleapis.com/anyplot-images/plots/histogram-stepwise/javascript/highcharts/plot-dark.png",
  "interactive_light_html": "https://storage.googleapis.com/anyplot-images/plots/histogram-stepwise/javascript/highcharts/plot-light.html",
  "interactive_dark_html": "https://storage.googleapis.com/anyplot-images/plots/histogram-stepwise/javascript/highcharts/plot-dark.html",
  "quality_score": 89.0,
  "license": "MIT",
  "guide": "https://anyplot.ai/llms.txt"
}
Part of Step Histogram on anyplot.ai.