The same plot in 14 other libraries — Python: Altair, Bokeh, lets-plot, Matplotlib, Plotly, plotnine, Pygal, Seaborn; Julia: Makie.jl; JavaScript: Chart.js, D3.js, Apache ECharts, Highcharts, MUI X Charts. Compare all 15 side by side: Simple Moving Average (SMA) Indicator Chart in Python, R, Julia and JavaScript.
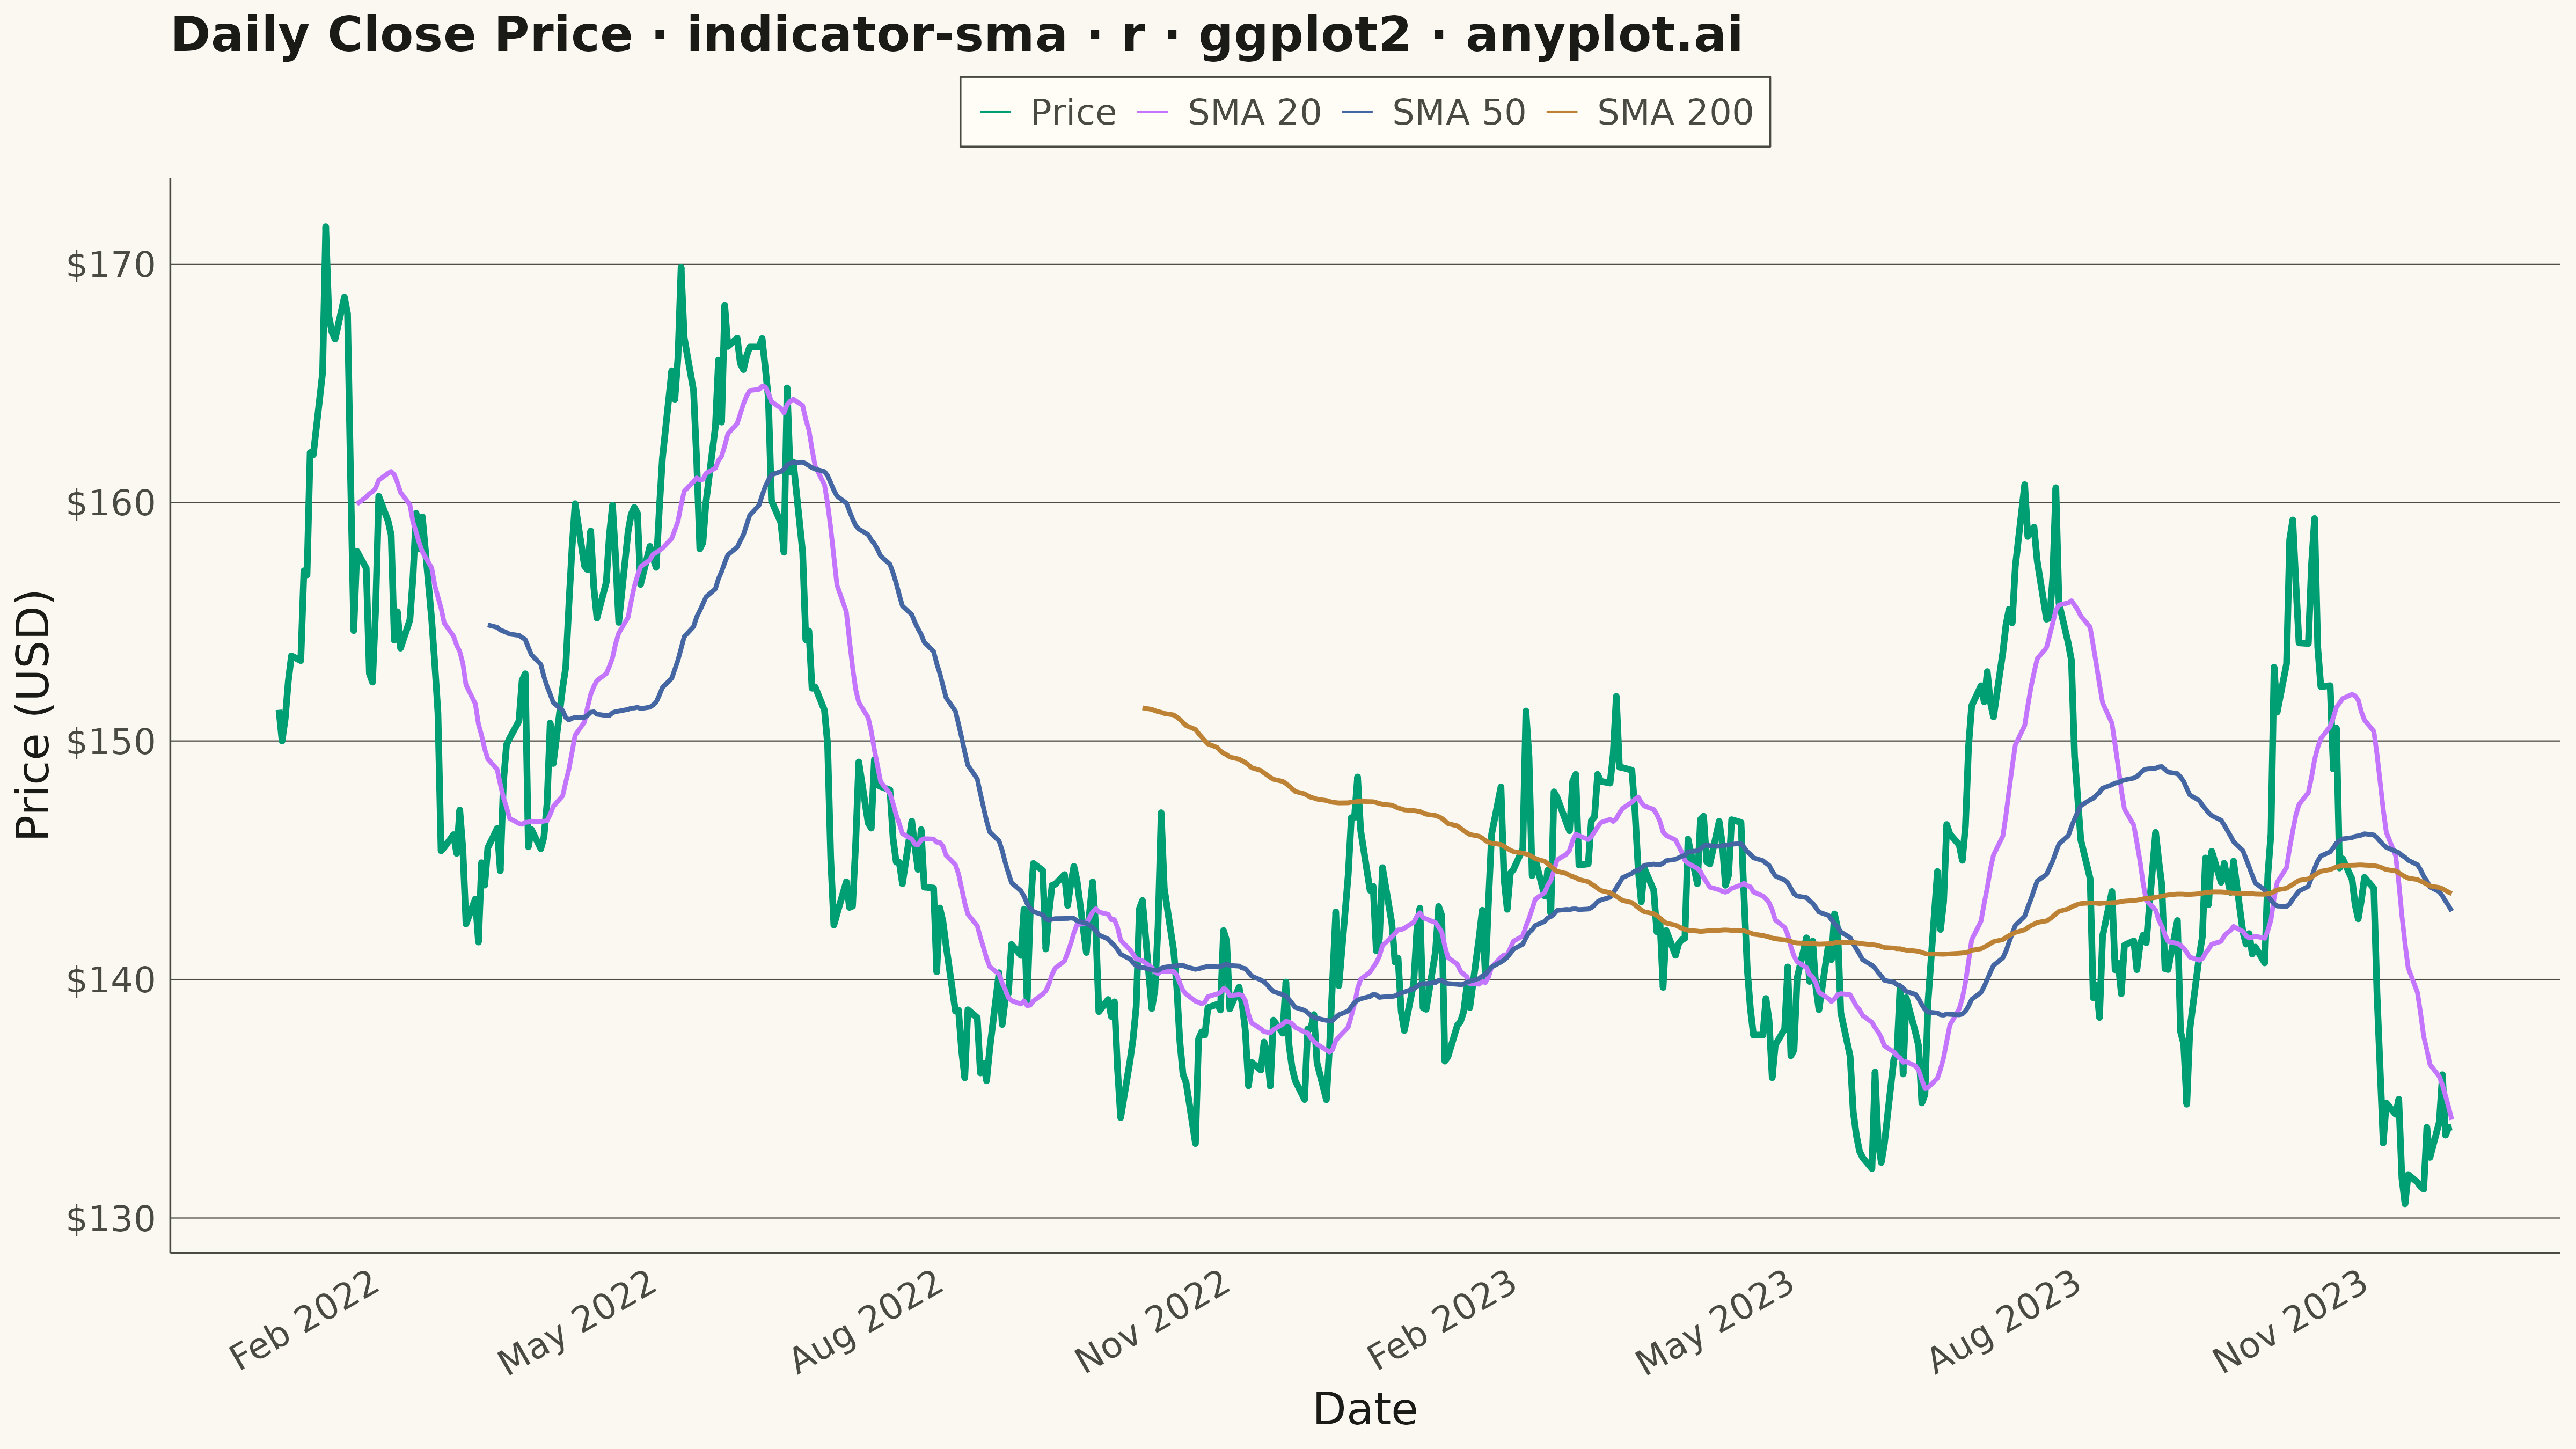
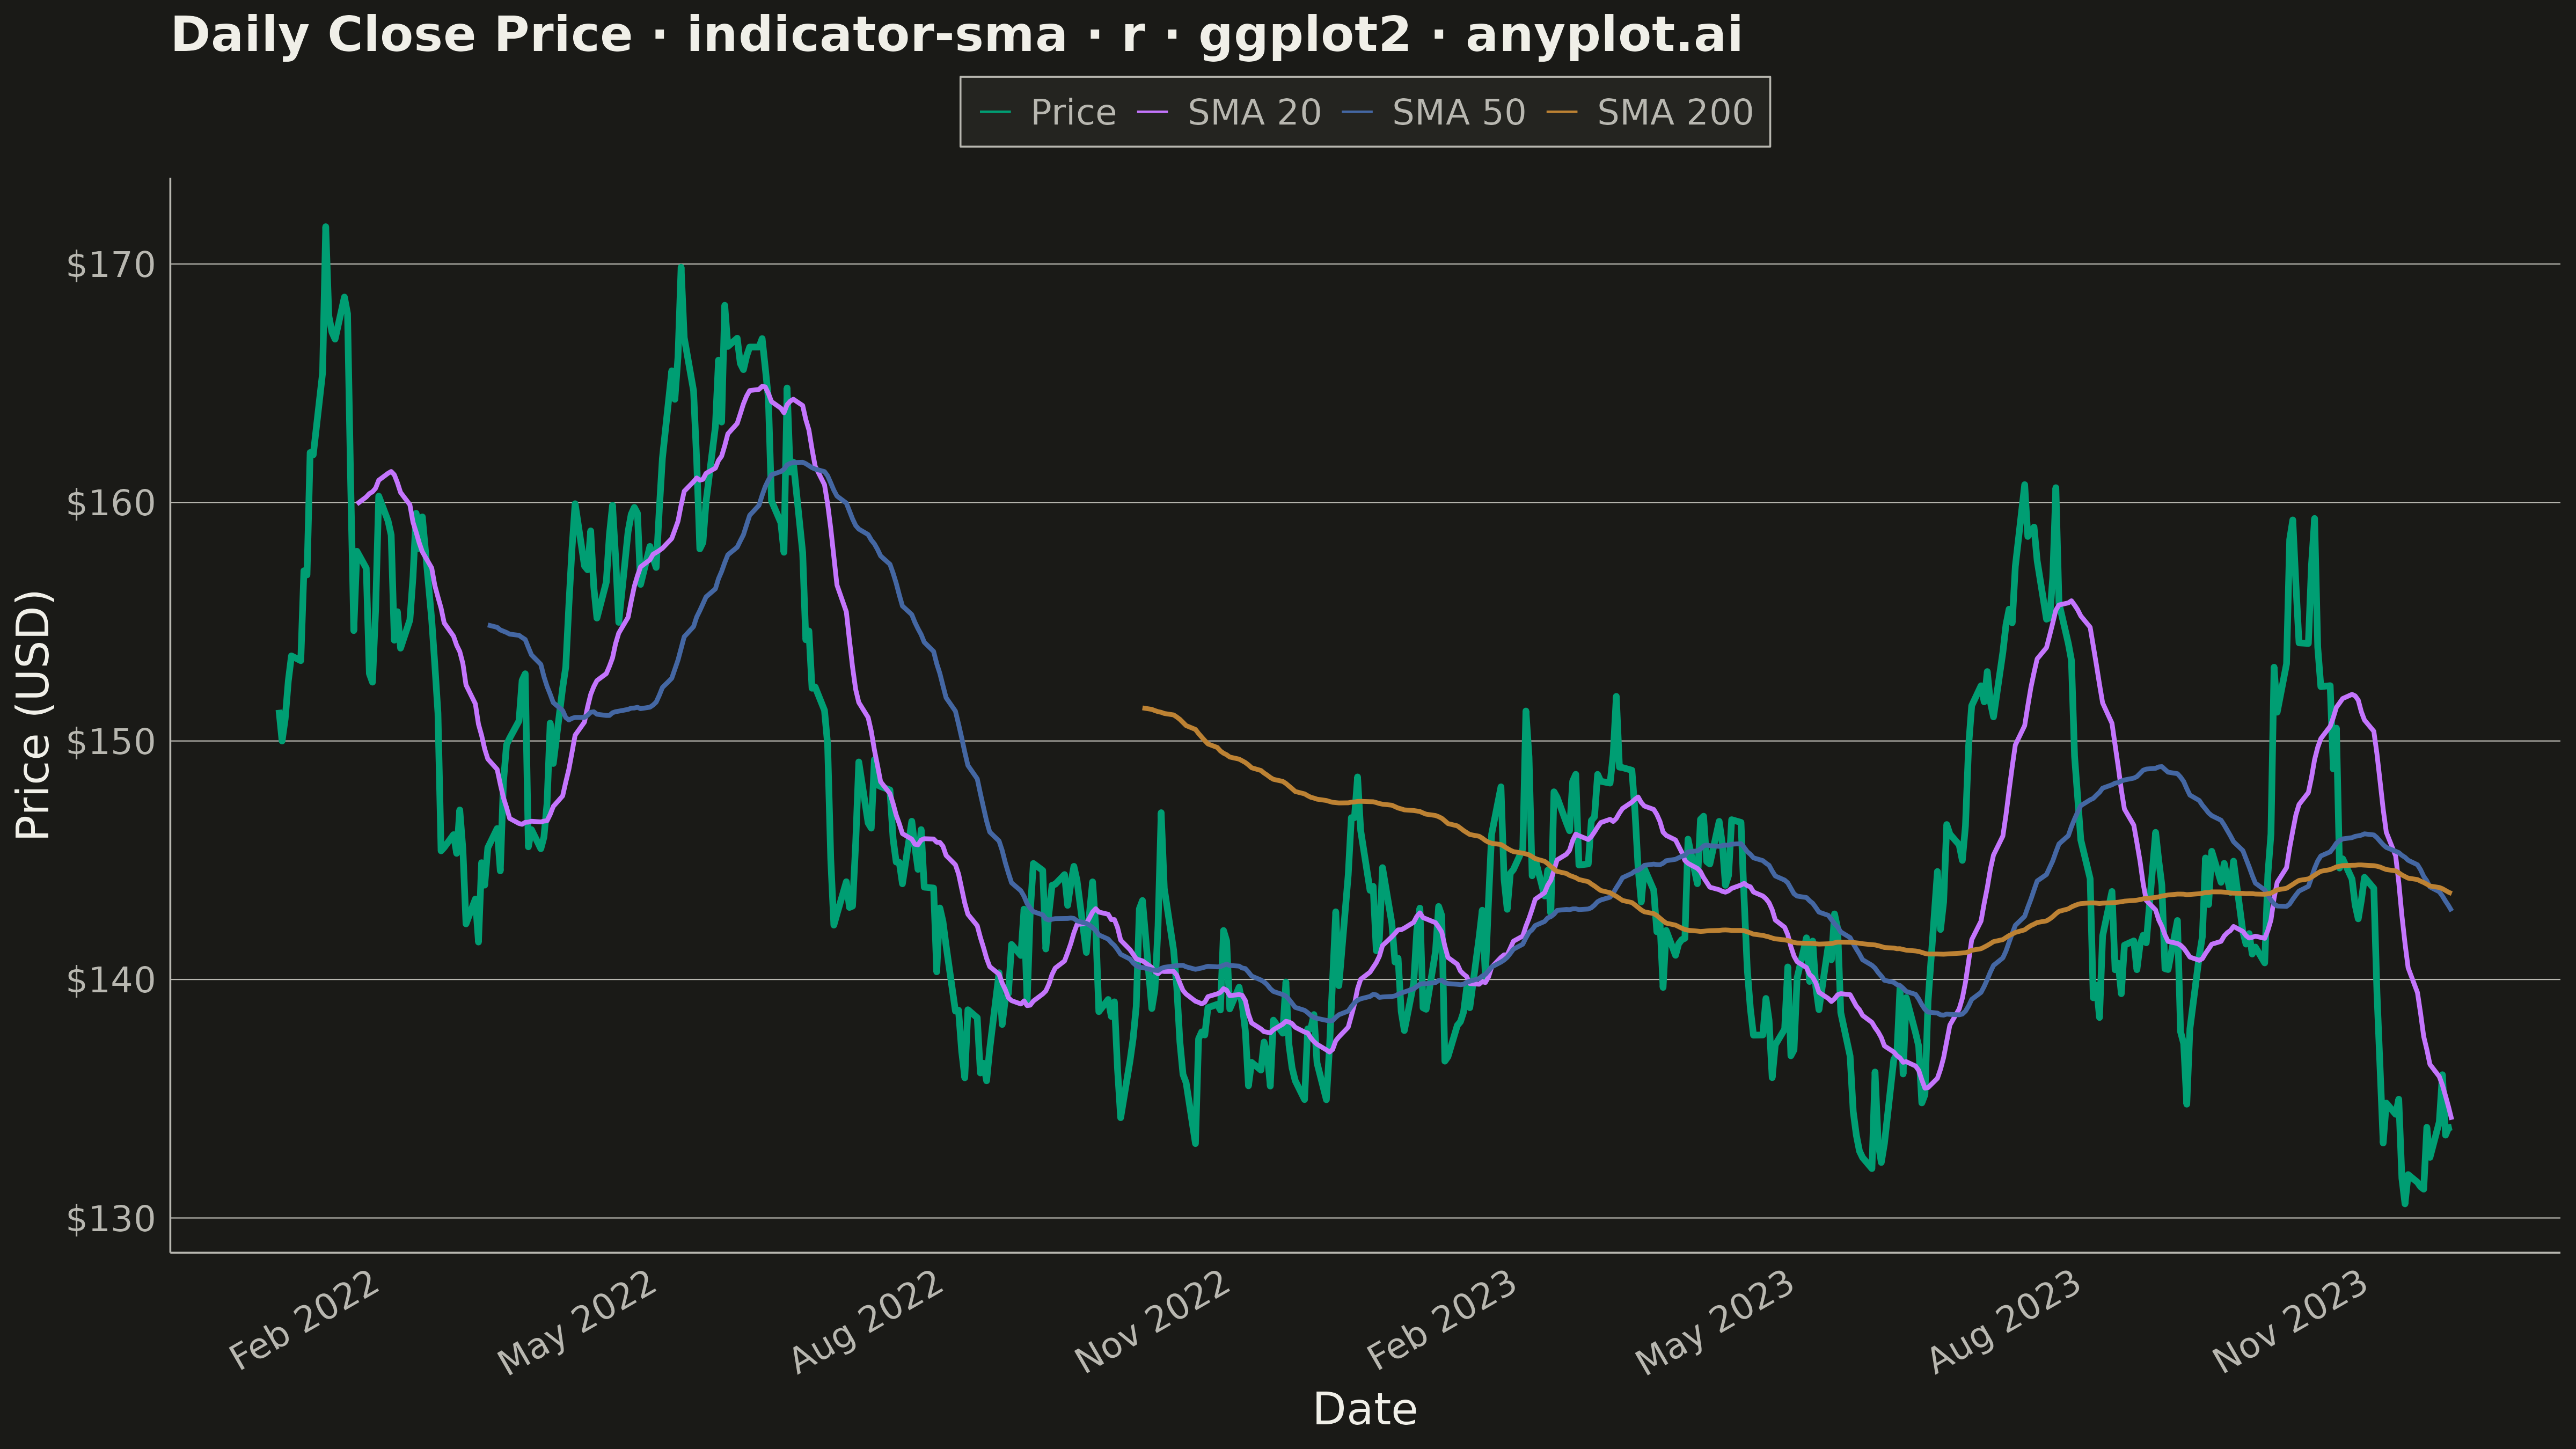
A Simple Moving Average (SMA) chart displays price or value data with one or more SMA overlays, typically showing short, medium, and long-term periods (e.g., 20, 50, 200-day). Each SMA line smooths out price fluctuations by averaging the last N data points, revealing underlying trends at different time scales. This multi-period overlay is fundamental to technical analysis, helping traders identify trend direction, support/resistance levels, and potential crossover signals.
#' anyplot.ai
#' indicator-sma: Simple Moving Average (SMA) Indicator Chart
#' Library: ggplot2 3.5.1 | R 4.4.1
#' Quality: 86/100 | Created: 2026-05-19

library(ggplot2)
library(dplyr)
library(tidyr)
library(scales)
library(ragg)

set.seed(42)

# Theme tokens
THEME       <- Sys.getenv("ANYPLOT_THEME", "light")
PAGE_BG     <- if (THEME == "light") "#FAF8F1" else "#1A1A17"
ELEVATED_BG <- if (THEME == "light") "#FFFDF6" else "#242420"
INK         <- if (THEME == "light") "#1A1A17" else "#F0EFE8"
INK_SOFT    <- if (THEME == "light") "#4A4A44" else "#B8B7B0"

IMPRINT <- c("#009E73", "#C475FD", "#4467A3", "#BD8233",
               "#AE3030", "#2ABCCD", "#954477")

# Data: 500 trading days of simulated stock prices
n_days <- 700L
all_dates <- seq(as.Date("2022-01-03"), by = "day", length.out = n_days)
trading_dates <- all_dates[!weekdays(all_dates) %in% c("Saturday", "Sunday")]
trading_dates <- trading_dates[seq_len(500L)]

daily_returns <- rnorm(500L, mean = 0.0004, sd = 0.016)
close_price   <- 148.0 * cumprod(1 + daily_returns)

# Rolling SMA helper
sma <- function(x, k) {
  out <- rep(NA_real_, length(x))
  for (i in seq(k, length(x))) {
    out[i] <- mean(x[(i - k + 1L):i])
  }
  out
}

df <- data.frame(
  date      = trading_dates,
  Price     = close_price,
  `SMA 20`  = sma(close_price, 20L),
  `SMA 50`  = sma(close_price, 50L),
  `SMA 200` = sma(close_price, 200L),
  check.names = FALSE
)

df_long <- tidyr::pivot_longer(df, cols = -date, names_to = "series", values_to = "value")
df_long$series <- factor(df_long$series, levels = c("Price", "SMA 20", "SMA 50", "SMA 200"))

series_colors <- setNames(IMPRINT[1:4], c("Price", "SMA 20", "SMA 50", "SMA 200"))
series_widths <- c("Price" = 1.4, "SMA 20" = 1.0, "SMA 50" = 1.0, "SMA 200" = 1.0)

# Plot
p <- ggplot(df_long, aes(x = date, y = value, color = series, linewidth = series)) +
  geom_line(na.rm = TRUE) +
  scale_color_manual(values = series_colors) +
  scale_linewidth_manual(values = series_widths) +
  scale_x_date(date_breaks = "3 months", date_labels = "%b %Y") +
  scale_y_continuous(labels = scales::dollar_format(prefix = "$", accuracy = 1)) +
  guides(linewidth = "none") +
  labs(
    title = "Daily Close Price · indicator-sma · r · ggplot2 · anyplot.ai",
    x     = "Date",
    y     = "Price (USD)",
    color = NULL
  ) +
  theme_minimal(base_size = 14) +
  theme(
    plot.background    = element_rect(fill = PAGE_BG, color = PAGE_BG),
    panel.background   = element_rect(fill = PAGE_BG, color = NA),
    panel.grid.major.y = element_line(color = INK_SOFT, linewidth = 0.25),
    panel.grid.major.x = element_blank(),
    panel.grid.minor   = element_blank(),
    axis.title         = element_text(color = INK,      size = 20),
    axis.text          = element_text(color = INK_SOFT, size = 16),
    axis.text.x        = element_text(angle = 30, hjust = 1),
    axis.line.x        = element_line(color = INK_SOFT, linewidth = 0.4),
    axis.line.y        = element_line(color = INK_SOFT, linewidth = 0.4),
    plot.title         = element_text(color = INK,      size = 22, face = "bold"),
    legend.background  = element_rect(fill = ELEVATED_BG, color = INK_SOFT, linewidth = 0.4),
    legend.text        = element_text(color = INK_SOFT, size = 16),
    legend.key         = element_rect(fill = NA),
    legend.position    = "top",
    legend.direction   = "horizontal"
  )

# Save
ggsave(
  filename = sprintf("plot-%s.png", THEME),
  plot     = p,
  device   = ragg::agg_png,
  width    = 16,
  height   = 9,
  units    = "in",
  dpi      = 300
)
Runnable source as JSON, for any HTTP client: https://api.anyplot.ai/specs/indicator-sma/ggplot2/code. Any spec id and library id listed in llms-full.txt fit the same URL shape; every URL below is complete and callable.
{
  "spec_id": "indicator-sma",
  "language": "r",
  "library": "ggplot2",
  "page": "https://anyplot.ai/indicator-sma/r/ggplot2",
  "hub": "https://anyplot.ai/indicator-sma",
  "code_json": "https://api.anyplot.ai/specs/indicator-sma/ggplot2/code",
  "spec_json": "https://api.anyplot.ai/specs/indicator-sma",
  "render_light_png": "https://storage.googleapis.com/anyplot-images/plots/indicator-sma/r/ggplot2/plot-light.png",
  "render_dark_png": "https://storage.googleapis.com/anyplot-images/plots/indicator-sma/r/ggplot2/plot-dark.png",
  "quality_score": 86.0,
  "license": "MIT",
  "guide": "https://anyplot.ai/llms.txt"
}
Part of Simple Moving Average (SMA) Indicator Chart on anyplot.ai.