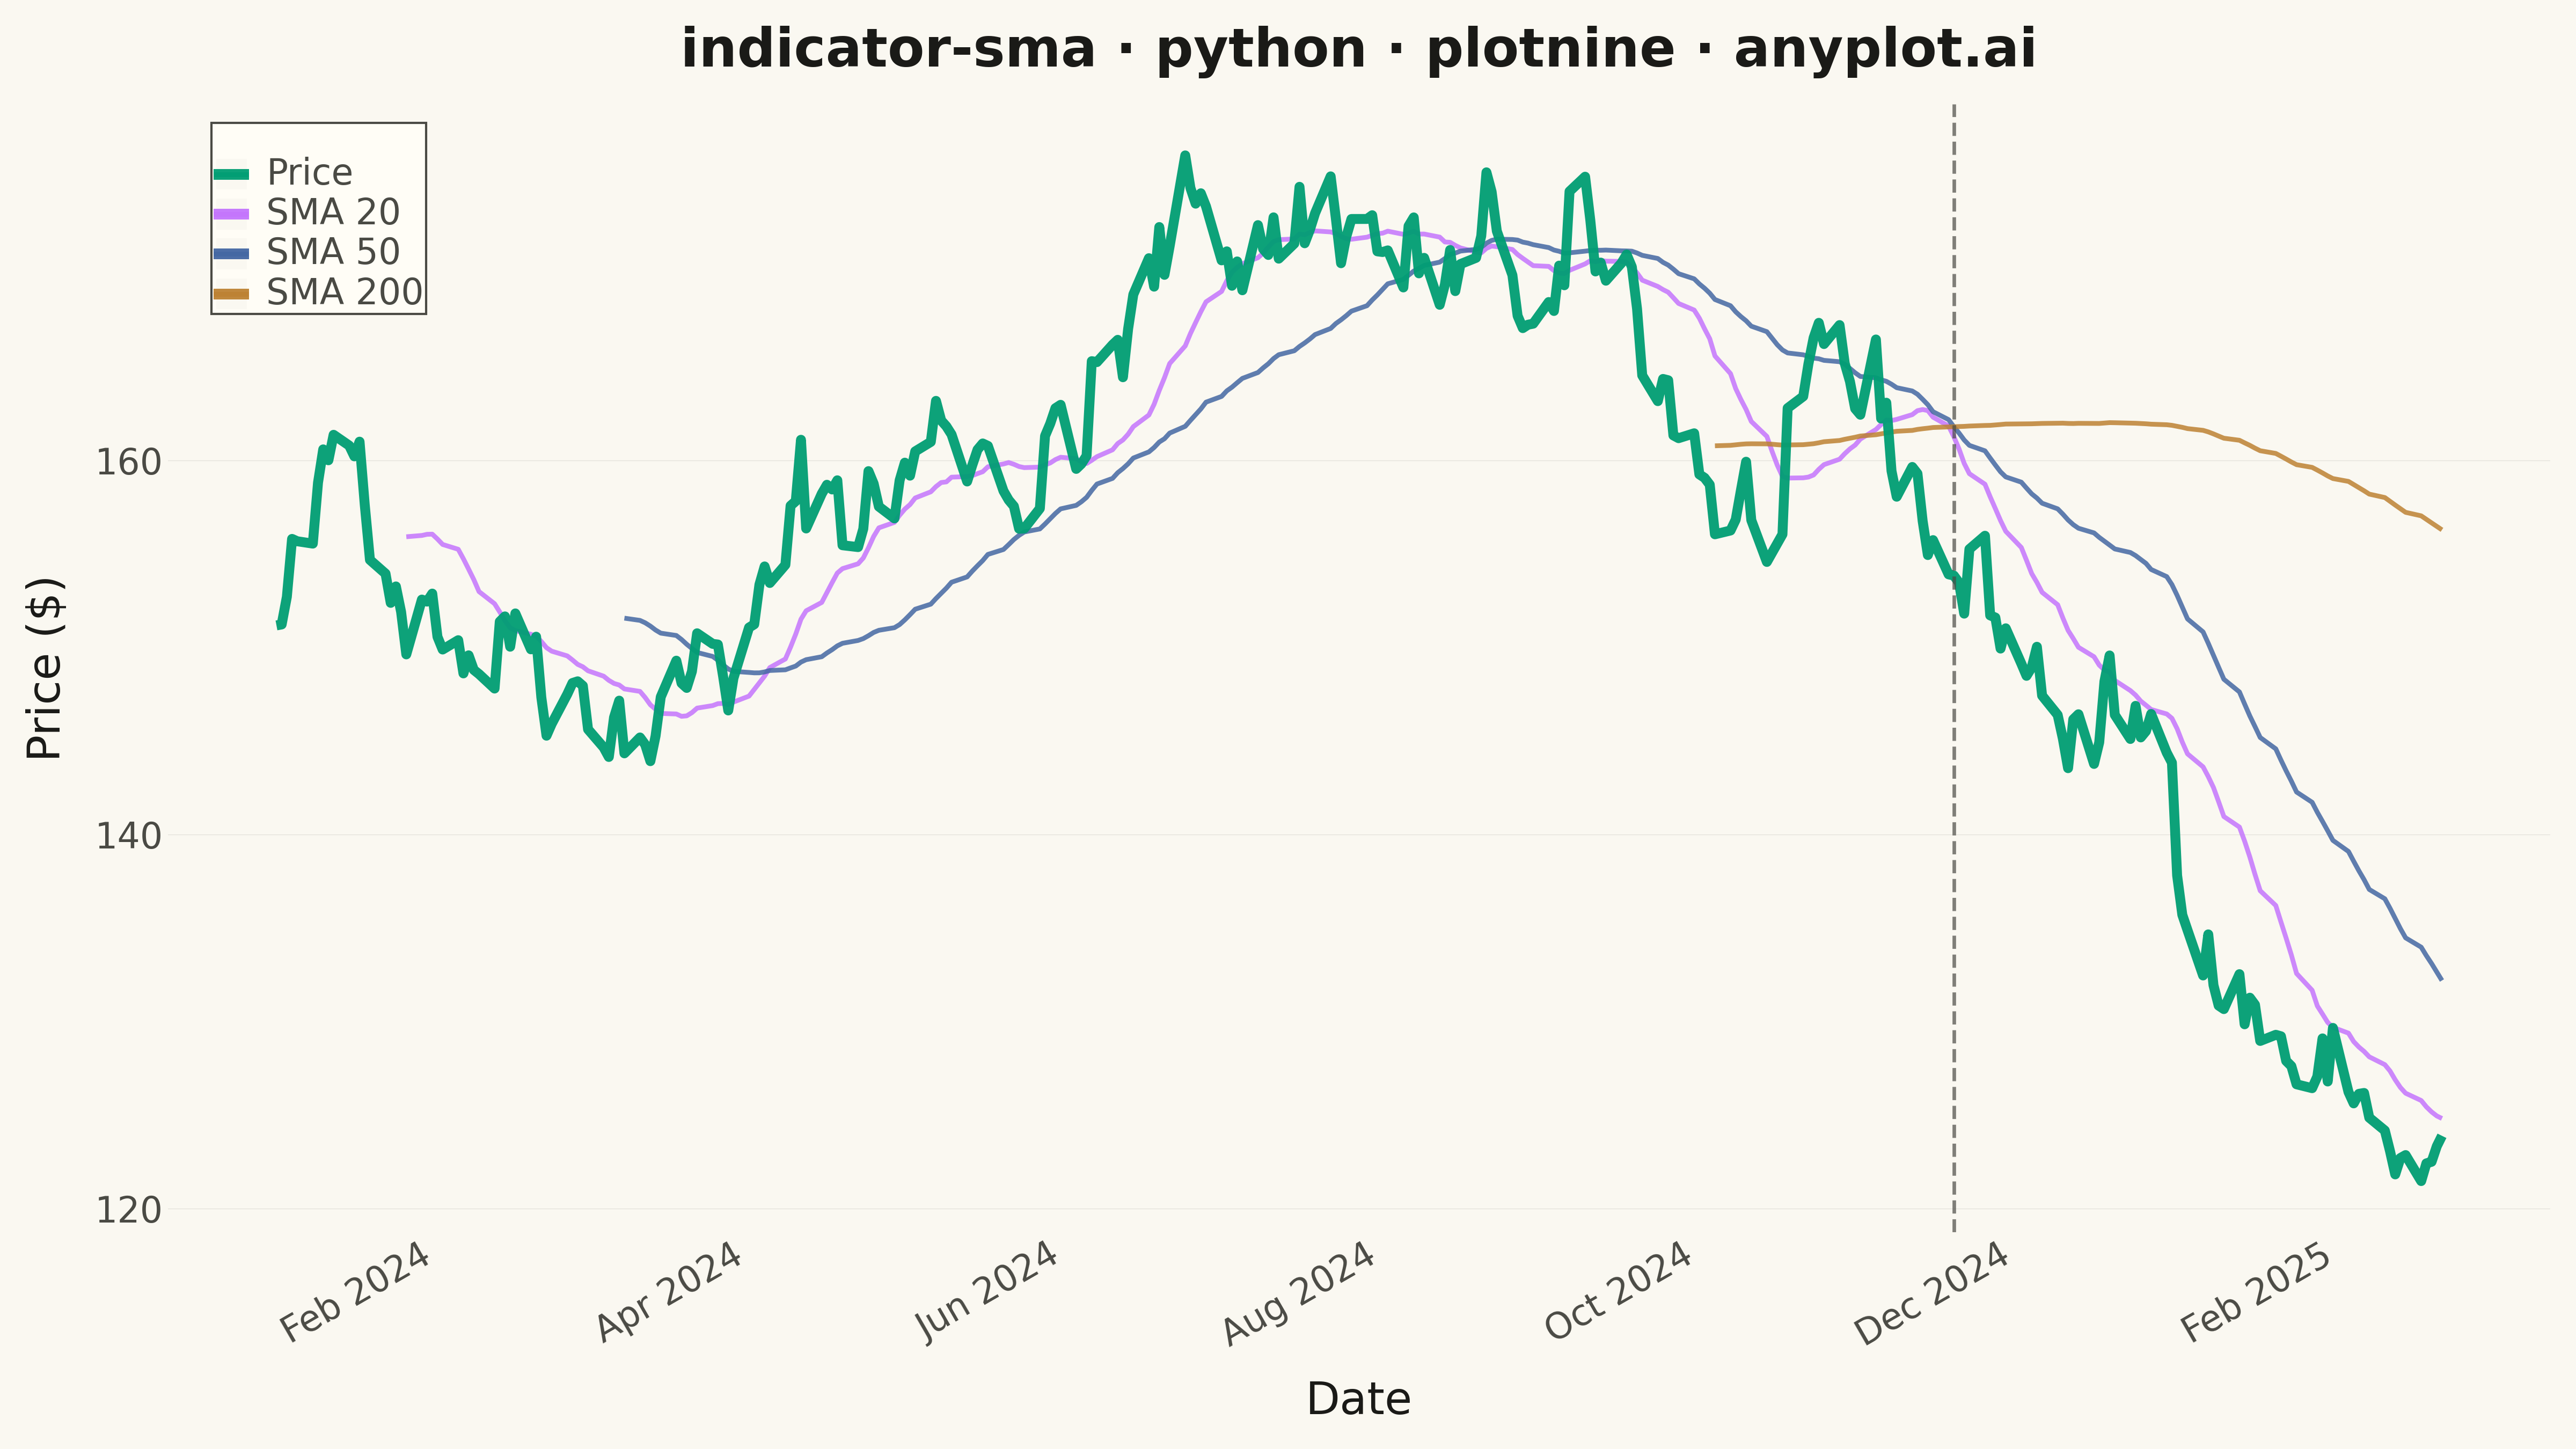
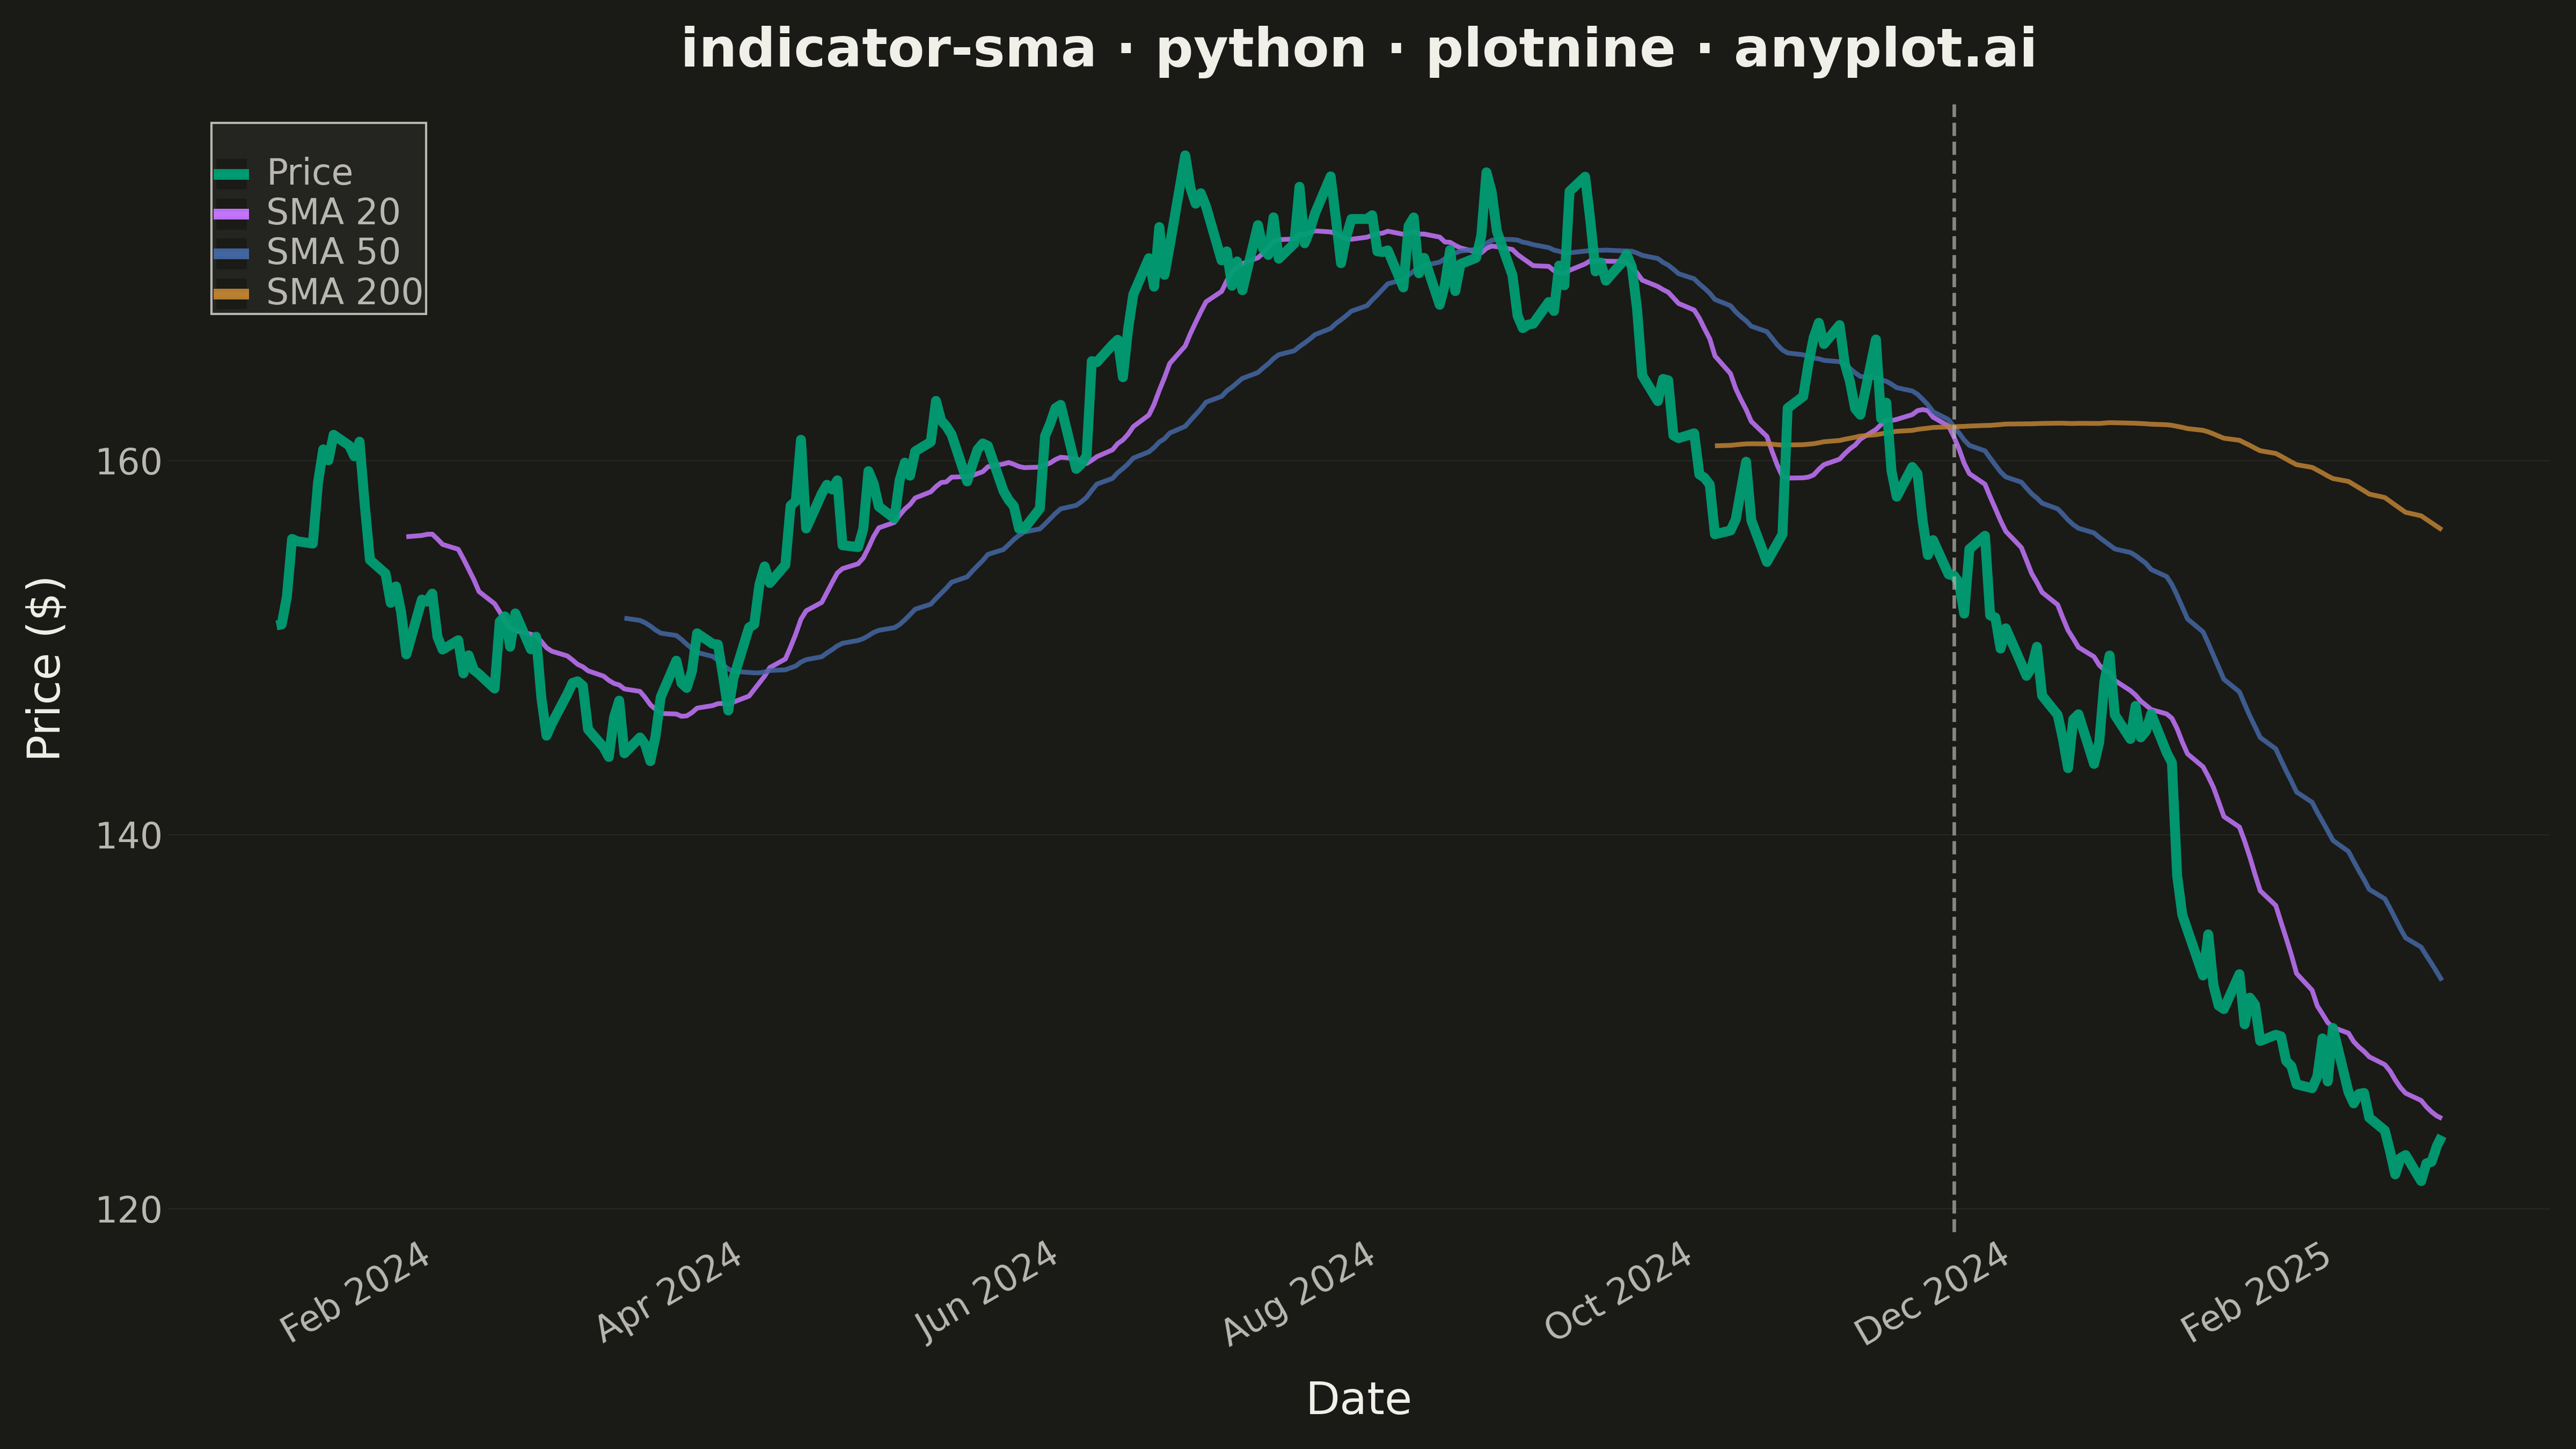
A Simple Moving Average (SMA) chart displays price or value data with one or more SMA overlays, typically showing short, medium, and long-term periods (e.g., 20, 50, 200-day). Each SMA line smooths out price fluctuations by averaging the last N data points, revealing underlying trends at different time scales. This multi-period overlay is fundamental to technical analysis, helping traders identify trend direction, support/resistance levels, and potential crossover signals.
""" anyplot.ai
indicator-sma: Simple Moving Average (SMA) Indicator Chart
Library: plotnine 0.15.4 | Python 3.13.13
Quality: 88/100 | Updated: 2026-05-19
"""

import os

import numpy as np
import pandas as pd
from plotnine import (
    aes,
    annotate,
    element_line,
    element_rect,
    element_text,
    geom_line,
    ggplot,
    labs,
    scale_color_manual,
    scale_x_datetime,
    theme,
    theme_minimal,
)


# Theme tokens
THEME = os.getenv("ANYPLOT_THEME", "light")
PAGE_BG = "#FAF8F1" if THEME == "light" else "#1A1A17"
ELEVATED_BG = "#FFFDF6" if THEME == "light" else "#242420"
INK = "#1A1A17" if THEME == "light" else "#F0EFE8"
INK_SOFT = "#4A4A44" if THEME == "light" else "#B8B7B0"

IMPRINT = ["#009E73", "#C475FD", "#4467A3", "#BD8233"]
GOLDEN_COLOR = "#DDCC77"  # imprint amber — "golden cross" semantic
DEATH_COLOR = INK_SOFT  # muted gray — "death" signal, theme-adaptive

# Data — bull market (days 1–150) followed by bear market (days 150–300),
# engineered to produce a visible death cross once SMA 200 is available
np.random.seed(42)
n_days = 300
dates = pd.date_range("2024-01-01", periods=n_days, freq="B")

base_price = 150
returns = np.random.normal(0.0, 0.012, n_days)
trend = np.zeros(n_days)
trend[:150] = 0.002  # moderate uptrend
trend[150:] = -0.003  # sharper reversal
returns = returns + trend
close = base_price * np.cumprod(1 + returns)

# Calculate SMAs
df = pd.DataFrame({"date": dates, "close": close})
df["sma_20"] = df["close"].rolling(window=20).mean()
df["sma_50"] = df["close"].rolling(window=50).mean()
df["sma_200"] = df["close"].rolling(window=200).mean()

# Detect SMA 50 / SMA 200 crossovers (golden cross & death cross)
valid = df.dropna(subset=["sma_50", "sma_200"]).copy()
valid["diff"] = valid["sma_50"] - valid["sma_200"]
valid["prev_diff"] = valid["diff"].shift(1)
crossovers = valid[valid["prev_diff"].notna() & (valid["prev_diff"] * valid["diff"] < 0)].copy()
crossovers["cross_type"] = crossovers["diff"].apply(lambda d: "Golden Cross" if d > 0 else "Death Cross")

# Reshape to long format for plotnine
df_long = pd.melt(
    df, id_vars=["date"], value_vars=["close", "sma_20", "sma_50", "sma_200"], var_name="series", value_name="price"
)
series_labels = {"close": "Price", "sma_20": "SMA 20", "sma_50": "SMA 50", "sma_200": "SMA 200"}
df_long["series"] = df_long["series"].map(series_labels)
series_order = ["Price", "SMA 20", "SMA 50", "SMA 200"]
df_long["series"] = pd.Categorical(df_long["series"], categories=series_order, ordered=True)

colors = {"Price": IMPRINT[0], "SMA 20": IMPRINT[1], "SMA 50": IMPRINT[2], "SMA 200": IMPRINT[3]}

# Separate data to draw SMAs behind price line at different thicknesses
price_data = df_long[df_long["series"] == "Price"]
sma_data = df_long[df_long["series"] != "Price"]

plot = (
    ggplot(df_long, aes(x="date", y="price", color="series"))
    + geom_line(data=sma_data, size=1.2, alpha=0.85)  # SMAs drawn first (behind price)
    + geom_line(data=price_data, size=2.5, alpha=0.95)  # Price drawn on top, prominently
    + scale_color_manual(values=colors)
    + scale_x_datetime(date_breaks="2 months", date_labels="%b %Y")
    + labs(x="Date", y="Price ($)", title="indicator-sma · python · plotnine · anyplot.ai", color="")
    + theme_minimal()
    + theme(
        figure_size=(16, 9),
        plot_background=element_rect(fill=PAGE_BG, color=PAGE_BG),
        panel_background=element_rect(fill=PAGE_BG),
        plot_title=element_text(size=24, weight="bold", color=INK),
        axis_title=element_text(size=20, color=INK),
        axis_text=element_text(size=16, color=INK_SOFT),
        axis_text_x=element_text(size=16, rotation=30, ha="right", color=INK_SOFT),
        legend_text=element_text(size=16, color=INK_SOFT),
        legend_position=(0.02, 0.98),
        legend_direction="vertical",
        legend_background=element_rect(fill=ELEVATED_BG, color=INK_SOFT),
        panel_grid_major_y=element_line(color=INK, size=0.3, alpha=0.10),
        panel_grid_major_x=element_line(alpha=0),
        panel_grid_minor=element_line(alpha=0),
    )
)

# Annotate crossover signals with vertical dashed lines
for _, row in crossovers.iterrows():
    is_golden = row["cross_type"] == "Golden Cross"
    color = GOLDEN_COLOR if is_golden else DEATH_COLOR
    plot = plot + annotate("vline", xintercept=row["date"], color=color, size=0.9, alpha=0.7, linetype="dashed")

plot.save(f"plot-{THEME}.png", dpi=300)
Runnable source as JSON, for any HTTP client: https://api.anyplot.ai/specs/indicator-sma/plotnine/code. Any spec id and library id listed in llms-full.txt fit the same URL shape; every URL below is complete and callable.
{
  "spec_id": "indicator-sma",
  "language": "python",
  "library": "plotnine",
  "page": "https://anyplot.ai/indicator-sma/python/plotnine",
  "hub": "https://anyplot.ai/indicator-sma",
  "code_json": "https://api.anyplot.ai/specs/indicator-sma/plotnine/code",
  "spec_json": "https://api.anyplot.ai/specs/indicator-sma",
  "render_light_png": "https://storage.googleapis.com/anyplot-images/plots/indicator-sma/python/plotnine/plot-light.png",
  "render_dark_png": "https://storage.googleapis.com/anyplot-images/plots/indicator-sma/python/plotnine/plot-dark.png",
  "quality_score": 88.0,
  "license": "MIT",
  "guide": "https://anyplot.ai/llms.txt"
}
Part of Simple Moving Average (SMA) Indicator Chart on anyplot.ai.