The same plot in 14 other libraries — JavaScript: Chart.js, Apache ECharts, Highcharts, MUI X Charts; Python: Altair, Bokeh, lets-plot, Matplotlib, Plotly, plotnine, Pygal, Seaborn; R: ggplot2; Julia: Makie.jl. Compare all 15 side by side: Simple Moving Average (SMA) Indicator Chart in Python, R, Julia and JavaScript.
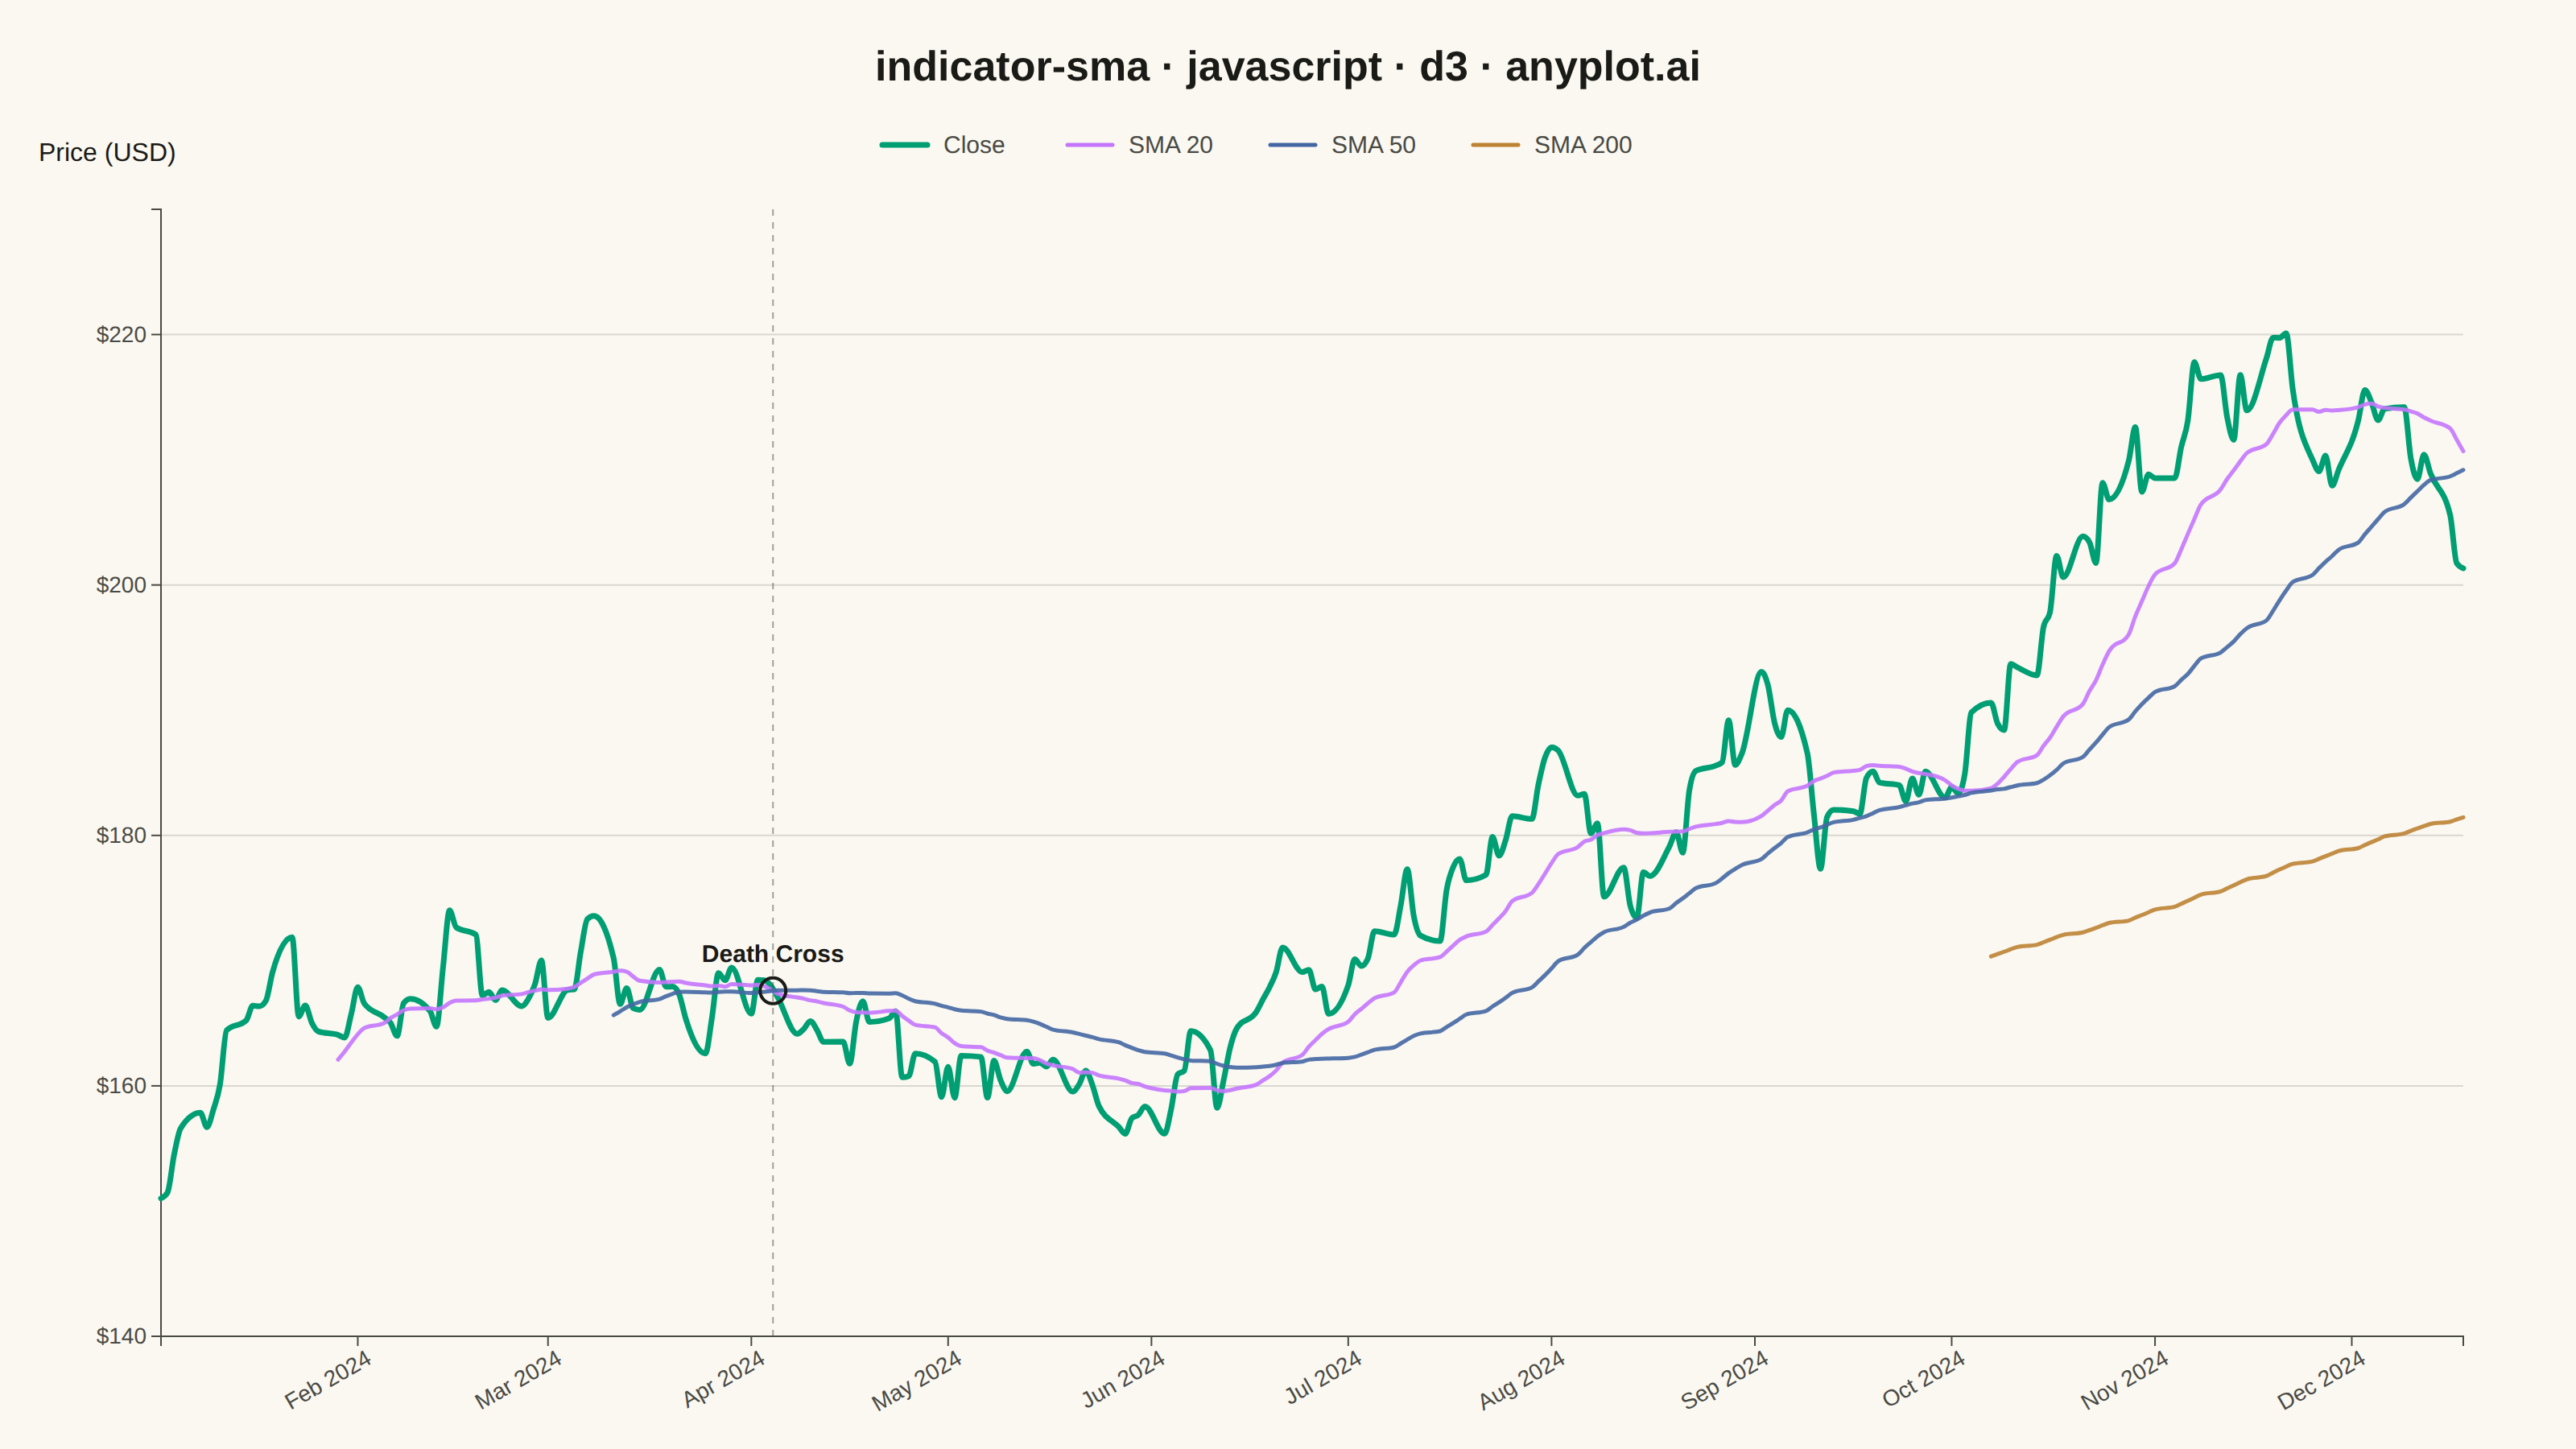
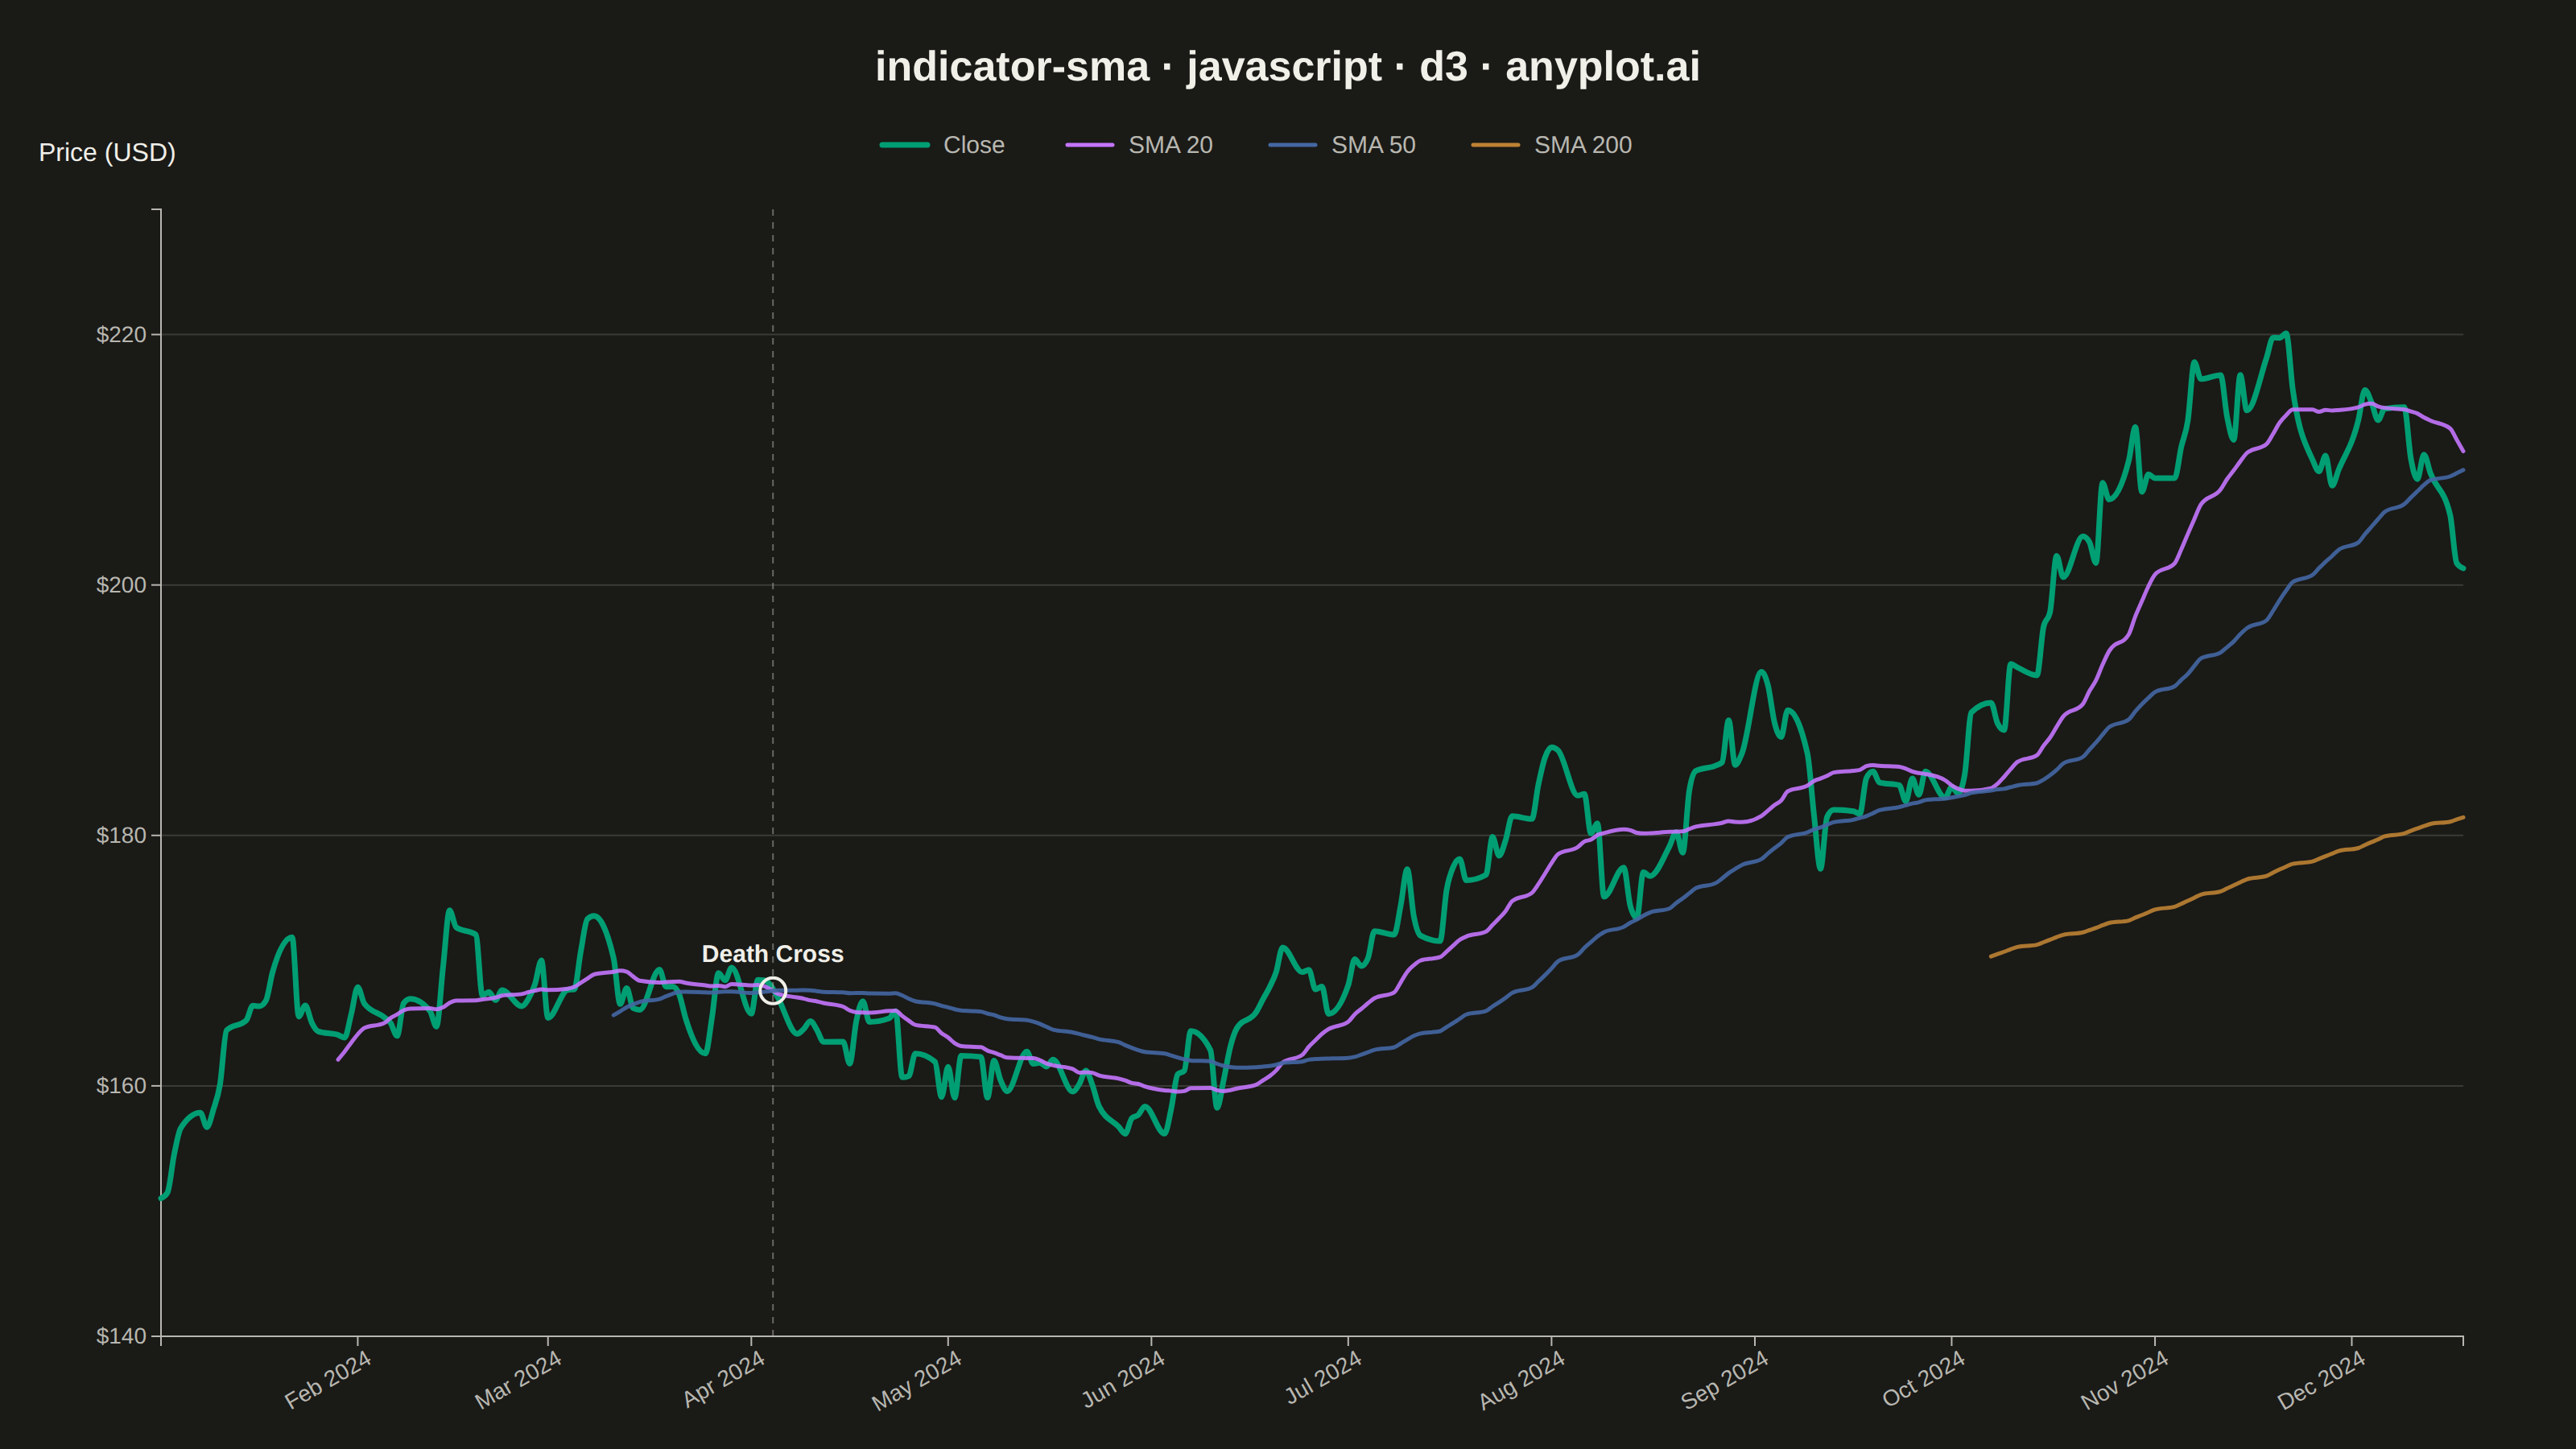
A Simple Moving Average (SMA) chart displays price or value data with one or more SMA overlays, typically showing short, medium, and long-term periods (e.g., 20, 50, 200-day). Each SMA line smooths out price fluctuations by averaging the last N data points, revealing underlying trends at different time scales. This multi-period overlay is fundamental to technical analysis, helping traders identify trend direction, support/resistance levels, and potential crossover signals.
// anyplot.ai
// indicator-sma: Simple Moving Average (SMA) Indicator Chart
// Library: d3 7.9.0 | JavaScript 22.23.2
// Quality: 90/100 | Created: 2026-09-02

const t = window.ANYPLOT_TOKENS;
const { width, height } = window.ANYPLOT_SIZE;
const margin = { top: 130, right: 70, bottom: 70, left: 100 };
const iw = width - margin.left - margin.right;
const ih = height - margin.top - margin.bottom;

// --- Data: one year of daily closes (fixed-seed LCG random walk) + SMA overlays
function lcg(seed) {
  let state = seed;
  return () => {
    state = (state * 1664525 + 1013904223) % 4294967296;
    return state / 4294967296;
  };
}
const rand = lcg(42);
function gaussian() {
  const u1 = Math.max(rand(), 1e-9);
  const u2 = rand();
  return Math.sqrt(-2 * Math.log(u1)) * Math.cos(2 * Math.PI * u2);
}

const PERIODS = 252;
const dates = [];
const cursor = new Date(2024, 0, 2);
while (dates.length < PERIODS) {
  const weekday = cursor.getDay();
  if (weekday !== 0 && weekday !== 6) dates.push(new Date(cursor));
  cursor.setDate(cursor.getDate() + 1);
}

const closes = [];
let price = 148;
for (let i = 0; i < PERIODS; i++) {
  price *= 1 + 0.0006 + 0.014 * gaussian();
  closes.push(price);
}

function movingAverage(values, period) {
  return values.map((_, i) => {
    if (i < period - 1) return null;
    let sum = 0;
    for (let j = i - period + 1; j <= i; j++) sum += values[j];
    return sum / period;
  });
}

const series = [
  { key: "close", label: "Close", values: closes, color: t.palette[0], width: 3.5 },
  { key: "sma20", label: "SMA 20", values: movingAverage(closes, 20), color: t.palette[1], width: 2.5 },
  { key: "sma50", label: "SMA 50", values: movingAverage(closes, 50), color: t.palette[2], width: 2.5 },
  { key: "sma200", label: "SMA 200", values: movingAverage(closes, 200), color: t.palette[3], width: 2.5 },
];

// --- Crossover detection (SMA 20 x SMA 50, D3-computed golden/death cross) --
function findCrossover(a, b) {
  for (let i = 1; i < a.length; i++) {
    if (a[i - 1] === null || b[i - 1] === null || a[i] === null || b[i] === null) continue;
    const prevDiff = a[i - 1] - b[i - 1];
    const currDiff = a[i] - b[i];
    if (prevDiff === 0) continue;
    if ((prevDiff < 0 && currDiff >= 0) || (prevDiff > 0 && currDiff <= 0)) {
      const frac = prevDiff / (prevDiff - currDiff);
      return {
        date: new Date(dates[i - 1].getTime() + frac * (dates[i].getTime() - dates[i - 1].getTime())),
        value: a[i - 1] + frac * (a[i] - a[i - 1]),
        bullish: prevDiff < 0,
      };
    }
  }
  return null;
}
const crossover = findCrossover(series[1].values, series[2].values);

// --- Scales -------------------------------------------------------------
const x = d3.scaleTime().domain(d3.extent(dates)).range([0, iw]);
const allValues = series.flatMap((s) => s.values).filter((v) => v !== null);
const y = d3
  .scaleLinear()
  .domain([d3.min(allValues) * 0.97, d3.max(allValues) * 1.03])
  .nice()
  .range([ih, 0]);

// --- SVG mount ------------------------------------------------------------
const svg = d3.select("#container").append("svg").attr("width", width).attr("height", height);
const g = svg.append("g").attr("transform", `translate(${margin.left},${margin.top})`);

// --- Gridlines (y-axis only, per spec) -------------------------------------
g.append("g")
  .attr("class", "grid")
  .call(d3.axisLeft(y).ticks(6).tickSize(-iw).tickFormat(""))
  .call((sel) => sel.select(".domain").remove())
  .selectAll("line")
  .attr("stroke", t.grid);

// --- Axes -------------------------------------------------------------------
const xAxis = g
  .append("g")
  .attr("transform", `translate(0,${ih})`)
  .call(d3.axisBottom(x).ticks(d3.timeMonth.every(1)).tickFormat(d3.timeFormat("%b %Y")));
const yAxis = g.append("g").call(d3.axisLeft(y).ticks(6).tickFormat(d3.format("$,.0f")));
for (const axis of [xAxis, yAxis]) {
  axis.selectAll("text").attr("fill", t.inkSoft).style("font-size", "14px");
  axis.selectAll("line").attr("stroke", t.inkSoft);
  axis.select(".domain").attr("stroke", t.inkSoft);
}
xAxis.selectAll("text").attr("transform", "rotate(-30)").style("text-anchor", "end");

g.append("text")
  .attr("x", -margin.left + 24)
  .attr("y", -30)
  .attr("fill", t.ink)
  .style("font-size", "16px")
  .text("Price (USD)");

// --- Lines ------------------------------------------------------------------
const line = d3
  .line()
  .defined((d) => d.value !== null)
  .x((d) => x(d.date))
  .y((d) => y(d.value))
  .curve(d3.curveMonotoneX);

for (const s of series) {
  const points = dates.map((date, i) => ({ date, value: s.values[i] }));
  g.append("path")
    .datum(points)
    .attr("fill", "none")
    .attr("stroke", s.color)
    .attr("stroke-width", s.width)
    .attr("stroke-linejoin", "round")
    .attr("stroke-linecap", "round")
    .attr("opacity", s.key === "close" ? 1 : 0.9)
    .attr("d", line);
}

// --- Crossover annotation (marks the golden/death cross with a dashed rule,
// a ringed marker, and a leader-line label) --------------------------------
if (crossover) {
  const cx = x(crossover.date);
  const cy = y(crossover.value);
  const label = crossover.bullish ? "Golden Cross" : "Death Cross";
  const labelBelow = cy < ih * 0.3;

  g.append("line")
    .attr("x1", cx)
    .attr("x2", cx)
    .attr("y1", 0)
    .attr("y2", ih)
    .attr("stroke", t.inkSoft)
    .attr("stroke-width", 1)
    .attr("stroke-dasharray", "4,4")
    .attr("opacity", 0.5);

  g.append("circle")
    .attr("cx", cx)
    .attr("cy", cy)
    .attr("r", 8)
    .attr("fill", "none")
    .attr("stroke", t.ink)
    .attr("stroke-width", 2);

  g.append("text")
    .attr("x", cx)
    .attr("y", labelBelow ? cy + 28 : cy - 18)
    .attr("text-anchor", "middle")
    .attr("fill", t.ink)
    .style("font-size", "15px")
    .style("font-weight", "600")
    .text(label);
}

// --- Title --------------------------------------------------------------
svg
  .append("text")
  .attr("x", width / 2)
  .attr("y", 50)
  .attr("text-anchor", "middle")
  .attr("fill", t.ink)
  .style("font-size", "26px")
  .style("font-weight", "600")
  .text("indicator-sma · javascript · d3 · anyplot.ai");

// --- Legend (horizontal, below title) ---------------------------------------
const legend = svg.append("g").attr("transform", `translate(0, 90)`);
const legendWidth = series.reduce((acc, s) => acc + s.label.length * 11 + 60, 0);
let cursorX = width / 2 - legendWidth / 2;
for (const s of series) {
  const item = legend.append("g").attr("transform", `translate(${cursorX},0)`);
  item
    .append("line")
    .attr("x1", 0)
    .attr("x2", 28)
    .attr("y1", 0)
    .attr("y2", 0)
    .attr("stroke", s.color)
    .attr("stroke-width", s.width)
    .attr("stroke-linecap", "round");
  item
    .append("text")
    .attr("x", 38)
    .attr("y", 5)
    .attr("fill", t.inkSoft)
    .style("font-size", "15px")
    .text(s.label);
  cursorX += s.label.length * 11 + 60;
}
Runnable source as JSON, for any HTTP client: https://api.anyplot.ai/specs/indicator-sma/d3/code. Any spec id and library id listed in llms-full.txt fit the same URL shape; every URL below is complete and callable.
{
  "spec_id": "indicator-sma",
  "language": "javascript",
  "library": "d3",
  "page": "https://anyplot.ai/indicator-sma/javascript/d3",
  "hub": "https://anyplot.ai/indicator-sma",
  "code_json": "https://api.anyplot.ai/specs/indicator-sma/d3/code",
  "spec_json": "https://api.anyplot.ai/specs/indicator-sma",
  "render_light_png": "https://storage.googleapis.com/anyplot-images/plots/indicator-sma/javascript/d3/plot-light.png",
  "render_dark_png": "https://storage.googleapis.com/anyplot-images/plots/indicator-sma/javascript/d3/plot-dark.png",
  "interactive_light_html": "https://storage.googleapis.com/anyplot-images/plots/indicator-sma/javascript/d3/plot-light.html",
  "interactive_dark_html": "https://storage.googleapis.com/anyplot-images/plots/indicator-sma/javascript/d3/plot-dark.html",
  "quality_score": 90.0,
  "license": "MIT",
  "guide": "https://anyplot.ai/llms.txt"
}
Part of Simple Moving Average (SMA) Indicator Chart on anyplot.ai.