The same plot in 14 other libraries — JavaScript: Chart.js, D3.js, Apache ECharts, MUI X Charts; Python: Altair, Bokeh, lets-plot, Matplotlib, Plotly, plotnine, Pygal, Seaborn; R: ggplot2; Julia: Makie.jl. Compare all 15 side by side: Simple Moving Average (SMA) Indicator Chart in Python, R, Julia and JavaScript.
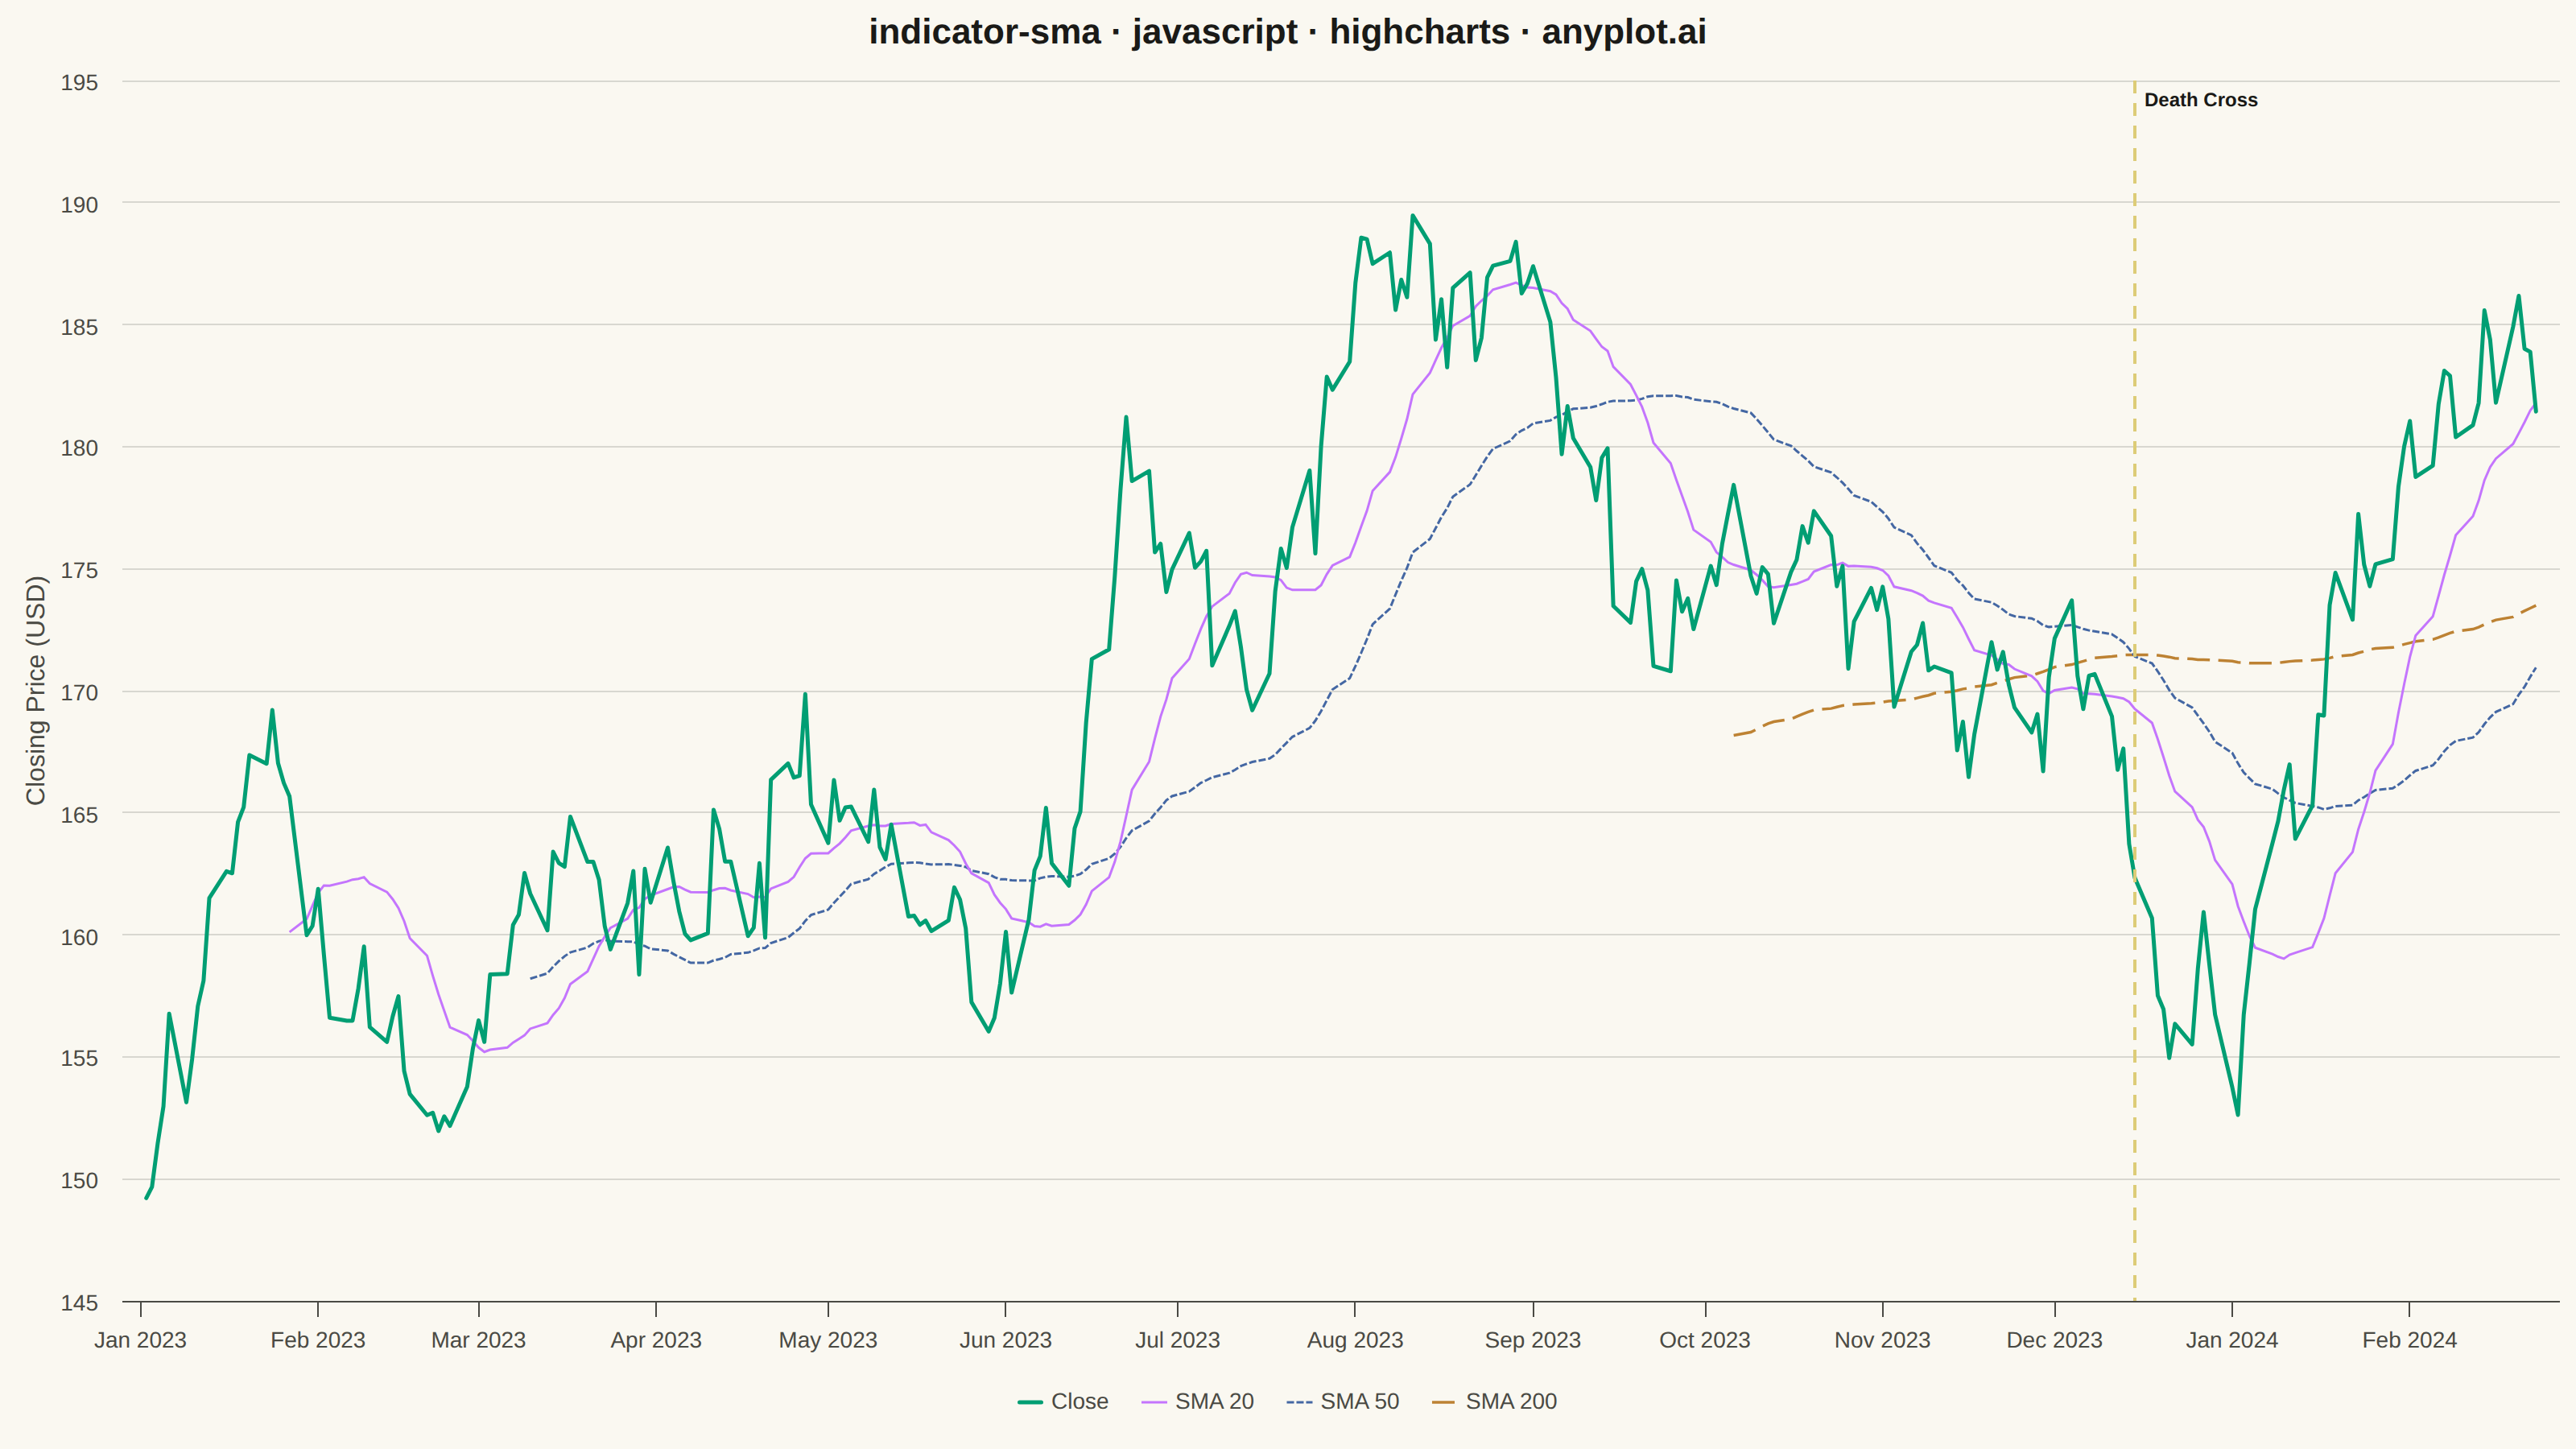
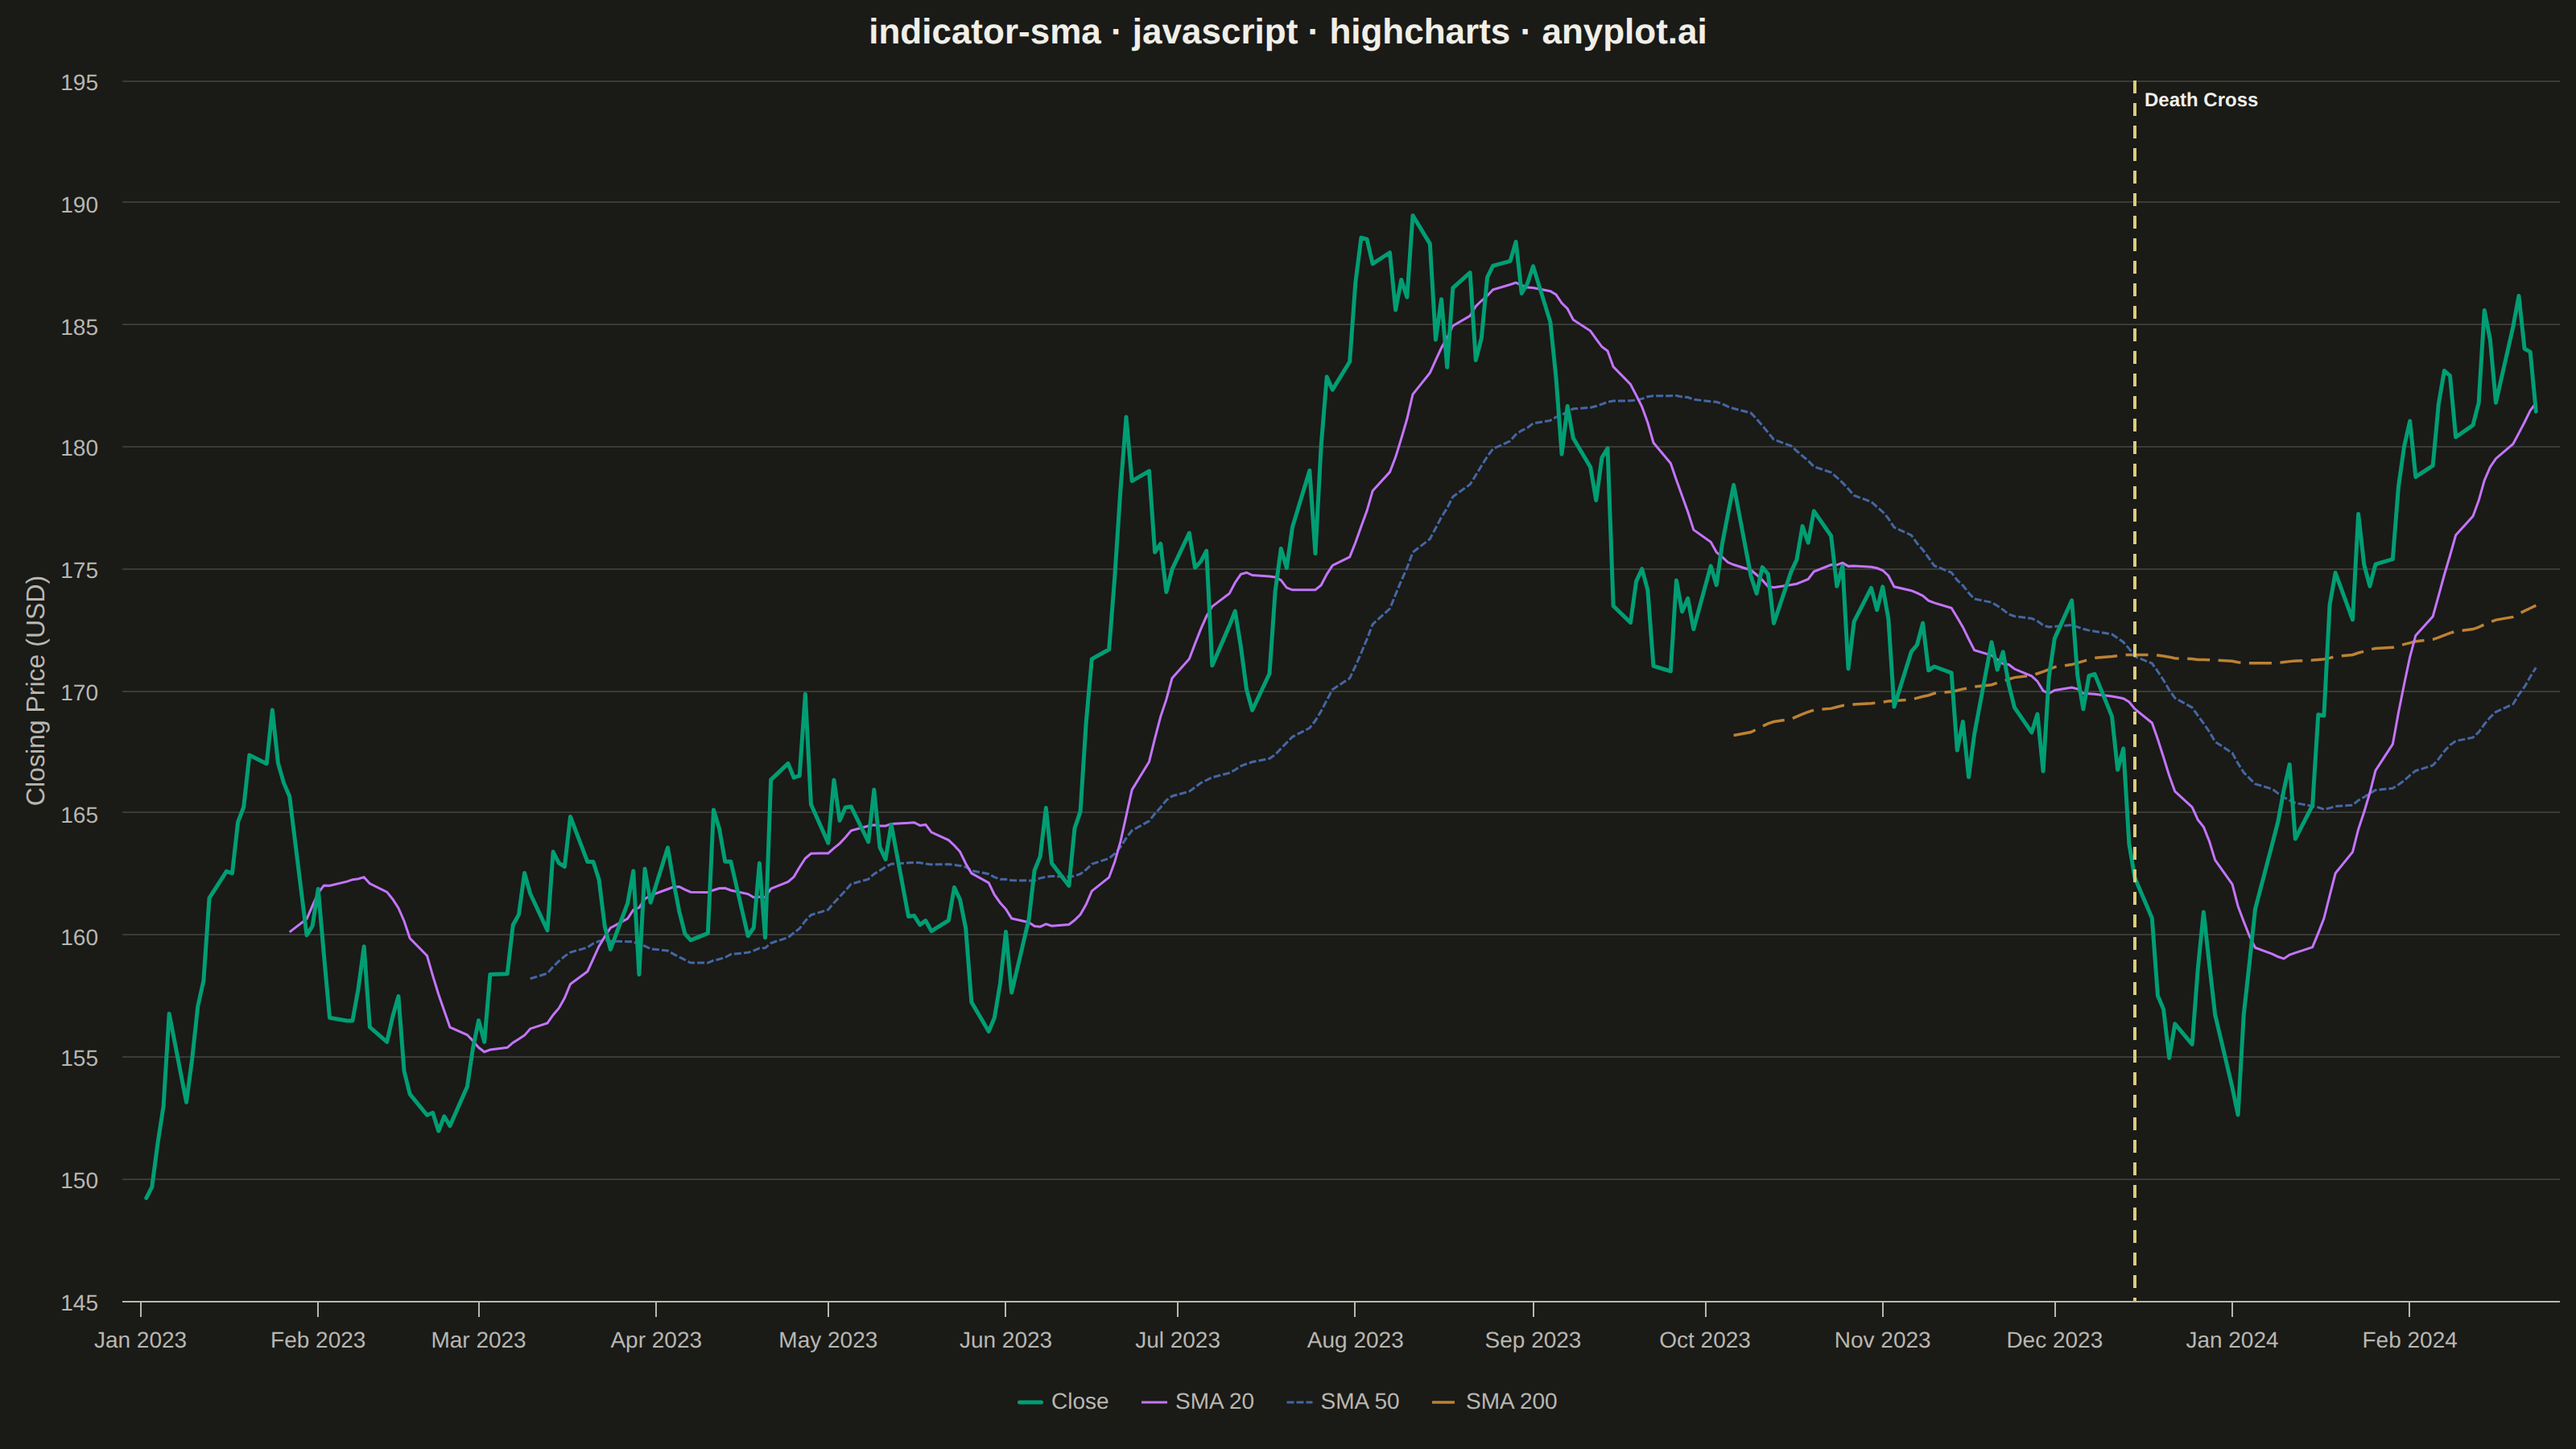
A Simple Moving Average (SMA) chart displays price or value data with one or more SMA overlays, typically showing short, medium, and long-term periods (e.g., 20, 50, 200-day). Each SMA line smooths out price fluctuations by averaging the last N data points, revealing underlying trends at different time scales. This multi-period overlay is fundamental to technical analysis, helping traders identify trend direction, support/resistance levels, and potential crossover signals.
// anyplot.ai
// indicator-sma: Simple Moving Average (SMA) Indicator Chart
// Library: highcharts 12.6.0 | JavaScript 22.23.2
// Quality: 91/100 | Created: 2026-09-02

//# anyplot-orientation: landscape
const t = window.ANYPLOT_TOKENS;

// --- Data (in-memory, deterministic) ---------------------------------------
// Small LCG PRNG (the browser has no seeded RNG) feeding a Box-Muller
// transform, so the daily returns look like real market noise.
let seed = 42;
function lcgRandom() {
  seed = (seed * 1664525 + 1013904223) % 4294967296;
  return seed / 4294967296;
}
function gaussian() {
  const u1 = 1 - lcgRandom();
  const u2 = lcgRandom();
  return Math.sqrt(-2 * Math.log(u1)) * Math.cos(2 * Math.PI * u2);
}

const PERIODS = 300;
const dates = [];
let cursor = Date.UTC(2023, 0, 2);
while (dates.length < PERIODS) {
  const weekday = new Date(cursor).getUTCDay();
  if (weekday !== 0 && weekday !== 6) dates.push(cursor);
  cursor += 24 * 3600 * 1000;
}

const DRIFT = 0.0004;
const VOLATILITY = 0.012;
const closes = [];
let price = 148;
for (let i = 0; i < PERIODS; i++) {
  price *= 1 + DRIFT + VOLATILITY * gaussian();
  closes.push(Math.round(price * 100) / 100);
}

function sma(values, windowSize) {
  return values.map((_, i) => {
    if (i < windowSize - 1) return null;
    let sum = 0;
    for (let j = i - windowSize + 1; j <= i; j++) sum += values[j];
    return Math.round((sum / windowSize) * 100) / 100;
  });
}

const sma20 = sma(closes, 20);
const sma50 = sma(closes, 50);
const sma200 = sma(closes, 200);

const closeSeries = dates.map((d, i) => [d, closes[i]]);
const sma20Series = dates.map((d, i) => [d, sma20[i]]);
const sma50Series = dates.map((d, i) => [d, sma50[i]]);
const sma200Series = dates.map((d, i) => [d, sma200[i]]);

// Golden-cross / death-cross detection (SMA 50 vs SMA 200) — the spec's
// headline application. Only real crossovers found in the generated series
// are annotated, so the callout always matches what the lines actually do.
const crossovers = [];
for (let i = 1; i < PERIODS; i++) {
  const prev50 = sma50[i - 1];
  const prev200 = sma200[i - 1];
  const cur50 = sma50[i];
  const cur200 = sma200[i];
  if (prev50 == null || prev200 == null || cur50 == null || cur200 == null) continue;
  if (prev50 <= prev200 && cur50 > cur200) {
    crossovers.push({ date: dates[i], type: "golden", label: "Golden Cross" });
  } else if (prev50 >= prev200 && cur50 < cur200) {
    crossovers.push({ date: dates[i], type: "death", label: "Death Cross" });
  }
}

// --- Chart -----------------------------------------------------------------
Highcharts.chart("container", {
  chart: {
    type: "line",
    backgroundColor: "transparent",
    animation: false,
    style: { fontFamily: "inherit" },
  },
  credits: { enabled: false },
  colors: t.palette,
  title: {
    text: "indicator-sma · javascript · highcharts · anyplot.ai",
    style: { color: t.ink, fontSize: "22px", fontWeight: "600" },
  },
  xAxis: {
    type: "datetime",
    lineColor: t.inkSoft,
    tickColor: t.inkSoft,
    labels: { style: { color: t.inkSoft, fontSize: "14px" } },
    crosshair: { color: t.grid, dashStyle: "Dash" },
    // Distinctive Highcharts feature: declarative plotLines spotlight the
    // real golden-cross / death-cross moments found in the data above.
    plotLines: crossovers.map((c) => ({
      value: c.date,
      color: c.type === "golden" ? t.palette[0] : t.amber,
      dashStyle: "Dash",
      width: 2,
      zIndex: 5,
      label: {
        text: c.label,
        rotation: 0,
        y: 16,
        x: 6,
        style: { color: t.ink, fontSize: "12px", fontWeight: "600" },
      },
    })),
  },
  yAxis: {
    title: {
      text: "Closing Price (USD)",
      style: { color: t.inkSoft, fontSize: "16px" },
    },
    gridLineColor: t.grid,
    labels: { style: { color: t.inkSoft, fontSize: "14px" } },
  },
  legend: {
    itemStyle: { color: t.inkSoft, fontSize: "14px" },
    itemHoverStyle: { color: t.ink },
    margin: 14,
  },
  tooltip: {
    shared: true,
    // Distinctive Highcharts feature: custom formatter reports each SMA's
    // delta versus the Close price, not just the raw line values.
    formatter: function () {
      const closePoint = this.points.find((p) => p.series.name === "Close");
      const lines = [`<b>${Highcharts.dateFormat("%b %e, %Y", this.x)}</b>`];
      this.points.forEach((p) => {
        let delta = "";
        if (closePoint && p.series.name !== "Close") {
          const deltaPct = ((closePoint.y - p.y) / p.y) * 100;
          delta = ` <span style="color:${t.inkSoft}">(${deltaPct >= 0 ? "+" : ""}${deltaPct.toFixed(1)}% vs Close)</span>`;
        }
        lines.push(`<span style="color:${p.color}">●</span> ${p.series.name}: <b>$${p.y.toFixed(2)}</b>${delta}`);
      });
      return lines.join("<br/>");
    },
  },
  plotOptions: {
    series: { animation: false, marker: { enabled: false } },
  },
  series: [
    { name: "Close", data: closeSeries, lineWidth: 2.5, color: t.palette[0], zIndex: 4 },
    { name: "SMA 20", data: sma20Series, lineWidth: 1.5, dashStyle: "Solid", color: t.palette[1], zIndex: 3 },
    { name: "SMA 50", data: sma50Series, lineWidth: 1.5, dashStyle: "ShortDash", color: t.palette[2], zIndex: 2 },
    { name: "SMA 200", data: sma200Series, lineWidth: 1.75, dashStyle: "LongDash", color: t.palette[3], zIndex: 1 },
  ],
});
Runnable source as JSON, for any HTTP client: https://api.anyplot.ai/specs/indicator-sma/highcharts/code. Any spec id and library id listed in llms-full.txt fit the same URL shape; every URL below is complete and callable.
{
  "spec_id": "indicator-sma",
  "language": "javascript",
  "library": "highcharts",
  "page": "https://anyplot.ai/indicator-sma/javascript/highcharts",
  "hub": "https://anyplot.ai/indicator-sma",
  "code_json": "https://api.anyplot.ai/specs/indicator-sma/highcharts/code",
  "spec_json": "https://api.anyplot.ai/specs/indicator-sma",
  "render_light_png": "https://storage.googleapis.com/anyplot-images/plots/indicator-sma/javascript/highcharts/plot-light.png",
  "render_dark_png": "https://storage.googleapis.com/anyplot-images/plots/indicator-sma/javascript/highcharts/plot-dark.png",
  "interactive_light_html": "https://storage.googleapis.com/anyplot-images/plots/indicator-sma/javascript/highcharts/plot-light.html",
  "interactive_dark_html": "https://storage.googleapis.com/anyplot-images/plots/indicator-sma/javascript/highcharts/plot-dark.html",
  "quality_score": 91.0,
  "license": "MIT",
  "guide": "https://anyplot.ai/llms.txt"
}
Part of Simple Moving Average (SMA) Indicator Chart on anyplot.ai.