The same plot in 14 other libraries — JavaScript: Chart.js, D3.js, Apache ECharts, Highcharts; Python: Altair, Bokeh, lets-plot, Matplotlib, Plotly, plotnine, Pygal, Seaborn; R: ggplot2; Julia: Makie.jl. Compare all 15 side by side: Simple Moving Average (SMA) Indicator Chart in Python, R, Julia and JavaScript.
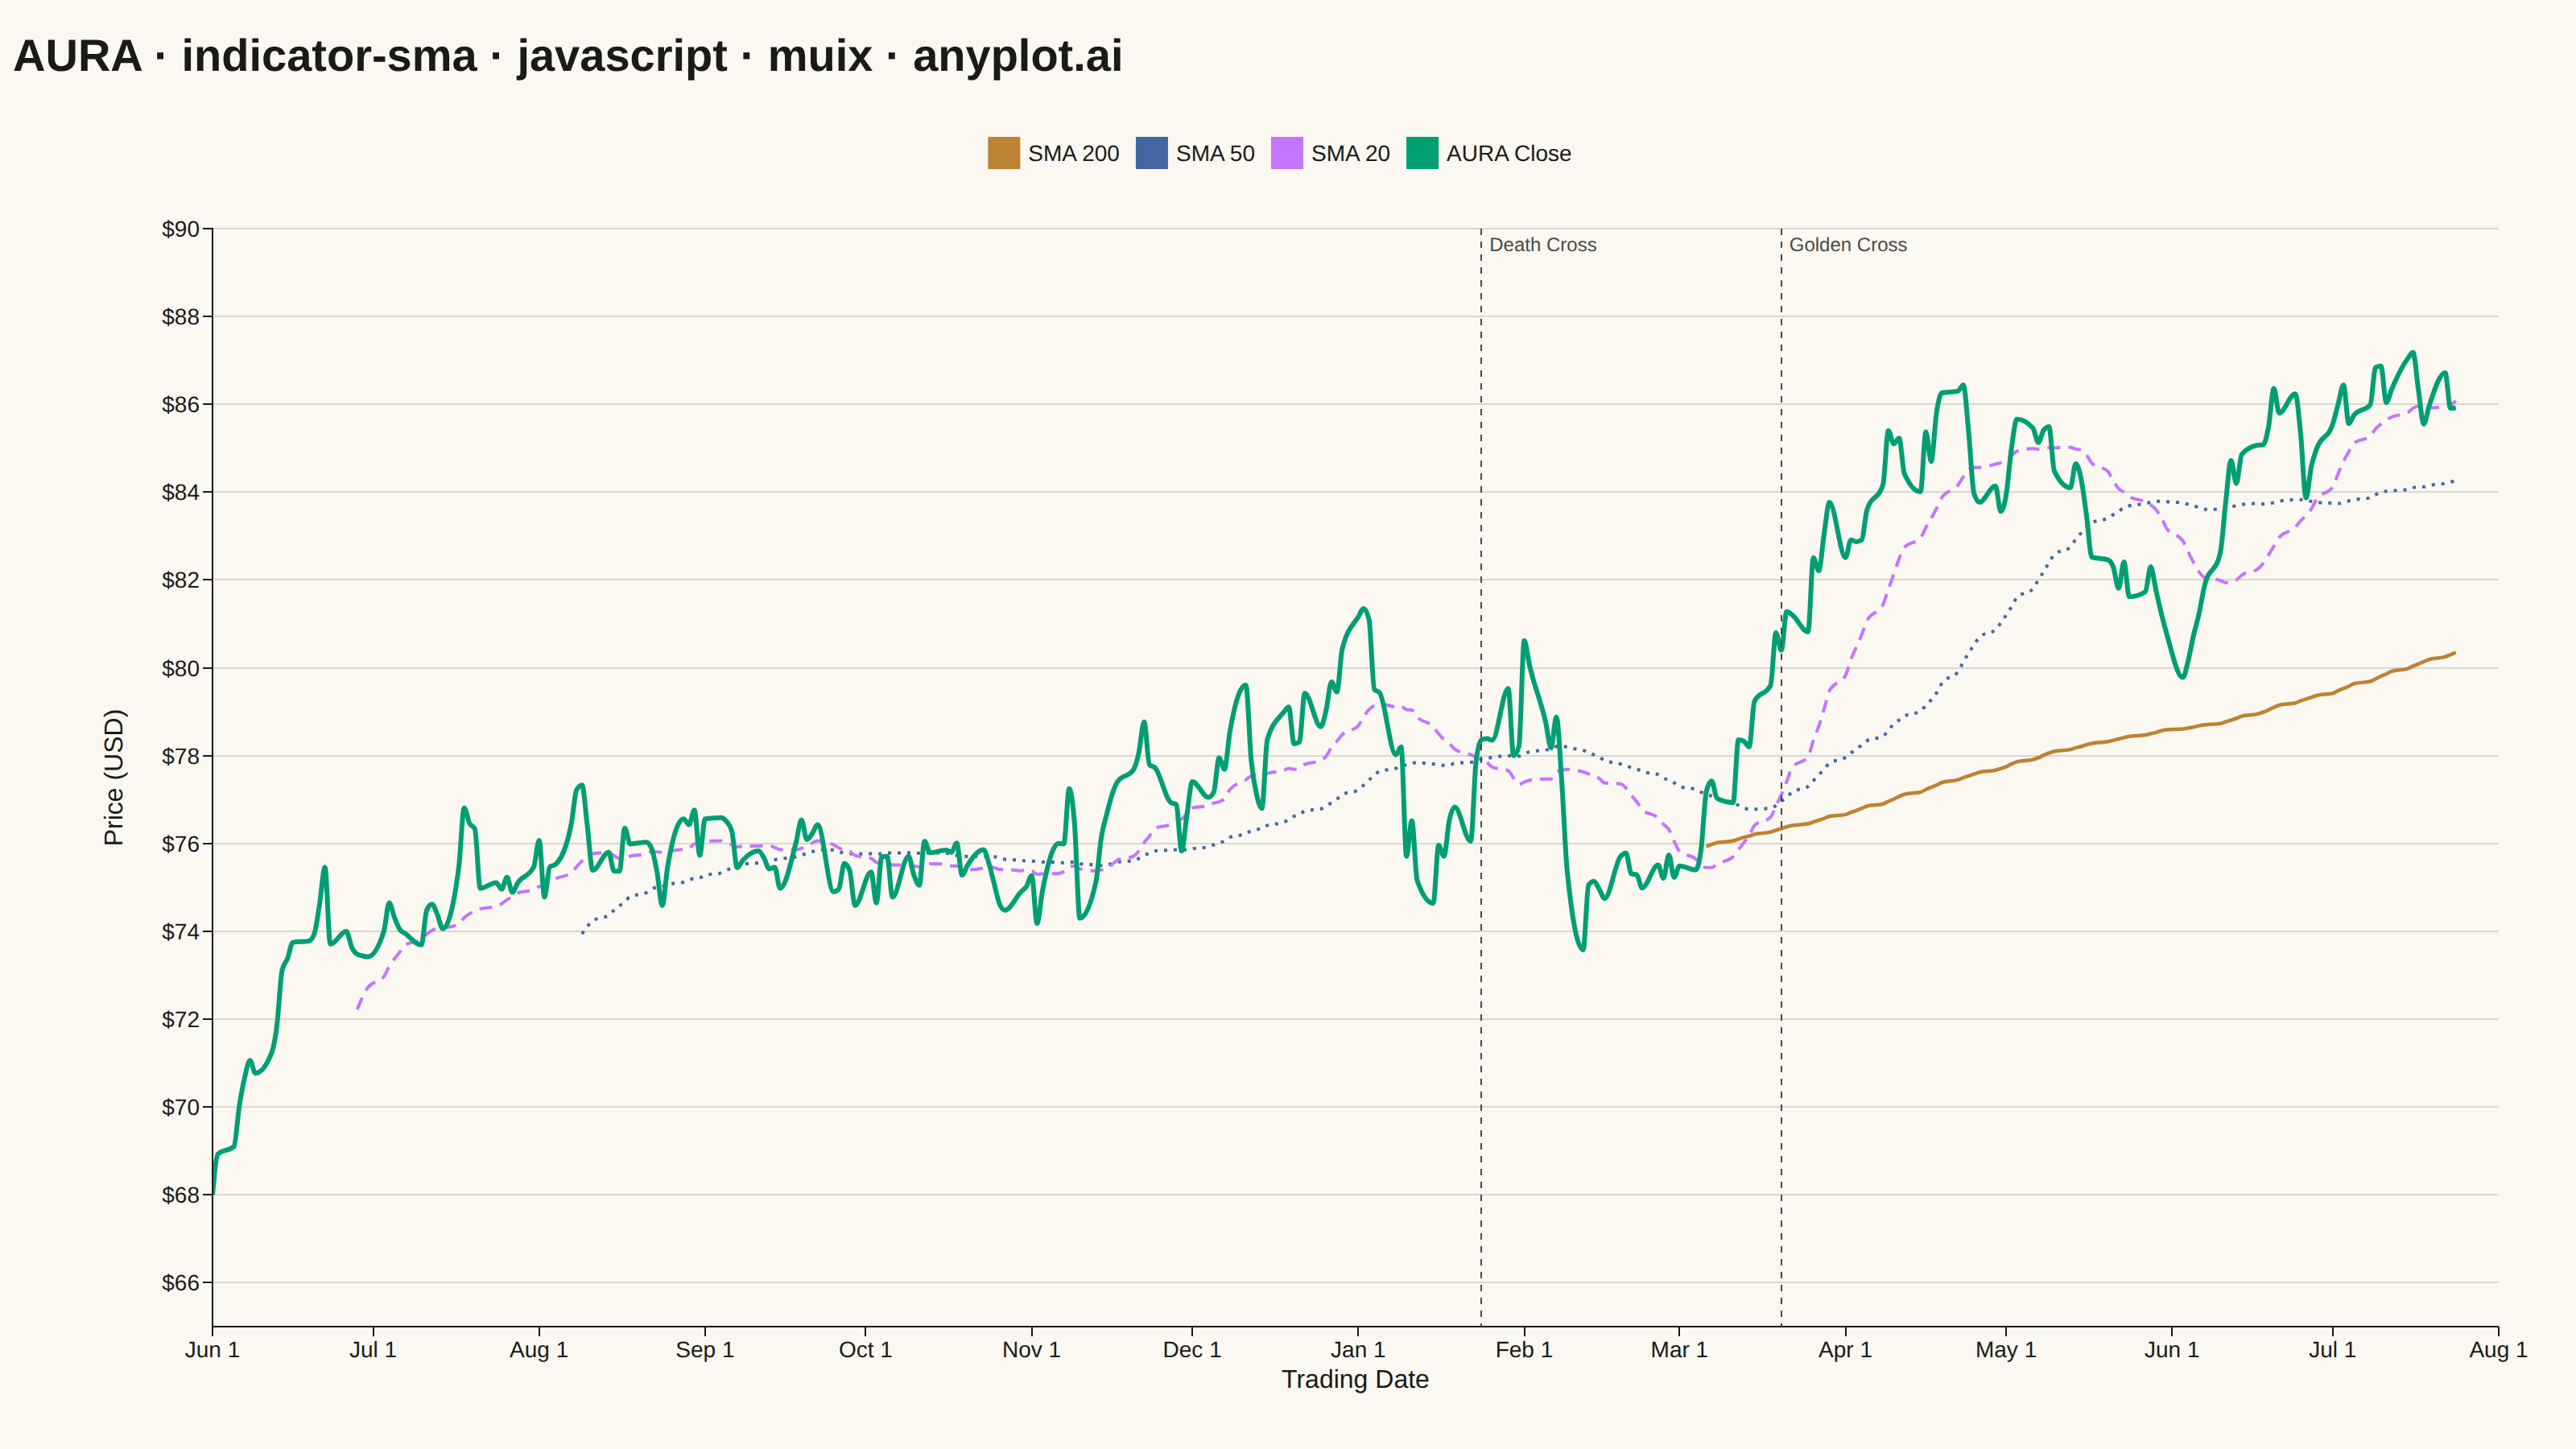
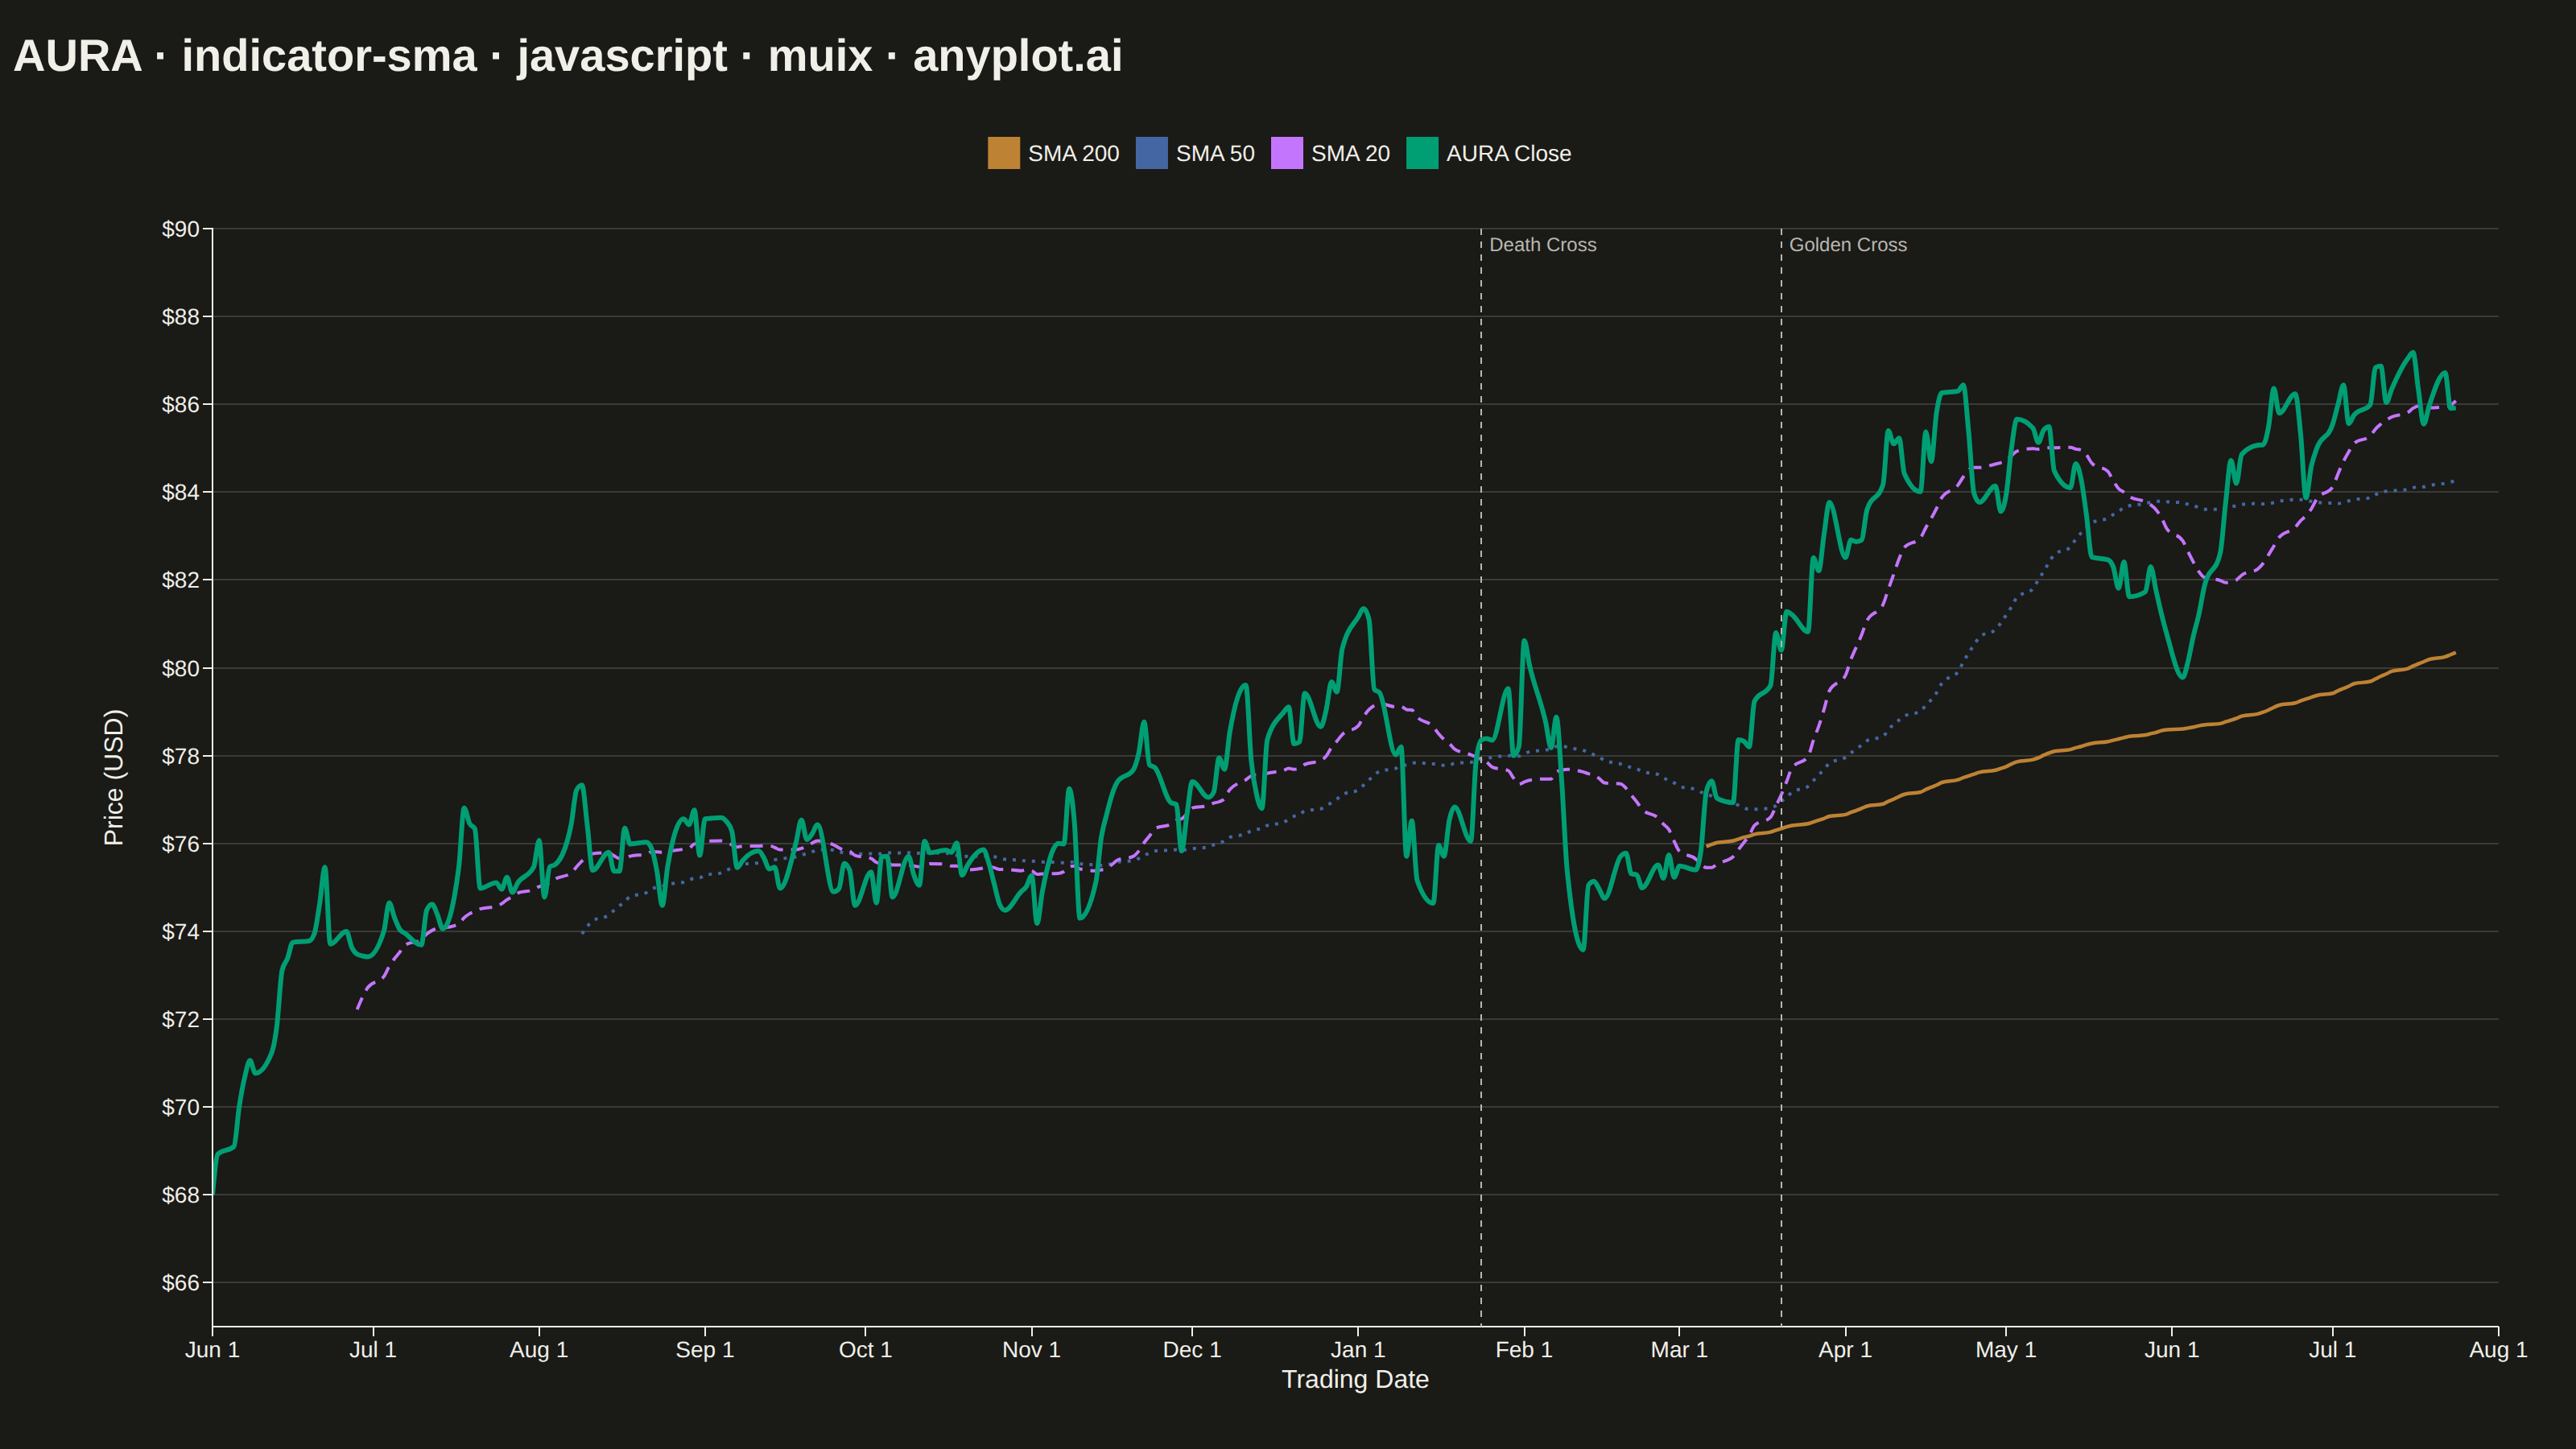
A Simple Moving Average (SMA) chart displays price or value data with one or more SMA overlays, typically showing short, medium, and long-term periods (e.g., 20, 50, 200-day). Each SMA line smooths out price fluctuations by averaging the last N data points, revealing underlying trends at different time scales. This multi-period overlay is fundamental to technical analysis, helping traders identify trend direction, support/resistance levels, and potential crossover signals.
// anyplot.ai
// indicator-sma: Simple Moving Average (SMA) Indicator Chart
// Library: muix 7.29.1 | JavaScript 22.23.2
// Quality: 92/100 | Created: 2026-09-02
import { LineChart } from "@mui/x-charts/LineChart";
import { ChartsReferenceLine } from "@mui/x-charts/ChartsReferenceLine";
import { Box, Typography } from "@mui/material";

const t = window.ANYPLOT_TOKENS;
const [BRAND, SHORT_COLOR, MEDIUM_COLOR, LONG_COLOR] = t.palette;

// --- Data (in-memory, deterministic) ----------------------------------------
const SYMBOL = "AURA";
const N = 300;
const WINDOW_SHORT = 20;
const WINDOW_MEDIUM = 50;
const WINDOW_LONG = 200;
const START_PRICE = 68;

// Fixed-seed LCG (Numerical Recipes constants) — the browser has no seeded RNG.
let seed = 42;
const rand = () => {
  seed = (seed * 1664525 + 1013904223) % 4294967296;
  return seed / 4294967296;
};
const gaussian = () => {
  const u1 = Math.max(rand(), 1e-9);
  const u2 = rand();
  return Math.sqrt(-2 * Math.log(u1)) * Math.cos(2 * Math.PI * u2);
};

// Trading dates (weekdays only)
const dates = [];
const cursor = new Date(2023, 5, 1);
while (dates.length < N) {
  const day = cursor.getDay();
  if (day !== 0 && day !== 6) dates.push(new Date(cursor));
  cursor.setDate(cursor.getDate() + 1);
}

// Daily close through three regimes — steady uptrend, a choppy pullback
// (death cross), then a recovery uptrend (golden cross) — so the SMA
// crossovers described in the spec's applications are visible.
const PULLBACK_START = 110;
const PULLBACK_END = 190;
const close = [START_PRICE];
for (let i = 1; i < N; i += 1) {
  const pullback = i >= PULLBACK_START && i < PULLBACK_END;
  const driftPct = pullback ? -0.12 : 0.09;
  const dailyVolPct = pullback ? 1.3 : 0.9;
  const changePct = driftPct + dailyVolPct * gaussian();
  close.push(Math.max(10, close[i - 1] * (1 + changePct / 100)));
}

const round2 = (v) => Math.round(v * 100) / 100;

const sma = (data, window) =>
  data.map((_, i) => {
    if (i < window - 1) return null;
    const windowSlice = data.slice(i - window + 1, i + 1);
    return round2(windowSlice.reduce((sum, v) => sum + v, 0) / window);
  });

const smaShort = sma(close, WINDOW_SHORT);
const smaMedium = sma(close, WINDOW_MEDIUM);
const smaLong = sma(close, WINDOW_LONG);
const closeRounded = close.map(round2);

// Detect 20/50-day SMA crossovers so the chart can call out the death-cross /
// golden-cross moments described in the spec's Applications section. Only the
// crossovers that actually confirm each regime change (the first death cross
// once the pullback starts, the first golden cross once the recovery starts)
// are annotated, keeping the markers tied to the story instead of every
// short-term wiggle.
const crossovers = [];
for (let i = 1; i < N; i += 1) {
  if (smaShort[i - 1] === null || smaMedium[i - 1] === null) continue;
  if (smaShort[i] === null || smaMedium[i] === null) continue;
  const prevDiff = smaShort[i - 1] - smaMedium[i - 1];
  const diff = smaShort[i] - smaMedium[i];
  if (prevDiff === 0 || Math.sign(prevDiff) === Math.sign(diff)) continue;
  crossovers.push({ index: i, date: dates[i], golden: diff > 0 });
}
const deathCross = crossovers.find((c) => c.index >= PULLBACK_START && !c.golden);
const goldenCross = crossovers.find((c) => c.index >= PULLBACK_END && c.golden);
const signals = [deathCross, goldenCross]
  .filter(Boolean)
  .map((c) => ({ date: c.date, label: c.golden ? "Golden Cross" : "Death Cross" }));

// Explicit y-axis bounds so the four overlapping lines use the full canvas.
const allValues = [...closeRounded, ...smaShort, ...smaMedium, ...smaLong].filter(
  (v) => v !== null,
);
const dataMin = Math.min(...allValues);
const dataMax = Math.max(...allValues);
const axisPadding = (dataMax - dataMin) * 0.1;
const yMin = Math.floor((dataMin - axisPadding) / 5) * 5;
const yMax = Math.ceil((dataMax + axisPadding) / 5) * 5;

const TITLE = `${SYMBOL} · indicator-sma · javascript · muix · anyplot.ai`;

// --- Chart (default-exported component — the harness mounts it) -------------
export default function Chart() {
  const { width, height } = window.ANYPLOT_SIZE;
  const titleHeight = 70;

  return (
    <Box sx={{ width, height, display: "flex", flexDirection: "column" }}>
      <Typography
        color="text.primary"
        sx={{
          height: titleHeight,
          lineHeight: `${titleHeight}px`,
          pl: 1,
          fontSize: 28,
          fontWeight: 700,
        }}
      >
        {TITLE}
      </Typography>
      <LineChart
        width={width}
        height={height - titleHeight}
        skipAnimation
        margin={{ top: 72, right: 48, bottom: 76, left: 132 }}
        xAxis={[
          {
            data: dates,
            scaleType: "time",
            label: "Trading Date",
            labelStyle: { fontSize: 16 },
            tickLabelStyle: { fontSize: 14 },
            valueFormatter: (date) =>
              date.toLocaleDateString("en-US", {
                month: "short",
                day: "numeric",
              }),
          },
        ]}
        yAxis={[
          {
            label: "Price (USD)",
            labelStyle: { fontSize: 16 },
            tickFontSize: 40,
            tickLabelStyle: { fontSize: 14 },
            valueFormatter: (v) => `$${v.toFixed(0)}`,
            min: yMin,
            max: yMax,
          },
        ]}
        series={[
          {
            id: "smaLong",
            data: smaLong,
            color: LONG_COLOR,
            showMark: false,
            connectNulls: false,
            curve: "monotoneX",
            label: "SMA 200",
          },
          {
            id: "smaMedium",
            data: smaMedium,
            color: MEDIUM_COLOR,
            showMark: false,
            connectNulls: false,
            curve: "monotoneX",
            label: "SMA 50",
          },
          {
            id: "smaShort",
            data: smaShort,
            color: SHORT_COLOR,
            showMark: false,
            connectNulls: false,
            curve: "monotoneX",
            label: "SMA 20",
          },
          {
            id: "close",
            data: closeRounded,
            color: BRAND,
            showMark: false,
            curve: "monotoneX",
            label: `${SYMBOL} Close`,
          },
        ]}
        grid={{ horizontal: true }}
        slotProps={{
          legend: {
            direction: "row",
            position: { vertical: "top", horizontal: "middle" },
            labelStyle: { fontSize: 14 },
          },
        }}
        sx={{
          "& .MuiLineElement-root": { strokeWidth: 2 },
          "& .MuiLineElement-series-close": { strokeWidth: 3 },
          "& .MuiLineElement-series-smaShort": {
            strokeWidth: 2,
            strokeDasharray: "8 5",
          },
          "& .MuiLineElement-series-smaMedium": {
            strokeWidth: 2,
            strokeDasharray: "2 4",
          },
          "& .MuiLineElement-series-smaLong": {
            strokeWidth: 2.25,
          },
        }}
      >
        {signals.map((c) => (
          <ChartsReferenceLine
            key={c.date.toISOString()}
            x={c.date}
            label={c.label}
            labelAlign="start"
            lineStyle={{ stroke: t.inkSoft, strokeDasharray: "4 4", strokeWidth: 1 }}
            labelStyle={{ fontSize: 12, fill: t.inkSoft }}
          />
        ))}
      </LineChart>
    </Box>
  );
}
Runnable source as JSON, for any HTTP client: https://api.anyplot.ai/specs/indicator-sma/muix/code. Any spec id and library id listed in llms-full.txt fit the same URL shape; every URL below is complete and callable.
{
  "spec_id": "indicator-sma",
  "language": "javascript",
  "library": "muix",
  "page": "https://anyplot.ai/indicator-sma/javascript/muix",
  "hub": "https://anyplot.ai/indicator-sma",
  "code_json": "https://api.anyplot.ai/specs/indicator-sma/muix/code",
  "spec_json": "https://api.anyplot.ai/specs/indicator-sma",
  "render_light_png": "https://storage.googleapis.com/anyplot-images/plots/indicator-sma/javascript/muix/plot-light.png",
  "render_dark_png": "https://storage.googleapis.com/anyplot-images/plots/indicator-sma/javascript/muix/plot-dark.png",
  "interactive_light_html": "https://storage.googleapis.com/anyplot-images/plots/indicator-sma/javascript/muix/plot-light.html",
  "interactive_dark_html": "https://storage.googleapis.com/anyplot-images/plots/indicator-sma/javascript/muix/plot-dark.html",
  "quality_score": 92.0,
  "license": "MIT",
  "guide": "https://anyplot.ai/llms.txt"
}
Part of Simple Moving Average (SMA) Indicator Chart on anyplot.ai.