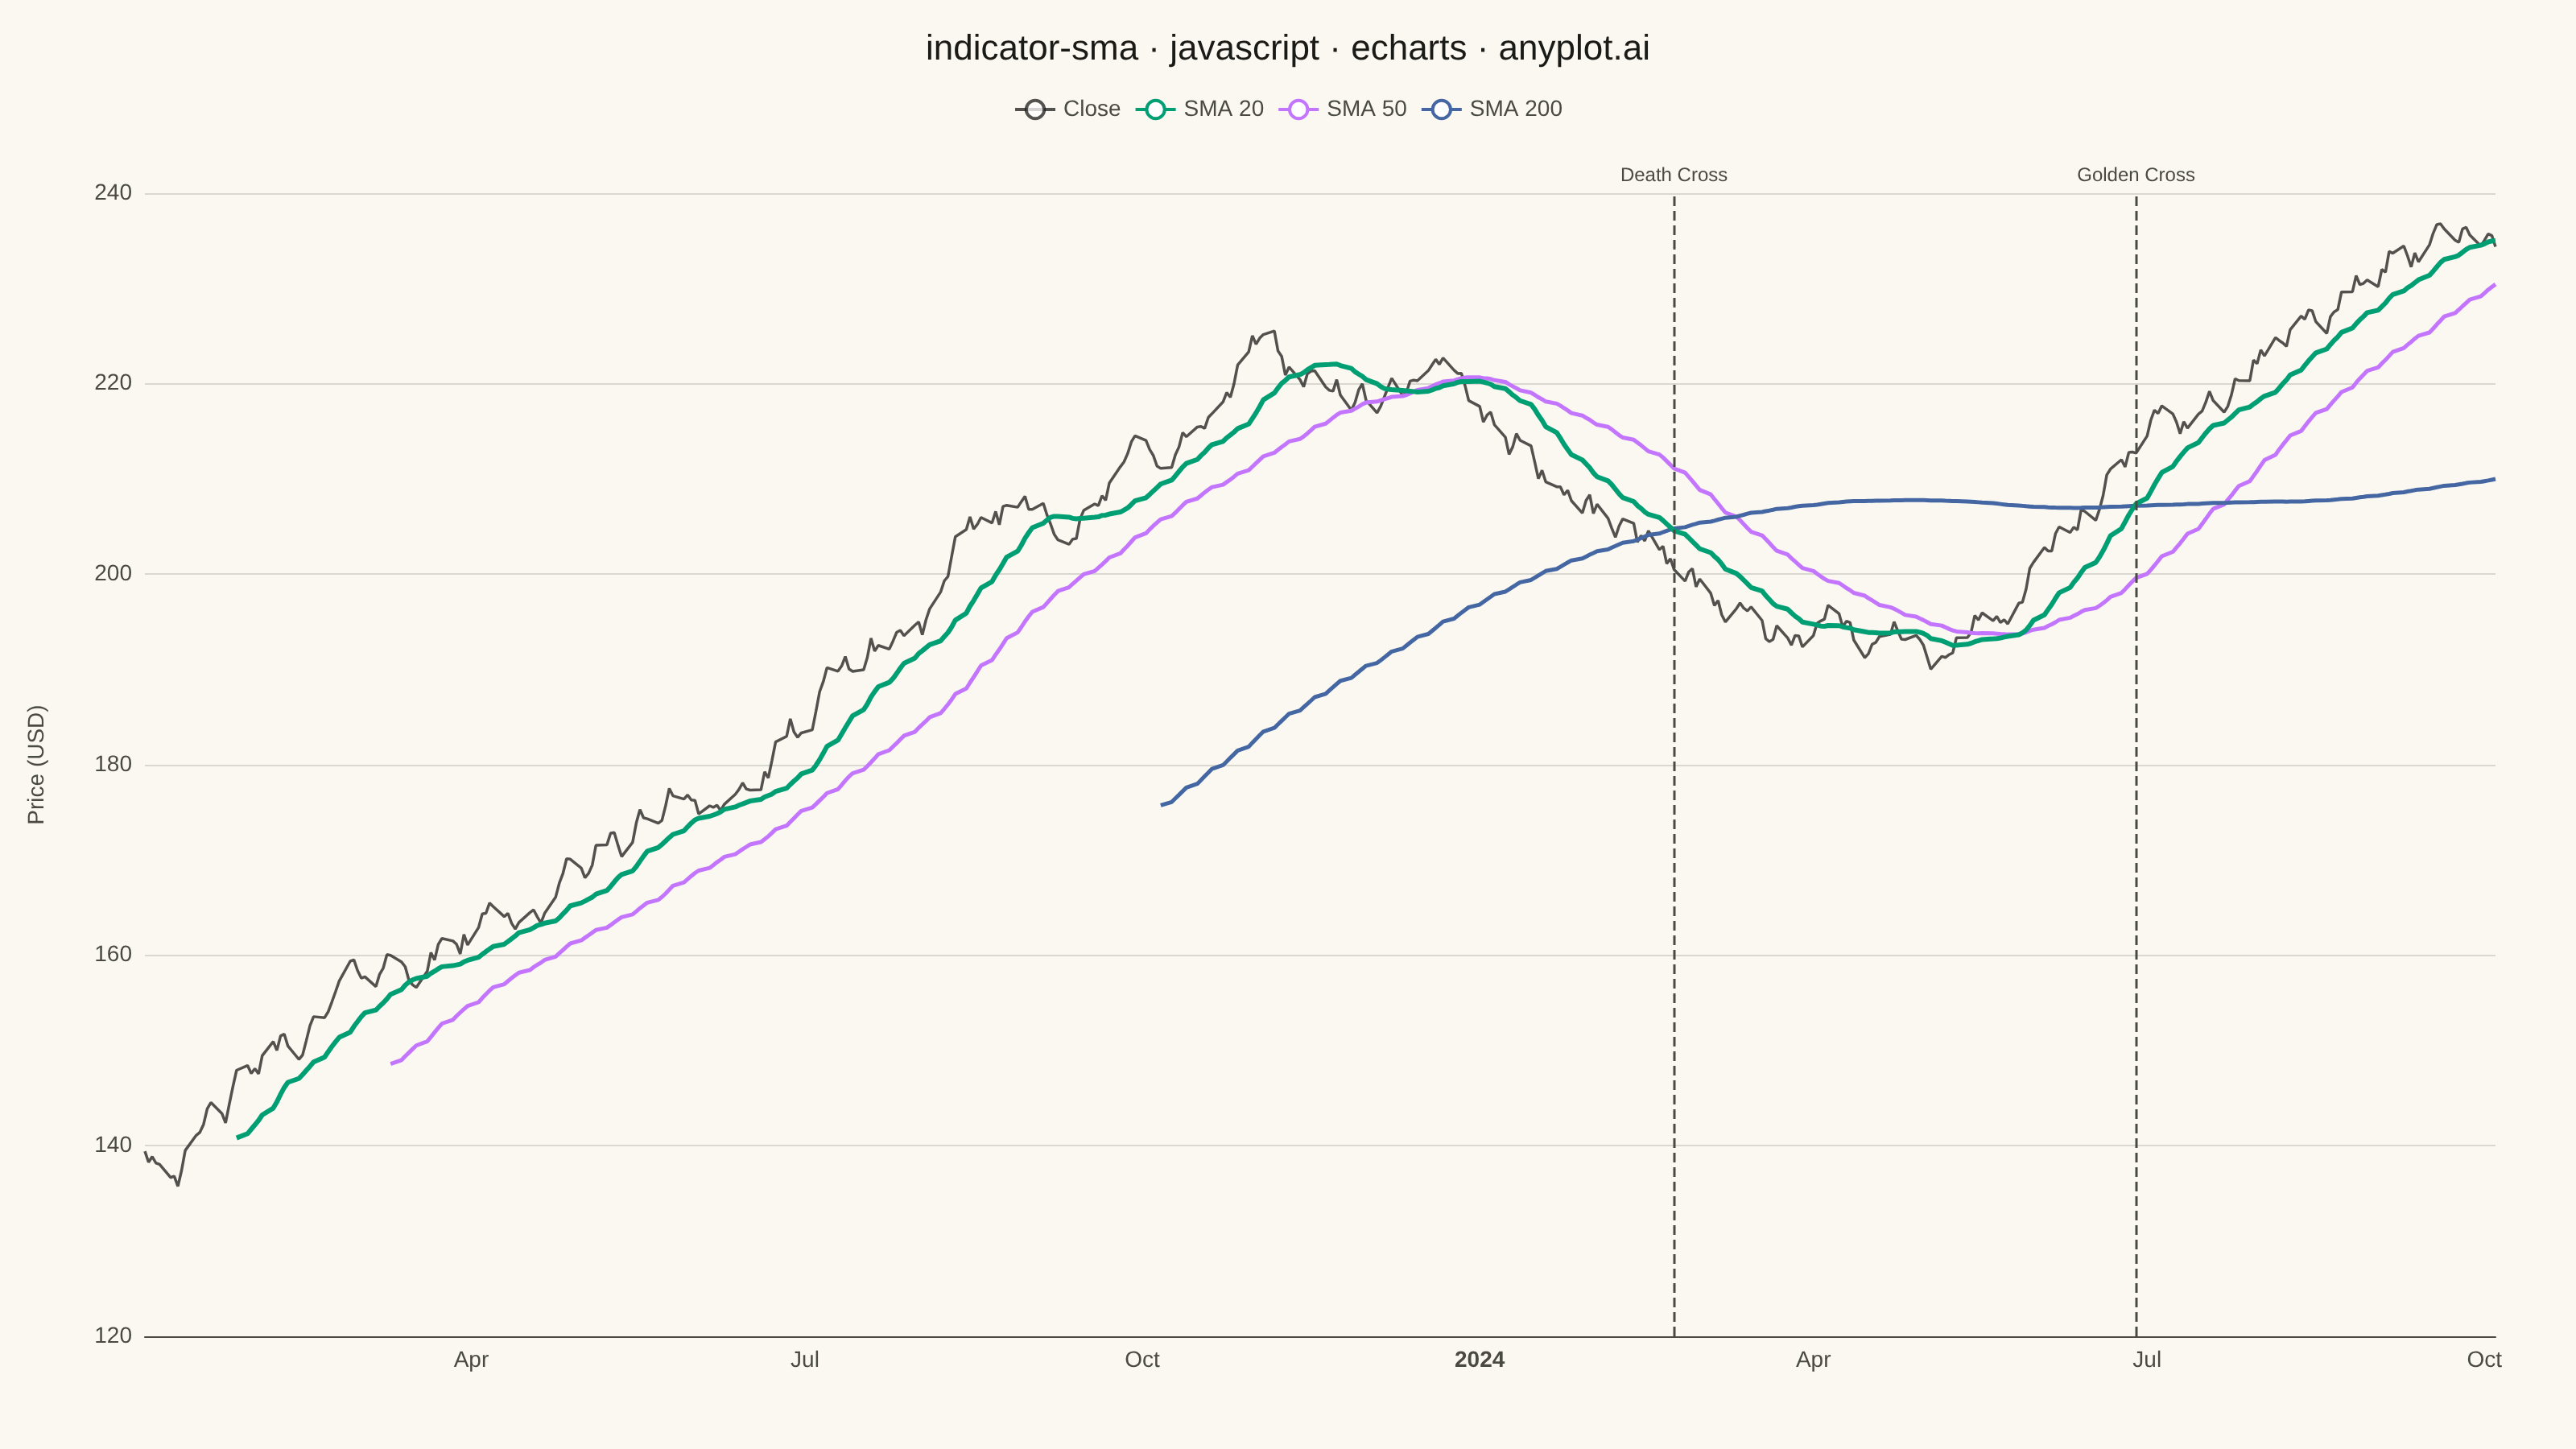
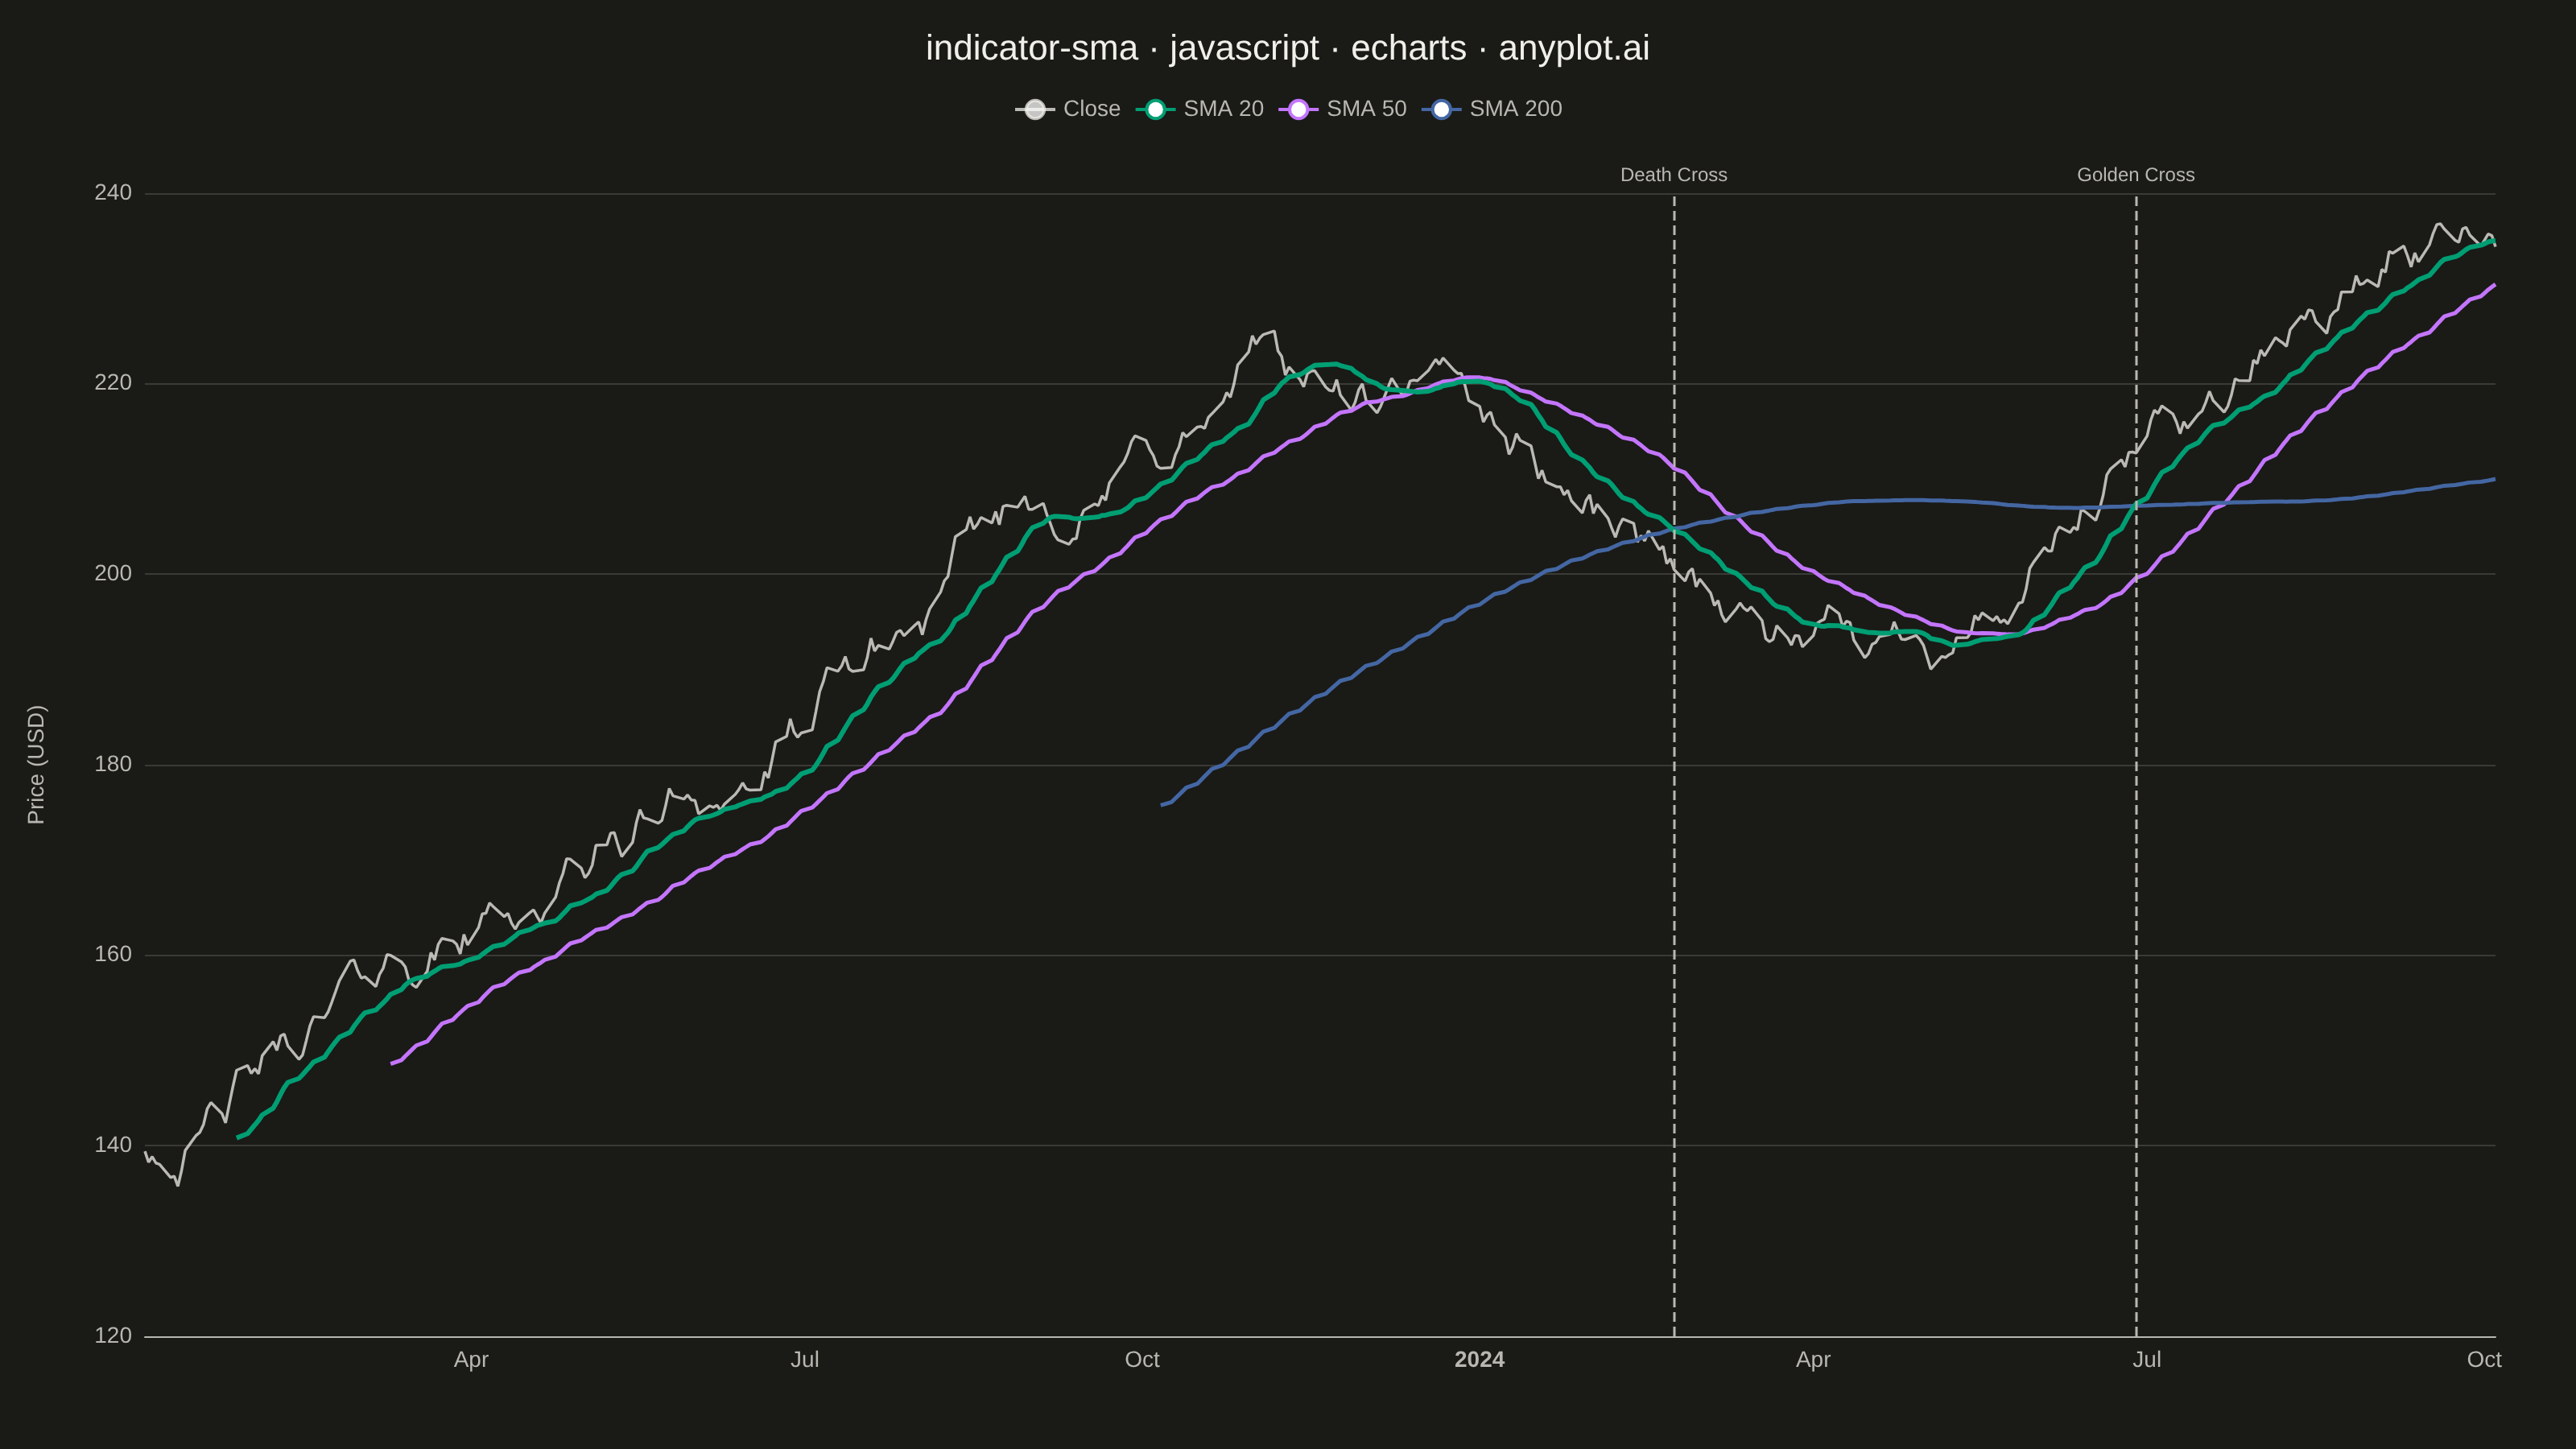
The same plot in 14 other libraries — JavaScript: Chart.js, D3.js, Highcharts, MUI X Charts; Python: Altair, Bokeh, lets-plot, Matplotlib, Plotly, plotnine, Pygal, Seaborn; R: ggplot2; Julia: Makie.jl. Compare all 15 side by side: Simple Moving Average (SMA) Indicator Chart in Python, R, Julia and JavaScript.
A Simple Moving Average (SMA) chart displays price or value data with one or more SMA overlays, typically showing short, medium, and long-term periods (e.g., 20, 50, 200-day). Each SMA line smooths out price fluctuations by averaging the last N data points, revealing underlying trends at different time scales. This multi-period overlay is fundamental to technical analysis, helping traders identify trend direction, support/resistance levels, and potential crossover signals.
// anyplot.ai
// indicator-sma: Simple Moving Average (SMA) Indicator Chart
// Library: echarts 6.1.0 | JavaScript 22.23.2
// Quality: 89/100 | Created: 2026-09-02

const t = window.ANYPLOT_TOKENS;

// --- Data (in-memory, deterministic) ----------------------------------------
function lcg(seed) {
  let state = seed;
  return () => {
    state = (state * 1664525 + 1013904223) % 4294967296;
    return state / 4294967296;
  };
}
const rand = lcg(42);

const numPeriods = 460; // ~1.8 trading years of business days
const dates = [];
const cursor = new Date("2023-01-02T00:00:00Z");
while (dates.length < numPeriods) {
  const day = cursor.getUTCDay();
  if (day !== 0 && day !== 6) dates.push(new Date(cursor));
  cursor.setUTCDate(cursor.getUTCDate() + 1);
}

// Three regimes so the SMAs actually cross: a steady climb (SMA200 builds
// history), a sustained slide (death cross: fast SMAs fall below SMA200),
// then a recovery rally (golden cross: fast SMAs climb back above SMA200).
let price = 140;
const close = dates.map((_, i) => {
  let drift;
  if (i < 220) drift = 0.32; // climb
  else if (i < 340) drift = -0.34; // slide
  else drift = 0.4; // recovery rally
  const noise = (rand() - 0.5) * 3.6;
  price = Math.max(30, price + drift + noise);
  return Number(price.toFixed(2));
});

function sma(values, window) {
  return values.map((_, i) => {
    if (i < window - 1) return null;
    let sum = 0;
    for (let j = i - window + 1; j <= i; j++) sum += values[j];
    return Number((sum / window).toFixed(2));
  });
}

const smaShort = sma(close, 20);
const smaMedium = sma(close, 50);
const smaLong = sma(close, 200);

const toSeries = (values) => dates.map((date, i) => [date.getTime(), values[i]]);
const closeSeries = toSeries(close);
const smaShortSeries = toSeries(smaShort);
const smaMediumSeries = toSeries(smaMedium);
const smaLongSeries = toSeries(smaLong);

// Flag SMA20/SMA200 crossovers (golden cross = short overtakes long) to
// annotate with a markLine — an ECharts-distinctive touch that also makes
// the crossover behavior the spec calls out easy to read at a glance.
const crossovers = [];
for (let i = 1; i < dates.length; i++) {
  if (smaShort[i - 1] === null || smaLong[i - 1] === null || smaShort[i] === null || smaLong[i] === null) continue;
  const prevDiff = smaShort[i - 1] - smaLong[i - 1];
  const currDiff = smaShort[i] - smaLong[i];
  if (prevDiff <= 0 && currDiff > 0) {
    crossovers.push({ time: dates[i].getTime(), label: "Golden Cross" });
  } else if (prevDiff >= 0 && currDiff < 0) {
    crossovers.push({ time: dates[i].getTime(), label: "Death Cross" });
  }
}

// --- Init --------------------------------------------------------------------
const chart = echarts.init(document.getElementById("container"));

// --- Option --------------------------------------------------------------------
chart.setOption({
  animation: false,
  backgroundColor: "transparent",
  color: t.palette,
  title: {
    text: "indicator-sma · javascript · echarts · anyplot.ai",
    left: "center",
    textStyle: { color: t.ink, fontSize: 22, fontWeight: 500 },
  },
  legend: {
    data: ["Close", "SMA 20", "SMA 50", "SMA 200"],
    top: 56,
    textStyle: { color: t.inkSoft, fontSize: 14 },
  },
  tooltip: { trigger: "axis" },
  grid: { left: 90, right: 50, top: 120, bottom: 70 },
  xAxis: {
    type: "time",
    axisLabel: { color: t.inkSoft, fontSize: 14 },
    axisLine: { lineStyle: { color: t.inkSoft } },
    axisTick: { show: false },
    splitLine: { show: false },
  },
  yAxis: {
    type: "value",
    scale: true,
    name: "Price (USD)",
    nameLocation: "middle",
    nameGap: 60,
    nameTextStyle: { color: t.inkSoft, fontSize: 14 },
    axisLabel: { color: t.inkSoft, fontSize: 14 },
    axisLine: { show: false },
    axisTick: { show: false },
    splitLine: { lineStyle: { color: t.grid } },
  },
  series: [
    {
      name: "Close",
      type: "line",
      data: closeSeries,
      showSymbol: false,
      lineStyle: { color: t.ink, width: 1.75, opacity: 0.75 },
      itemStyle: { color: t.ink, opacity: 0.75 },
      z: 1,
    },
    {
      name: "SMA 20",
      type: "line",
      data: smaShortSeries,
      showSymbol: false,
      connectNulls: false,
      lineStyle: { color: t.palette[0], width: 3 },
      itemStyle: { color: t.palette[0] },
      z: 3,
      markLine: {
        symbol: "none",
        animation: false,
        label: { color: t.inkSoft, fontSize: 12, formatter: "{b}" },
        lineStyle: { color: t.inkSoft, type: "dashed", width: 1.5 },
        data: crossovers.map((c) => ({ name: c.label, xAxis: c.time })),
      },
    },
    {
      name: "SMA 50",
      type: "line",
      data: smaMediumSeries,
      showSymbol: false,
      connectNulls: false,
      lineStyle: { color: t.palette[1], width: 2.5 },
      itemStyle: { color: t.palette[1] },
      z: 2,
    },
    {
      name: "SMA 200",
      type: "line",
      data: smaLongSeries,
      showSymbol: false,
      connectNulls: false,
      lineStyle: { color: t.palette[2], width: 2.5 },
      itemStyle: { color: t.palette[2] },
      z: 2,
    },
  ],
});
Runnable source as JSON, for any HTTP client: https://api.anyplot.ai/specs/indicator-sma/echarts/code. Any spec id and library id listed in llms-full.txt fit the same URL shape; every URL below is complete and callable.
{
  "spec_id": "indicator-sma",
  "language": "javascript",
  "library": "echarts",
  "page": "https://anyplot.ai/indicator-sma/javascript/echarts",
  "hub": "https://anyplot.ai/indicator-sma",
  "code_json": "https://api.anyplot.ai/specs/indicator-sma/echarts/code",
  "spec_json": "https://api.anyplot.ai/specs/indicator-sma",
  "render_light_png": "https://storage.googleapis.com/anyplot-images/plots/indicator-sma/javascript/echarts/plot-light.png",
  "render_dark_png": "https://storage.googleapis.com/anyplot-images/plots/indicator-sma/javascript/echarts/plot-dark.png",
  "interactive_light_html": "https://storage.googleapis.com/anyplot-images/plots/indicator-sma/javascript/echarts/plot-light.html",
  "interactive_dark_html": "https://storage.googleapis.com/anyplot-images/plots/indicator-sma/javascript/echarts/plot-dark.html",
  "quality_score": 89.0,
  "license": "MIT",
  "guide": "https://anyplot.ai/llms.txt"
}
Part of Simple Moving Average (SMA) Indicator Chart on anyplot.ai.