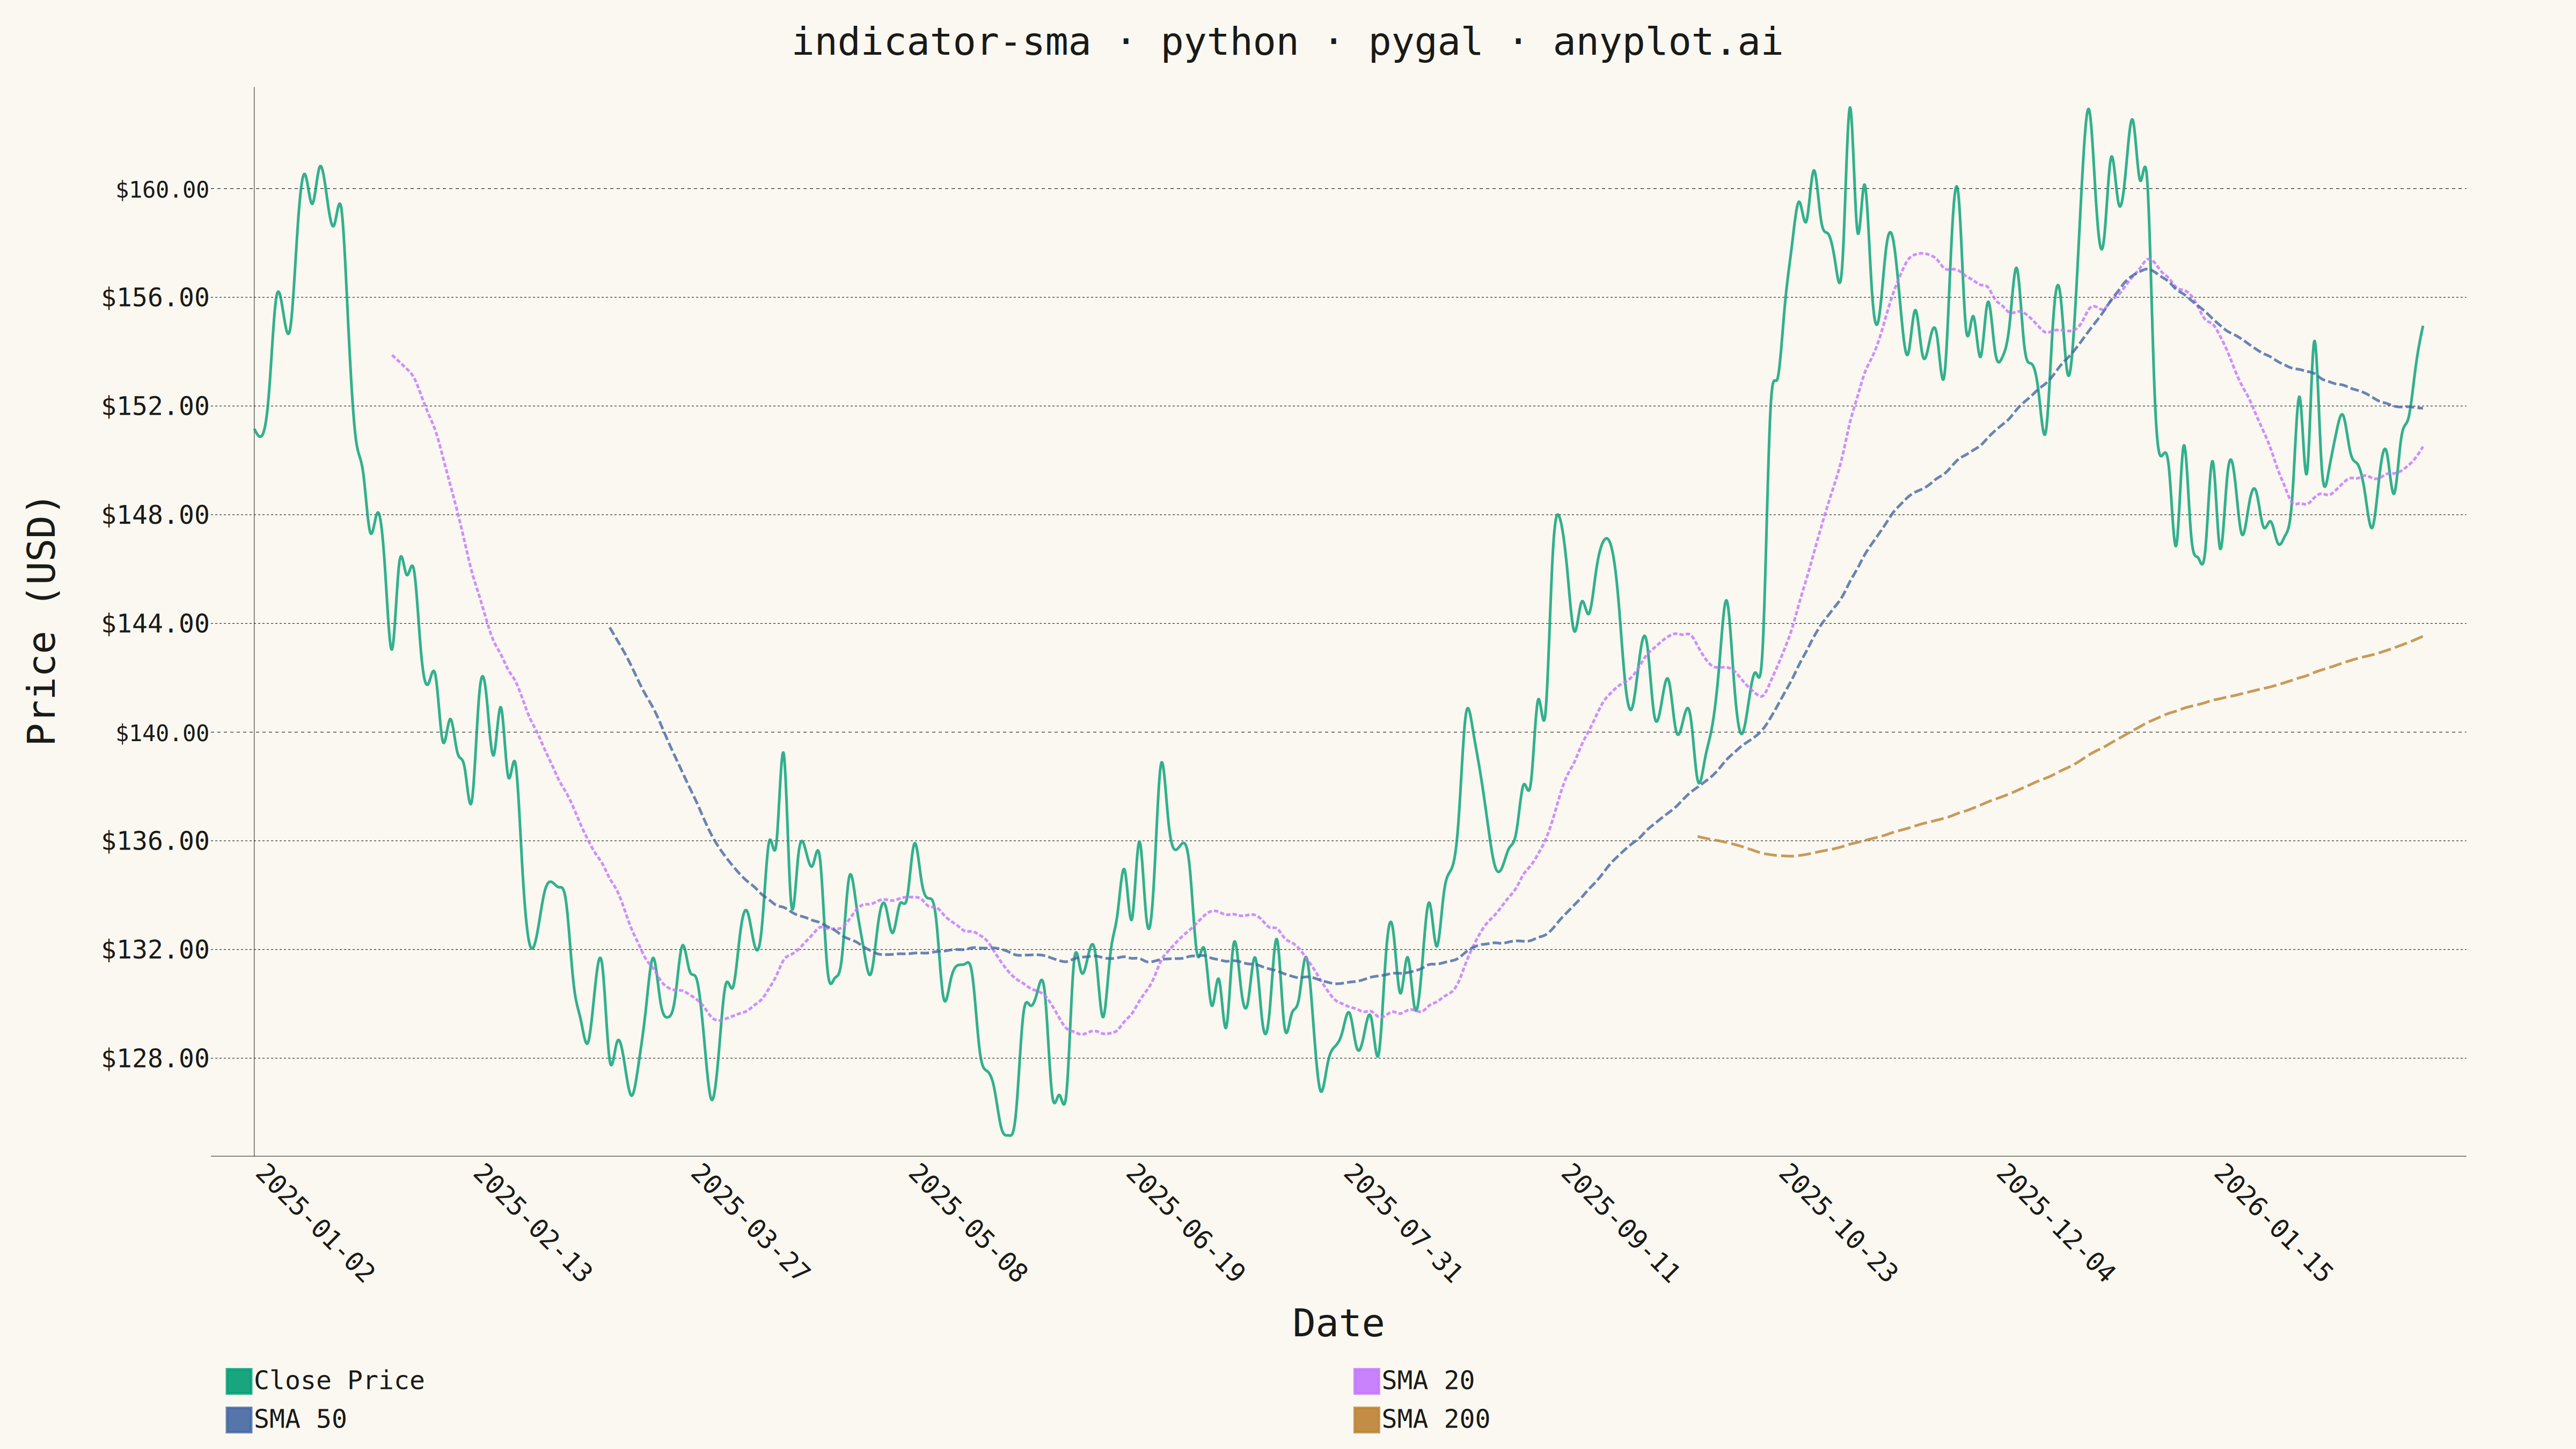
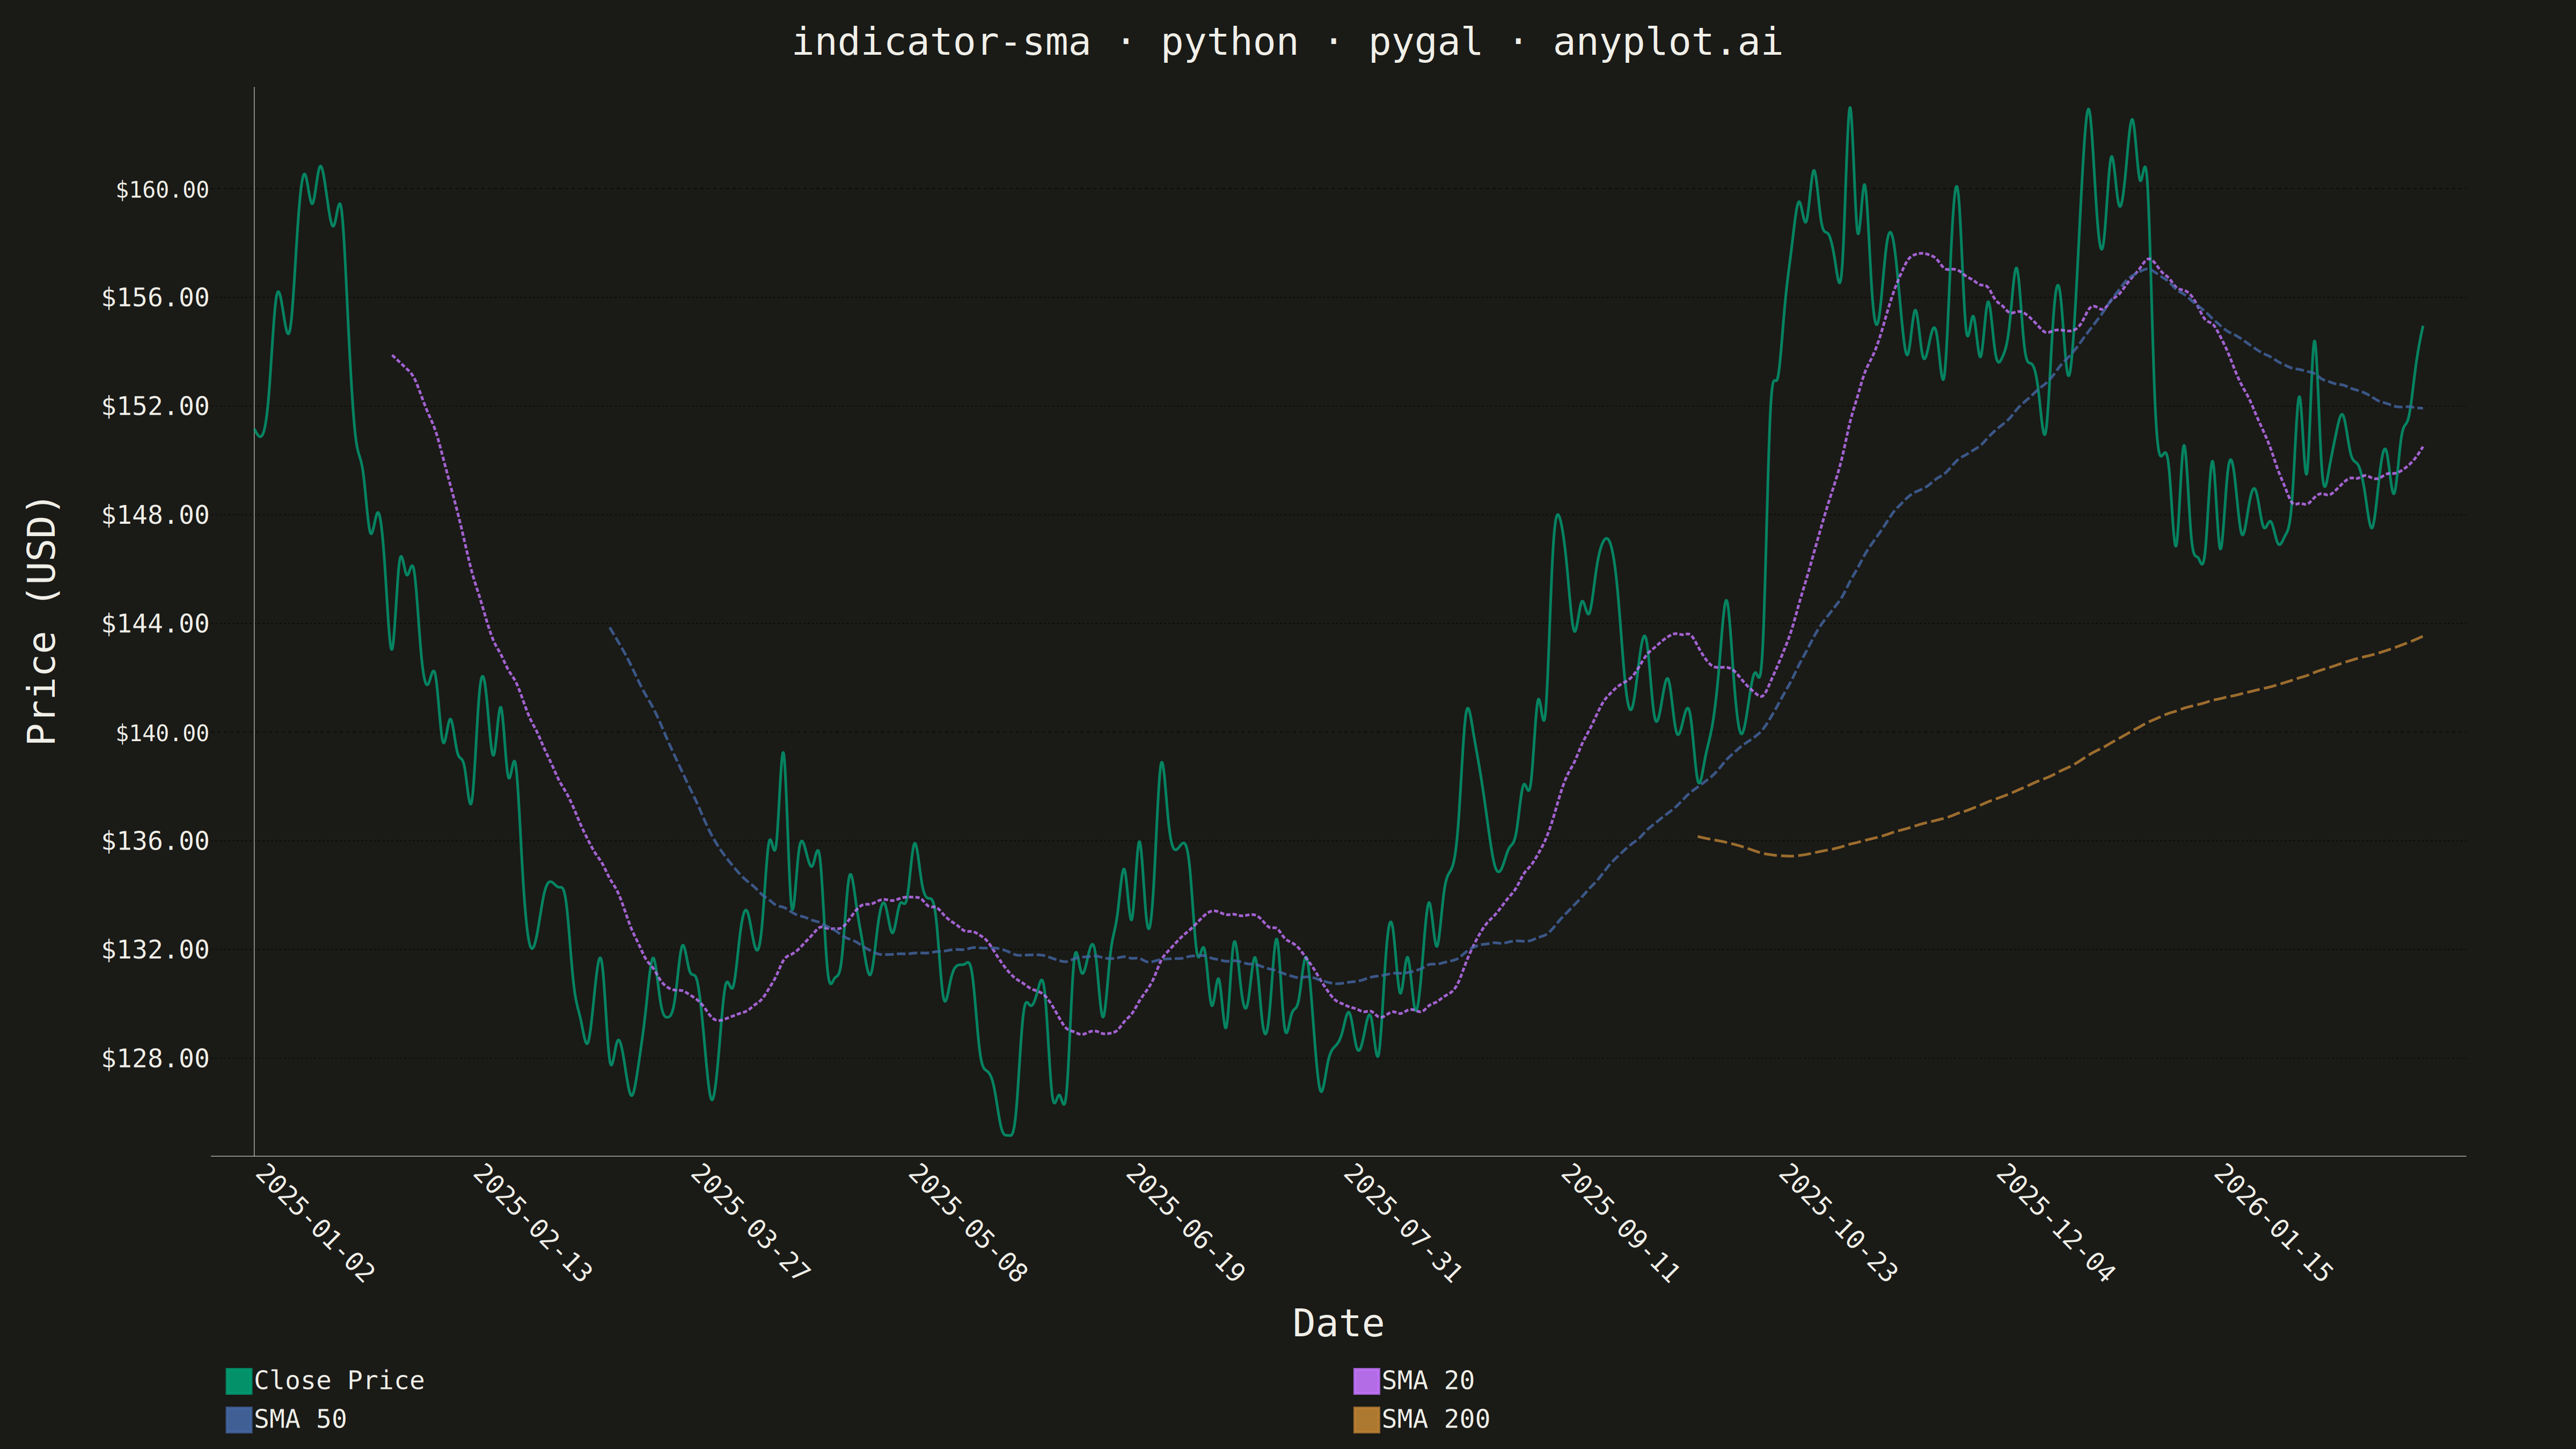
A Simple Moving Average (SMA) chart displays price or value data with one or more SMA overlays, typically showing short, medium, and long-term periods (e.g., 20, 50, 200-day). Each SMA line smooths out price fluctuations by averaging the last N data points, revealing underlying trends at different time scales. This multi-period overlay is fundamental to technical analysis, helping traders identify trend direction, support/resistance levels, and potential crossover signals.
""" anyplot.ai
indicator-sma: Simple Moving Average (SMA) Indicator Chart
Library: pygal 3.1.0 | Python 3.13.13
Quality: 89/100 | Updated: 2026-05-19
"""

import os

import numpy as np
import pandas as pd
import pygal
from pygal.style import Style


# Theme tokens
THEME = os.getenv("ANYPLOT_THEME", "light")
PAGE_BG = "#FAF8F1" if THEME == "light" else "#1A1A17"
INK = "#1A1A17" if THEME == "light" else "#F0EFE8"
INK_MUTED = "#6B6A63" if THEME == "light" else "#A8A79F"

IMPRINT = ("#009E73", "#C475FD", "#4467A3", "#BD8233", "#AE3030", "#2ABCCD", "#954477")

# Data — geometric Brownian motion for realistic stock price simulation
np.random.seed(42)
dates = pd.date_range("2025-01-02", periods=300, freq="B")
initial_price = 150.0
returns = np.random.normal(0.0003, 0.015, len(dates))
prices = initial_price * np.cumprod(1 + returns)

df = pd.DataFrame({"date": dates, "close": prices})
df["sma_20"] = df["close"].rolling(window=20).mean()
df["sma_50"] = df["close"].rolling(window=50).mean()
df["sma_200"] = df["close"].rolling(window=200).mean()

# X-axis labels — show date every 30 trading days, blank otherwise
x_labels = [d.strftime("%Y-%m-%d") if i % 30 == 0 else "" for i, d in enumerate(dates)]

# Style
custom_style = Style(
    background=PAGE_BG,
    plot_background=PAGE_BG,
    foreground=INK,
    foreground_strong=INK,
    foreground_subtle=INK_MUTED,
    colors=IMPRINT,
    title_font_size=72,
    label_font_size=48,
    major_label_font_size=42,
    legend_font_size=48,
    value_font_size=36,
    stroke_width=5,
    opacity=".9",
    opacity_hover=".95",
)

# Chart — cubic interpolation smooths the SMA lines for better readability
chart = pygal.Line(
    width=4800,
    height=2700,
    style=custom_style,
    title="indicator-sma · python · pygal · anyplot.ai",
    x_title="Date",
    y_title="Price (USD)",
    show_x_guides=False,
    show_y_guides=True,
    x_label_rotation=45,
    show_dots=False,
    legend_at_bottom=True,
    legend_box_size=45,
    margin=60,
    spacing=30,
    interpolate="cubic",
    value_formatter=lambda x: f"${x:.2f}",
)

chart.x_labels = x_labels

# Convert NaN periods (before SMA window fills) to None for pygal
close_list = [float(v) for v in df["close"]]
sma_20_list = [None if pd.isna(v) else float(v) for v in df["sma_20"]]
sma_50_list = [None if pd.isna(v) else float(v) for v in df["sma_50"]]
sma_200_list = [None if pd.isna(v) else float(v) for v in df["sma_200"]]

# Annotate market bottom with a tooltip label to guide the viewer's eye
min_idx = int(df["close"].idxmin())
close_annotated = [
    {"value": float(v), "label": "Market Bottom"} if i == min_idx else float(v) for i, v in enumerate(df["close"])
]

# Close price as bold solid line; heavier width creates clear primary/secondary hierarchy
chart.add("Close Price", close_annotated, stroke_style={"width": 7})
chart.add("SMA 20", sma_20_list, stroke_style={"width": 3, "dasharray": "8, 4"})
chart.add("SMA 50", sma_50_list, stroke_style={"width": 4, "dasharray": "16, 6"})
chart.add("SMA 200", sma_200_list, stroke_style={"width": 5, "dasharray": "24, 8"})

# Save
chart.render_to_png(f"plot-{THEME}.png")
with open(f"plot-{THEME}.html", "wb") as f:
    f.write(chart.render())
Runnable source as JSON, for any HTTP client: https://api.anyplot.ai/specs/indicator-sma/pygal/code. Any spec id and library id listed in llms-full.txt fit the same URL shape; every URL below is complete and callable.
{
  "spec_id": "indicator-sma",
  "language": "python",
  "library": "pygal",
  "page": "https://anyplot.ai/indicator-sma/python/pygal",
  "hub": "https://anyplot.ai/indicator-sma",
  "code_json": "https://api.anyplot.ai/specs/indicator-sma/pygal/code",
  "spec_json": "https://api.anyplot.ai/specs/indicator-sma",
  "render_light_png": "https://storage.googleapis.com/anyplot-images/plots/indicator-sma/python/pygal/plot-light.png",
  "render_dark_png": "https://storage.googleapis.com/anyplot-images/plots/indicator-sma/python/pygal/plot-dark.png",
  "interactive_light_html": "https://storage.googleapis.com/anyplot-images/plots/indicator-sma/python/pygal/plot-light.html",
  "interactive_dark_html": "https://storage.googleapis.com/anyplot-images/plots/indicator-sma/python/pygal/plot-dark.html",
  "quality_score": 89.0,
  "license": "MIT",
  "guide": "https://anyplot.ai/llms.txt"
}
Part of Simple Moving Average (SMA) Indicator Chart on anyplot.ai.