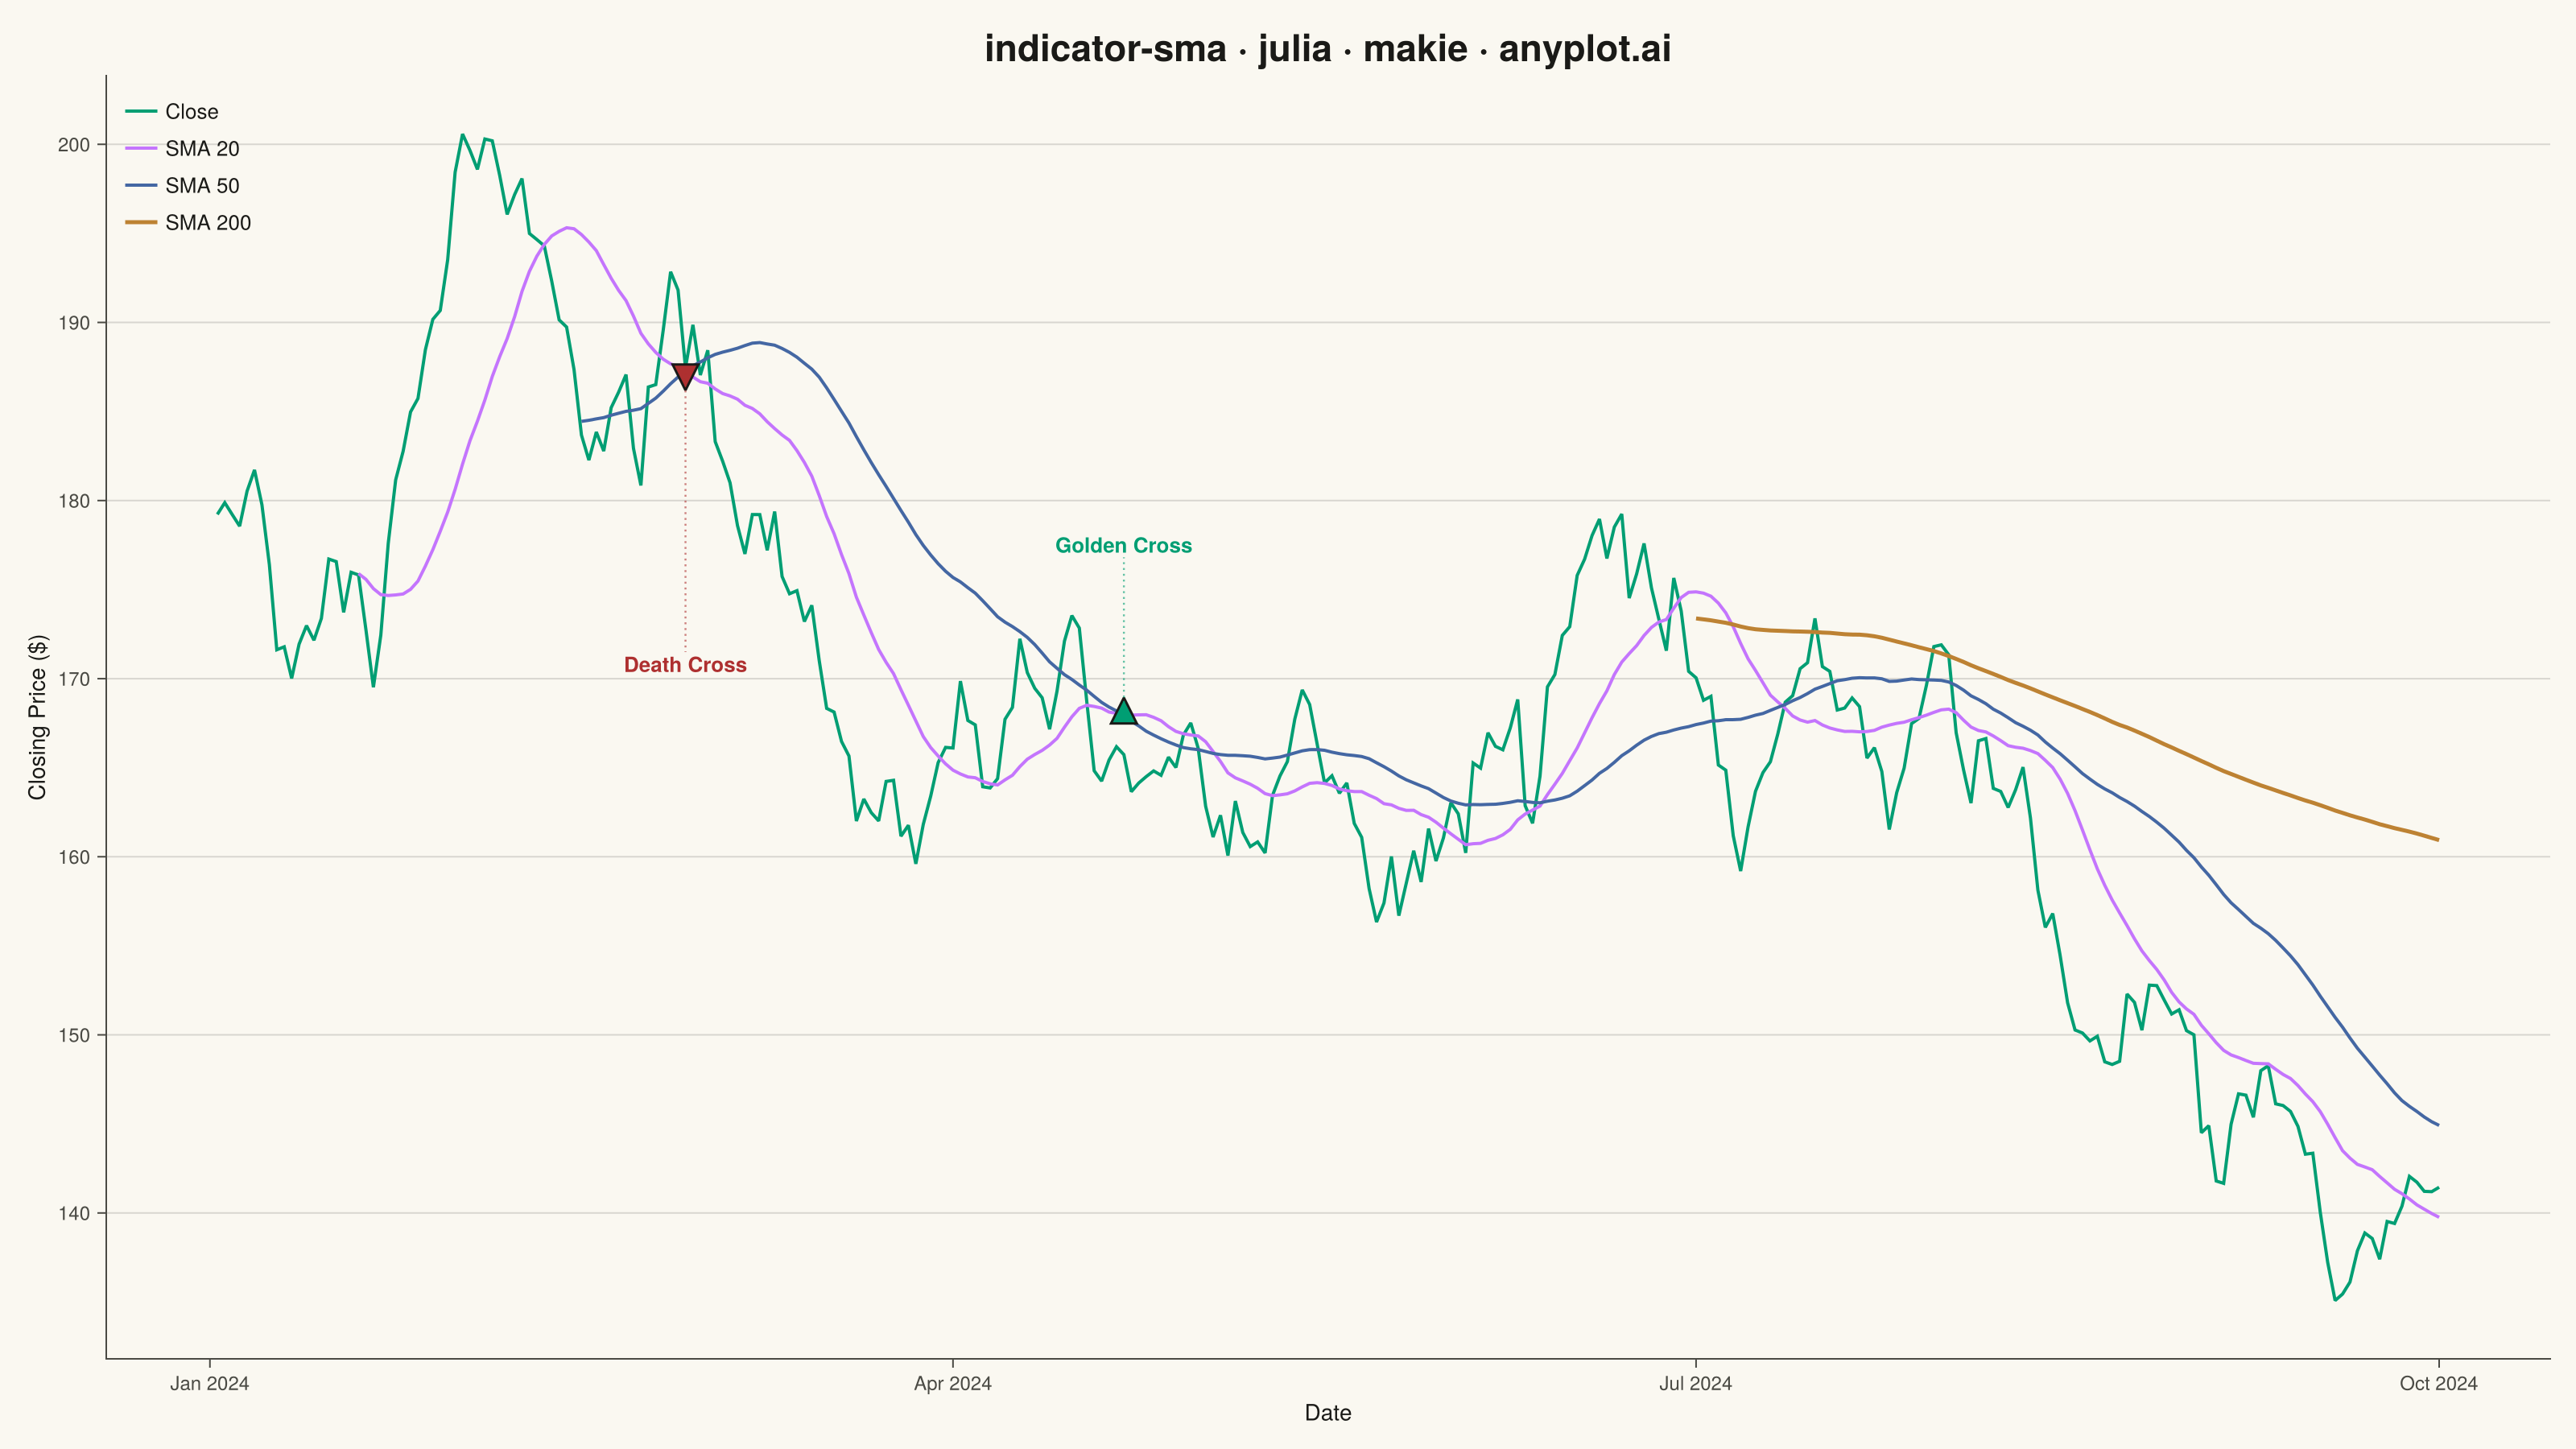
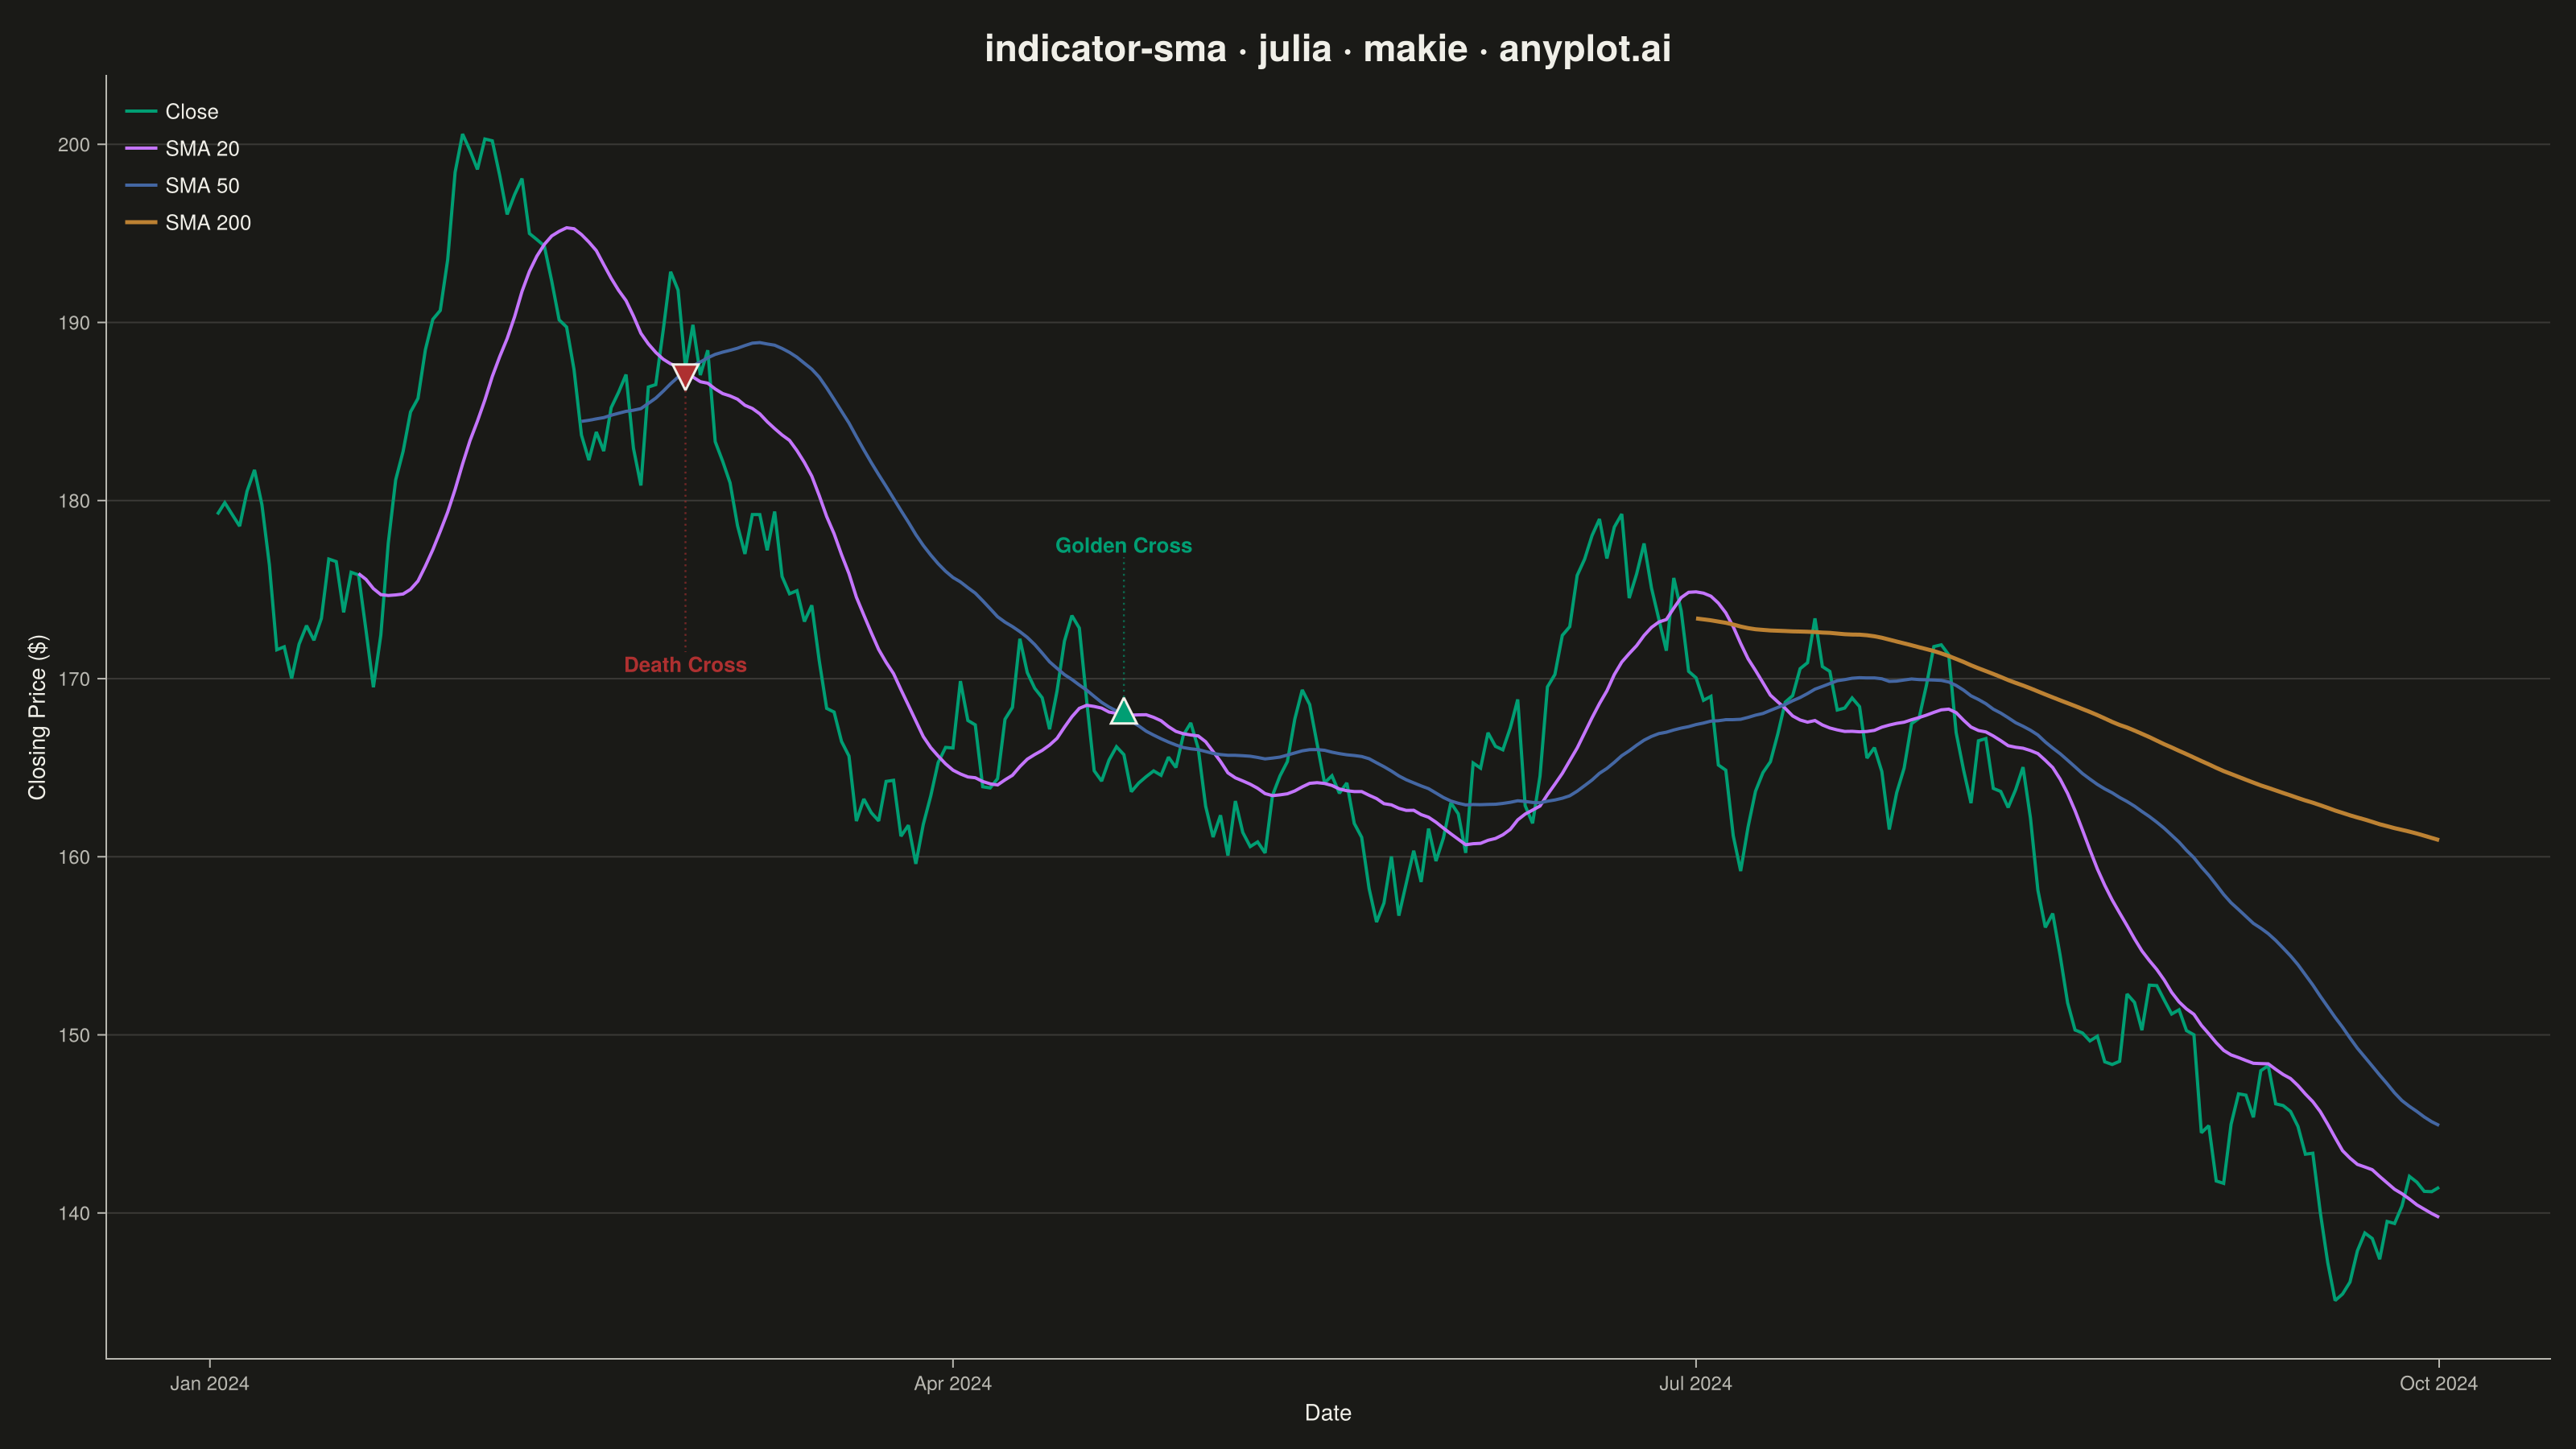
The same plot in 14 other libraries — Python: Altair, Bokeh, lets-plot, Matplotlib, Plotly, plotnine, Pygal, Seaborn; R: ggplot2; JavaScript: Chart.js, D3.js, Apache ECharts, Highcharts, MUI X Charts. Compare all 15 side by side: Simple Moving Average (SMA) Indicator Chart in Python, R, Julia and JavaScript.
A Simple Moving Average (SMA) chart displays price or value data with one or more SMA overlays, typically showing short, medium, and long-term periods (e.g., 20, 50, 200-day). Each SMA line smooths out price fluctuations by averaging the last N data points, revealing underlying trends at different time scales. This multi-period overlay is fundamental to technical analysis, helping traders identify trend direction, support/resistance levels, and potential crossover signals.
# anyplot.ai
# indicator-sma: Simple Moving Average (SMA) Indicator Chart
# Library: makie 0.21.9 | Julia 1.11.9
# Quality: 92/100 | Created: 2026-09-02

using CairoMakie
using Colors
using Dates
using Random
using Statistics

Random.seed!(42)

# --- Theme tokens -----------------------------------------------------------
const THEME    = get(ENV, "ANYPLOT_THEME", "light")
const PAGE_BG  = THEME == "light" ? colorant"#FAF8F1" : colorant"#1A1A17"
const INK      = THEME == "light" ? colorant"#1A1A17" : colorant"#F0EFE8"
const INK_SOFT = THEME == "light" ? colorant"#4A4A44" : colorant"#B8B7B0"
const IMPRINT_PALETTE = [
    colorant"#009E73", colorant"#C475FD", colorant"#4467A3", colorant"#BD8233",
    colorant"#AE3030", colorant"#2ABCCD", colorant"#954477", colorant"#99B314",
]

# --- Data ---------------------------------------------------------------
n = 300
daily_returns = 0.0004 .+ 0.013 .* randn(n)
close = 180.0 .* cumprod(1.0 .+ daily_returns)
trading_day = 1:n
start_date = Date(2024, 1, 2)

window_short  = 20
window_medium = 50
window_long   = 200

sma_short  = [i < window_short ? NaN : mean(close[(i - window_short + 1):i]) for i in 1:n]
sma_medium = [i < window_medium ? NaN : mean(close[(i - window_medium + 1):i]) for i in 1:n]
sma_long   = [i < window_long ? NaN : mean(close[(i - window_long + 1):i]) for i in 1:n]

# Golden-cross / death-cross detection (SMA 20 vs. SMA 50) — the crossover
# signal that is the entire analytical point of a multi-period SMA overlay.
diff_ma = sma_short .- sma_medium
crossovers = Tuple{Int,Symbol}[]
for i in (window_medium + 1):n
    if sign(diff_ma[i]) != sign(diff_ma[i - 1])
        push!(crossovers, (i, diff_ma[i] > 0 ? :golden : :death))
    end
end

# Annotate only well-separated crossovers so the callouts stay a focal point
# rather than clutter.
featured_crossovers = Tuple{Int,Symbol}[]
last_i = -Inf
for (i, kind) in crossovers
    if i - last_i >= 40
        push!(featured_crossovers, (i, kind))
        global last_i = i
    end
end
featured_crossovers = first(featured_crossovers, min(2, length(featured_crossovers)))

# --- Plot -----------------------------------------------------------------
fig = Figure(
    size            = (1600, 900),
    fontsize        = 14,
    backgroundcolor = PAGE_BG,
)

ax = Axis(
    fig[1, 1];
    title              = "indicator-sma · julia · makie · anyplot.ai",
    titlesize          = 23,
    titlecolor         = INK,
    xlabel             = "Date",
    ylabel             = "Closing Price (\$)",
    xlabelsize         = 14,
    ylabelsize         = 14,
    xlabelcolor        = INK,
    ylabelcolor        = INK,
    xticklabelsize     = 12,
    yticklabelsize     = 12,
    xticklabelcolor    = INK_SOFT,
    yticklabelcolor    = INK_SOFT,
    xtickcolor         = INK_SOFT,
    ytickcolor         = INK_SOFT,
    xtickformat        = xs -> [Dates.format(start_date + Day(round(Int, x) - 1), "u yyyy") for x in xs],
    backgroundcolor    = PAGE_BG,
    topspinevisible    = false,
    rightspinevisible  = false,
    leftspinecolor     = INK_SOFT,
    bottomspinecolor   = INK_SOFT,
    ygridcolor         = RGBAf(INK.r, INK.g, INK.b, 0.15),
    xgridvisible       = false,
)

lines!(ax, trading_day, close; color = IMPRINT_PALETTE[1], linewidth = 2.0, label = "Close")
lines!(ax, trading_day, sma_short; color = IMPRINT_PALETTE[2], linewidth = 2.0, label = "SMA 20")
lines!(ax, trading_day, sma_medium; color = IMPRINT_PALETTE[3], linewidth = 2.0, label = "SMA 50")
lines!(ax, trading_day, sma_long; color = IMPRINT_PALETTE[4], linewidth = 2.5, label = "SMA 200")

# Golden-cross / death-cross callouts — a Makie-distinctive `scatter!` +
# `text!` + dotted leader-line annotation combo that gives the overlay its
# analytical focal point. The label is placed clear of every series' local
# extremum (not just the marker itself) so it never sits on top of a line.
margin = 0.05 * (maximum(close) - minimum(close))
for (i, kind) in featured_crossovers
    is_golden    = kind == :golden
    marker_color = is_golden ? IMPRINT_PALETTE[1] : IMPRINT_PALETTE[5]
    marker_glyph = is_golden ? :utriangle : :dtriangle
    label_text   = is_golden ? "Golden Cross" : "Death Cross"

    window = max(1, i - 15):min(n, i + 15)
    local_values = vcat(close[window], filter(!isnan, sma_short[window]),
                         filter(!isnan, sma_medium[window]), filter(!isnan, sma_long[window]))
    label_y = is_golden ? maximum(local_values) + margin : minimum(local_values) - margin

    scatter!(
        ax, [trading_day[i]], [sma_short[i]];
        marker      = marker_glyph,
        markersize  = 22,
        color       = marker_color,
        strokecolor = INK,
        strokewidth = 1.5,
    )
    lines!(
        ax, [trading_day[i], trading_day[i]], [sma_short[i], label_y];
        color     = (marker_color, 0.6),
        linewidth = 1.2,
        linestyle = :dot,
    )
    text!(
        ax, trading_day[i], label_y;
        text     = label_text,
        align    = (:center, is_golden ? :bottom : :top),
        color    = marker_color,
        fontsize = 13,
        font     = :bold,
    )
end

axislegend(ax; position = :lt, labelcolor = INK, framevisible = false, labelsize = 13)

# --- Save -------------------------------------------------------------------
save("plot-$(THEME).png", fig; px_per_unit = 2)
Runnable source as JSON, for any HTTP client: https://api.anyplot.ai/specs/indicator-sma/makie/code. Any spec id and library id listed in llms-full.txt fit the same URL shape; every URL below is complete and callable.
{
  "spec_id": "indicator-sma",
  "language": "julia",
  "library": "makie",
  "page": "https://anyplot.ai/indicator-sma/julia/makie",
  "hub": "https://anyplot.ai/indicator-sma",
  "code_json": "https://api.anyplot.ai/specs/indicator-sma/makie/code",
  "spec_json": "https://api.anyplot.ai/specs/indicator-sma",
  "render_light_png": "https://storage.googleapis.com/anyplot-images/plots/indicator-sma/julia/makie/plot-light.png",
  "render_dark_png": "https://storage.googleapis.com/anyplot-images/plots/indicator-sma/julia/makie/plot-dark.png",
  "quality_score": 92.0,
  "license": "MIT",
  "guide": "https://anyplot.ai/llms.txt"
}
Part of Simple Moving Average (SMA) Indicator Chart on anyplot.ai.