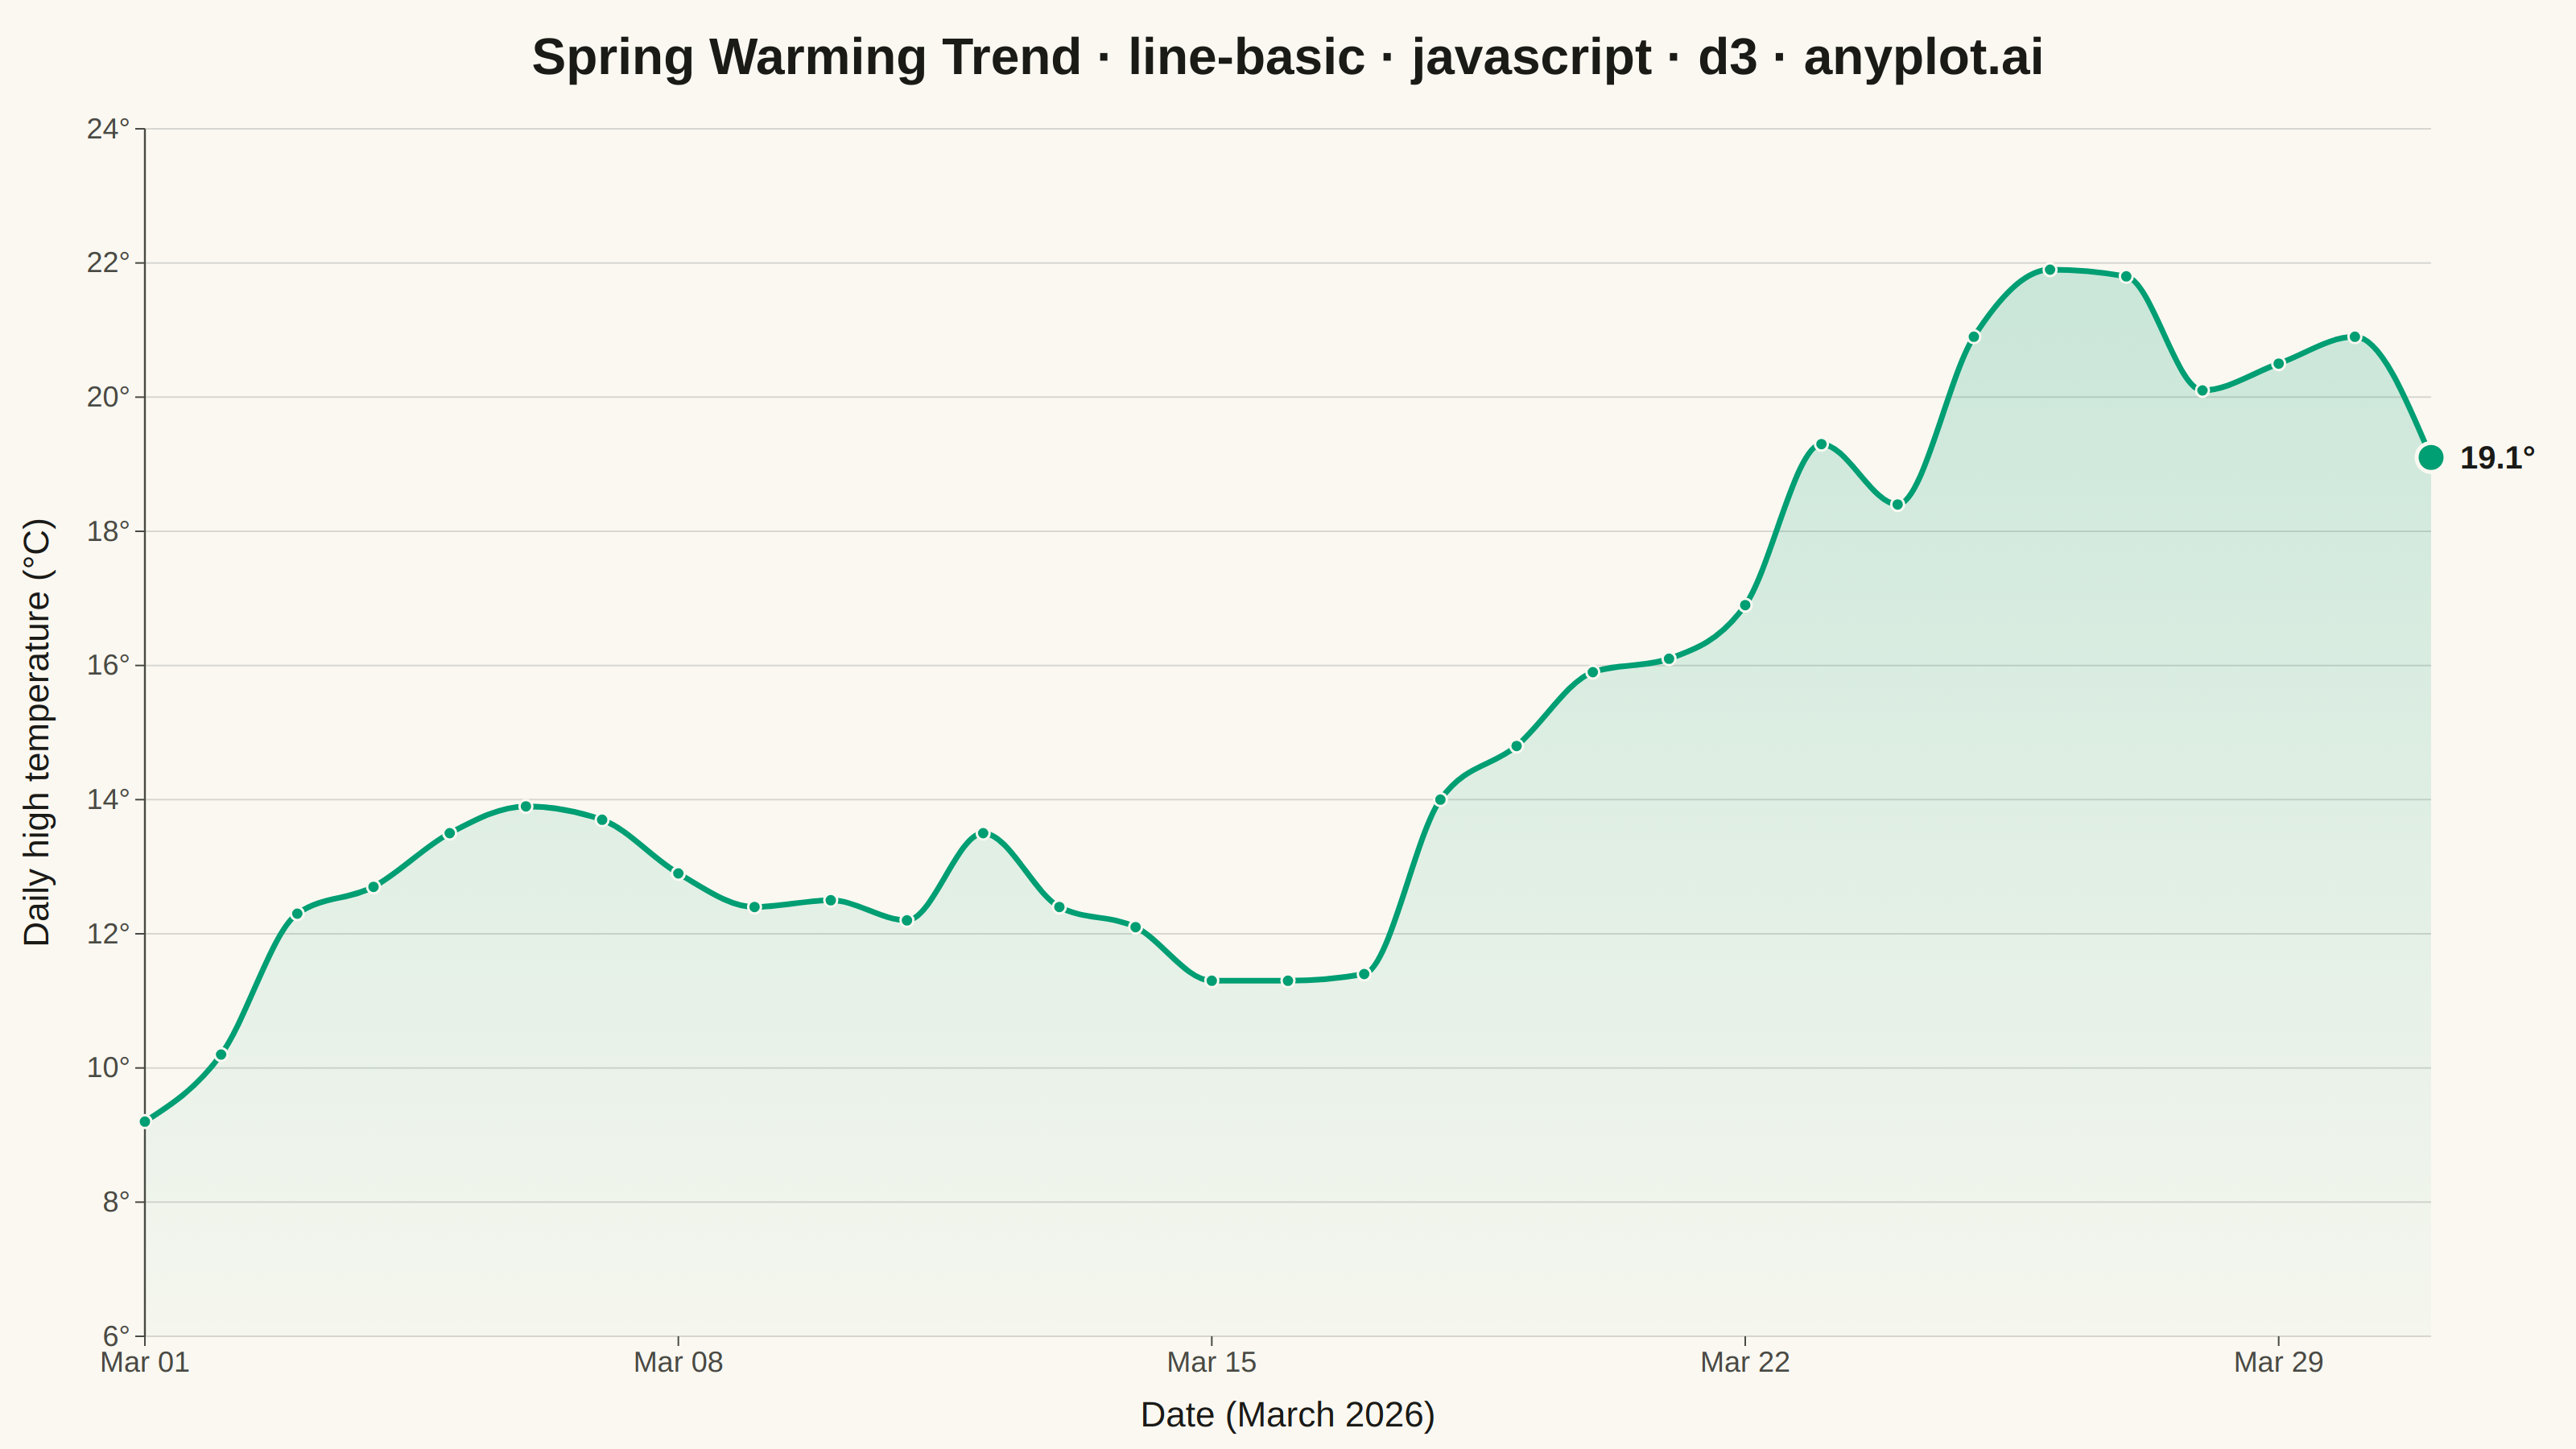
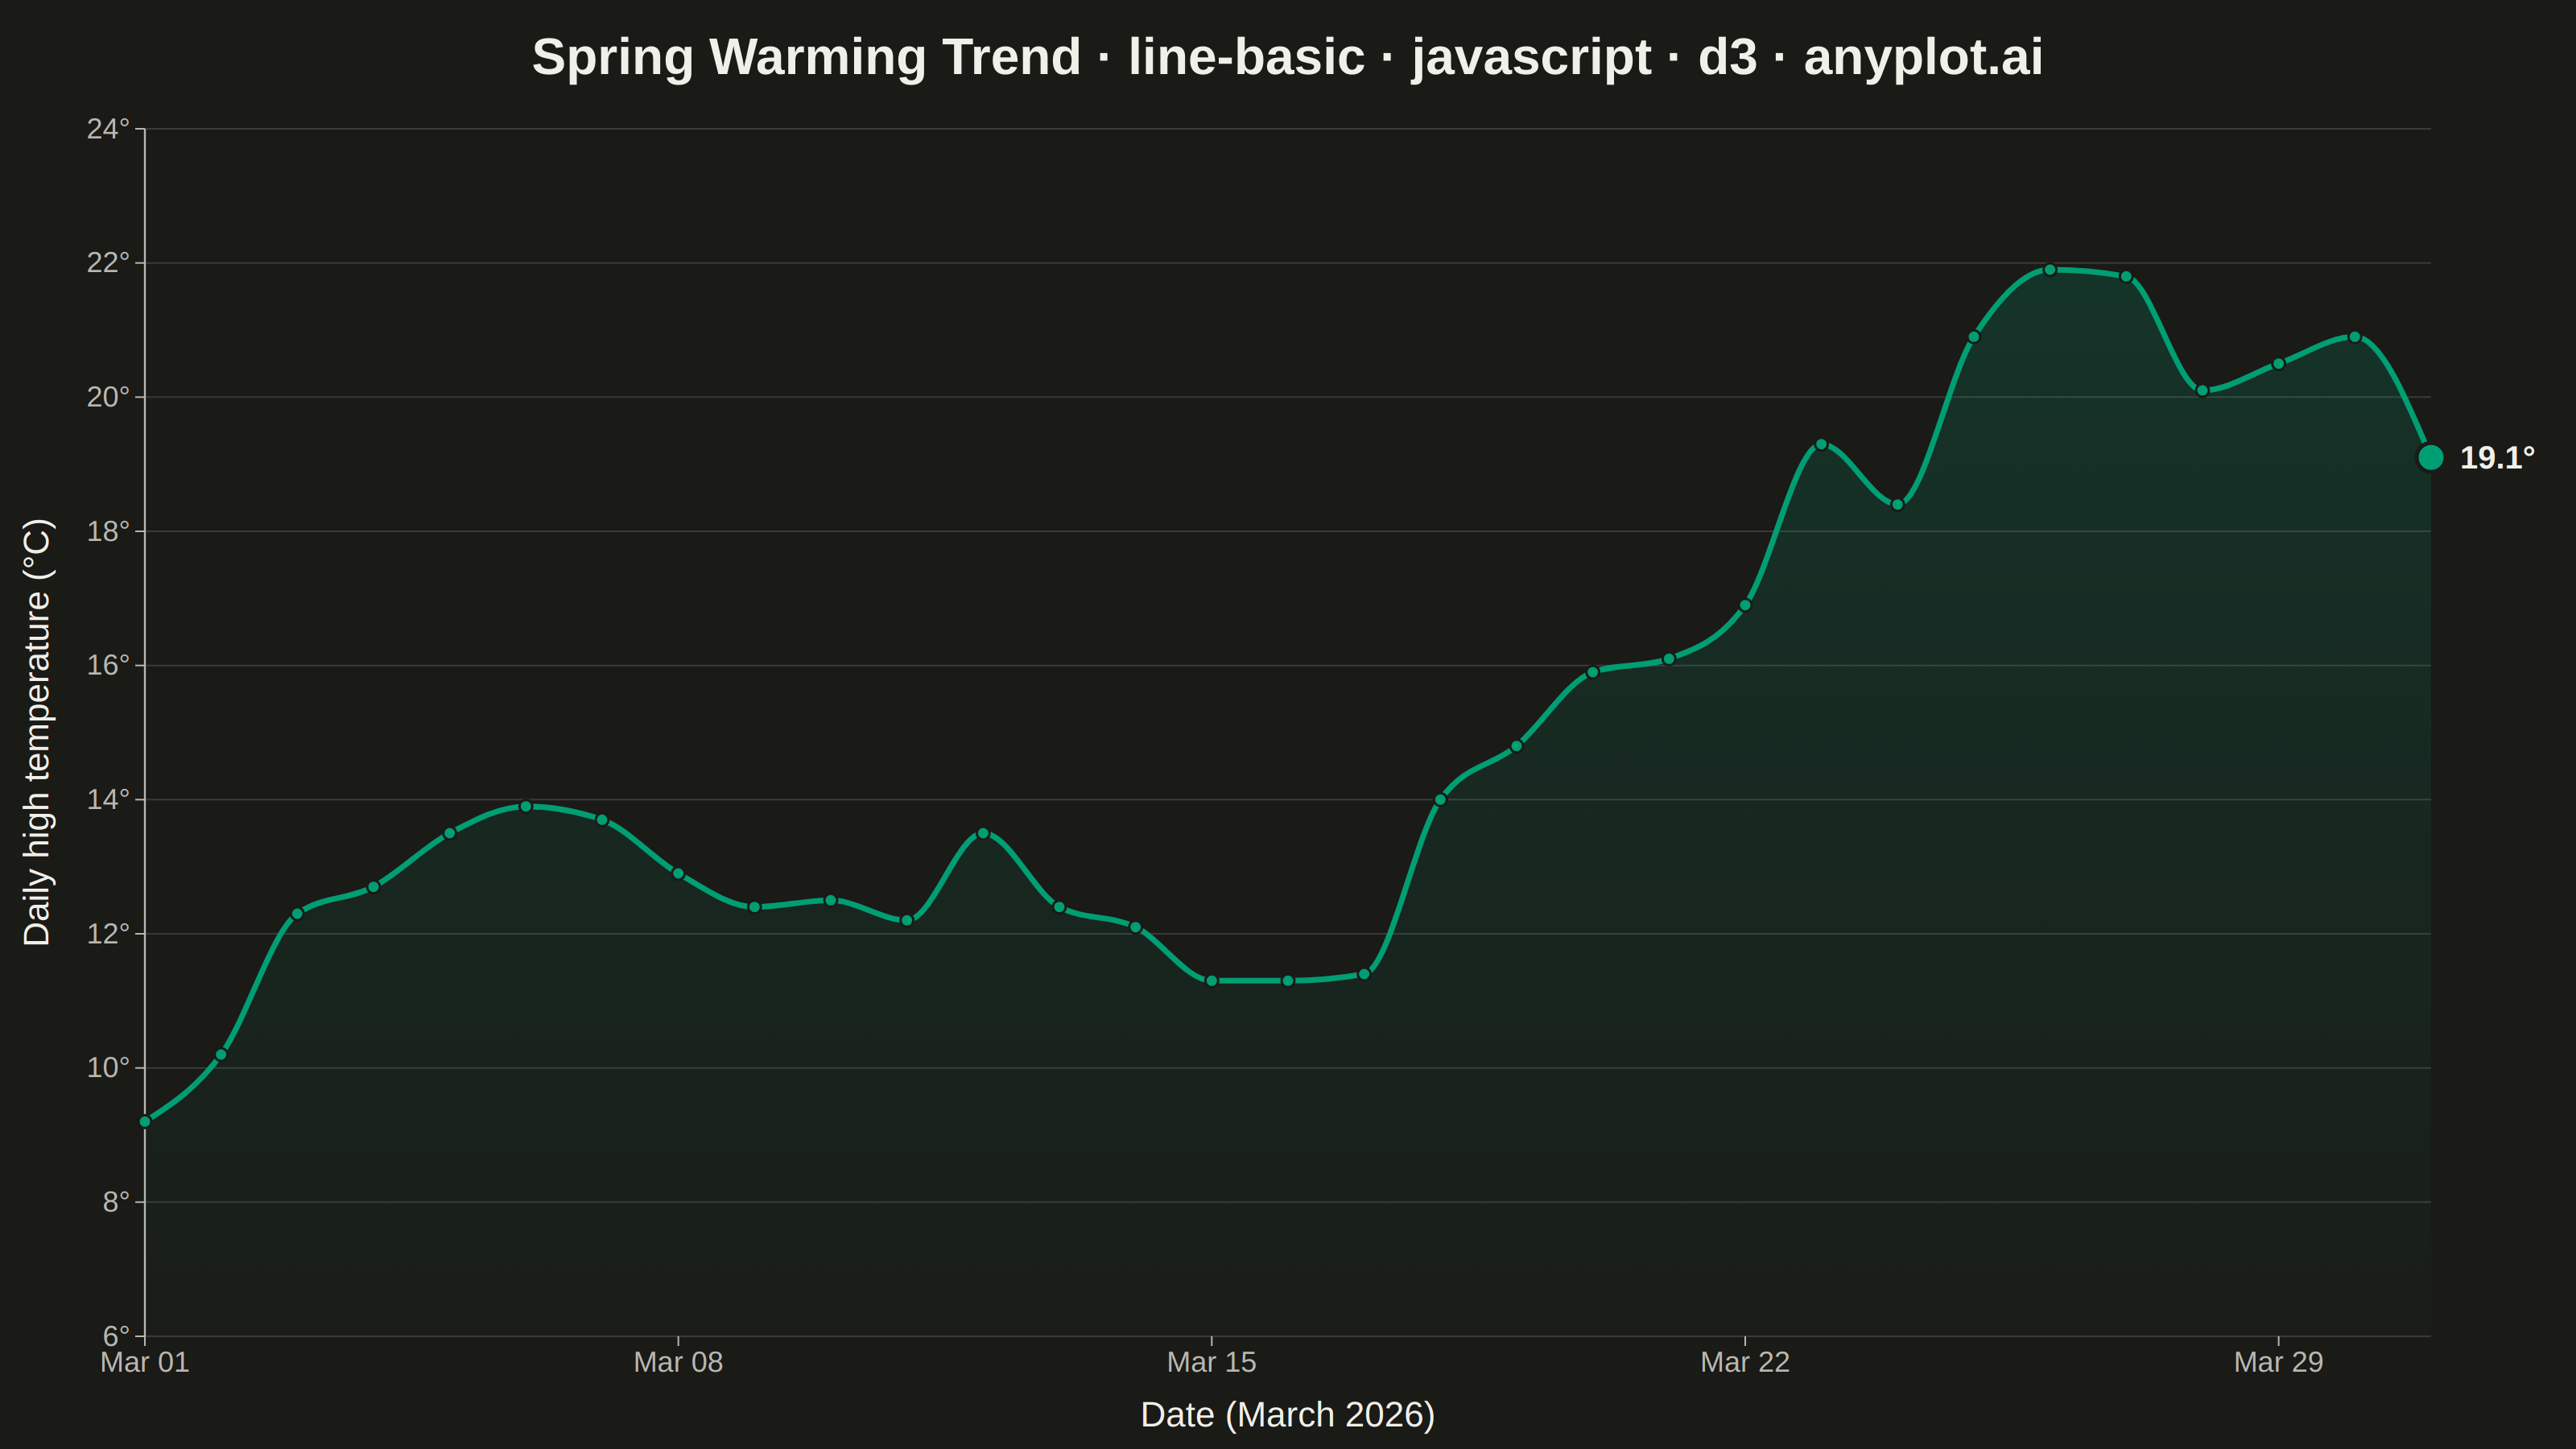
A basic line plot connects data points with straight lines to show how a continuous variable changes over a sequence or time. It's ideal for revealing trends, patterns, and changes in data over ordered intervals. The simplicity of a single-line design makes it easy to interpret at a glance.
Preview render from the D3.js implementation.