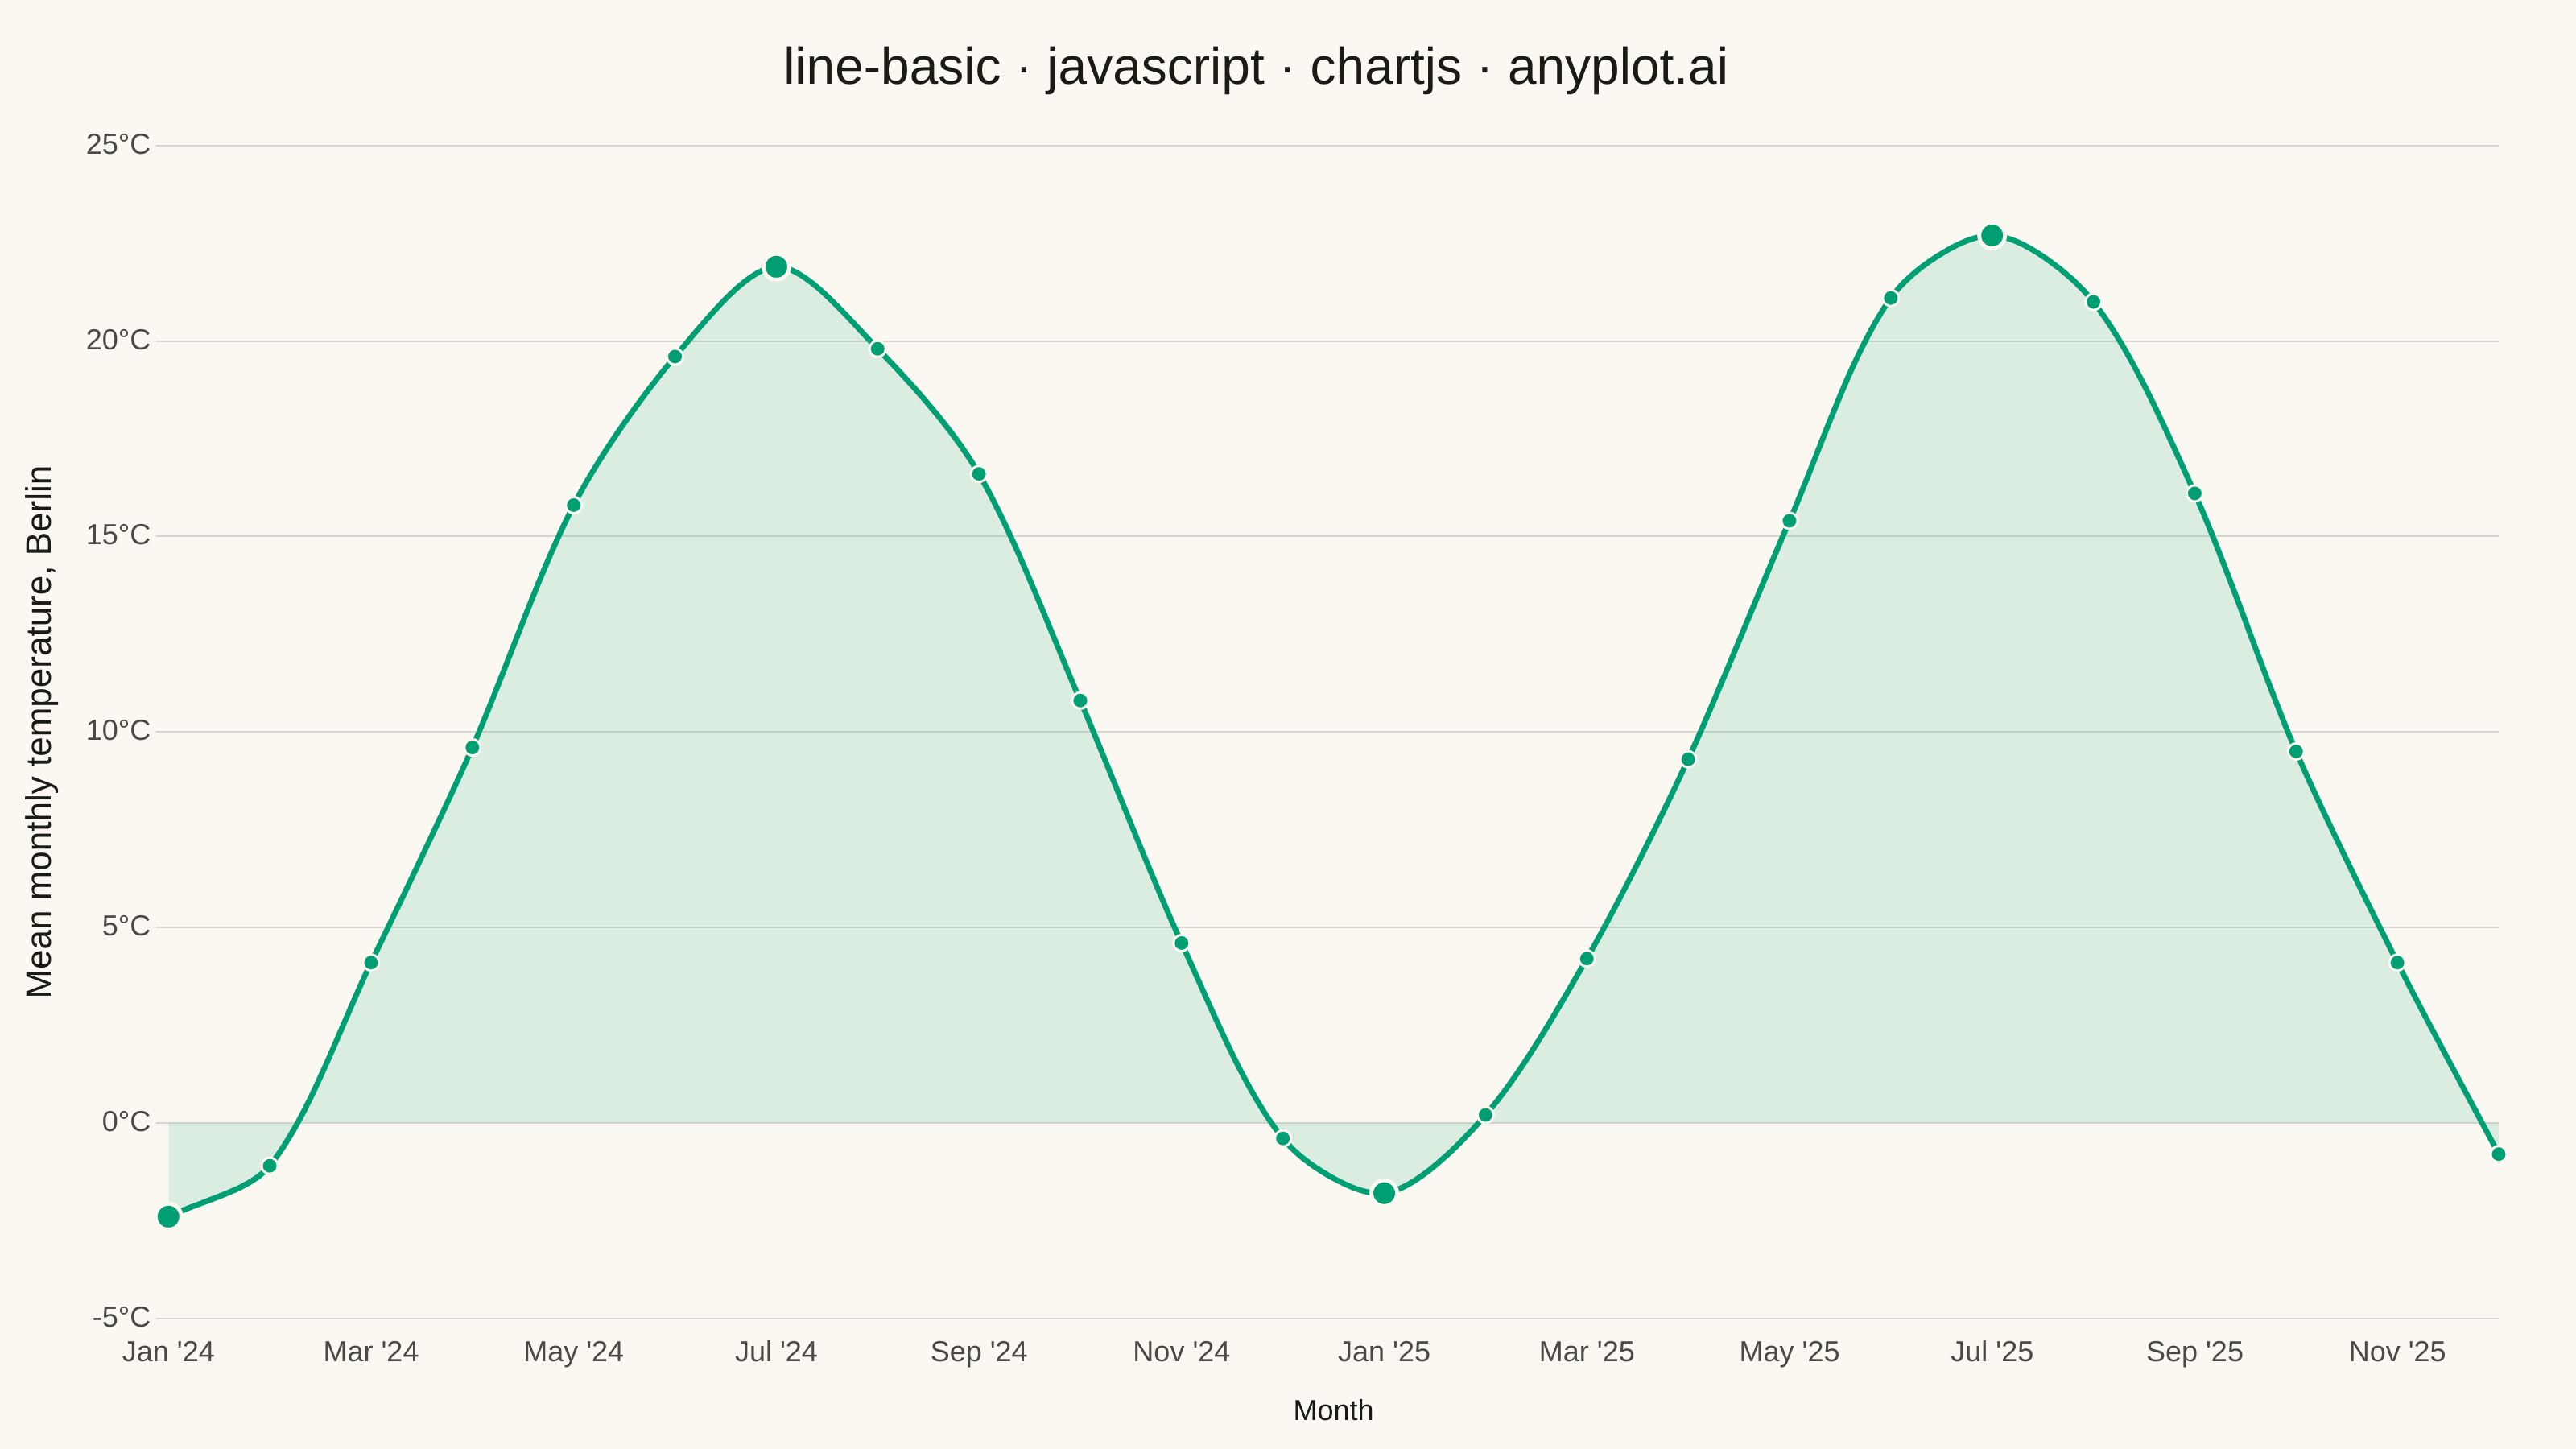
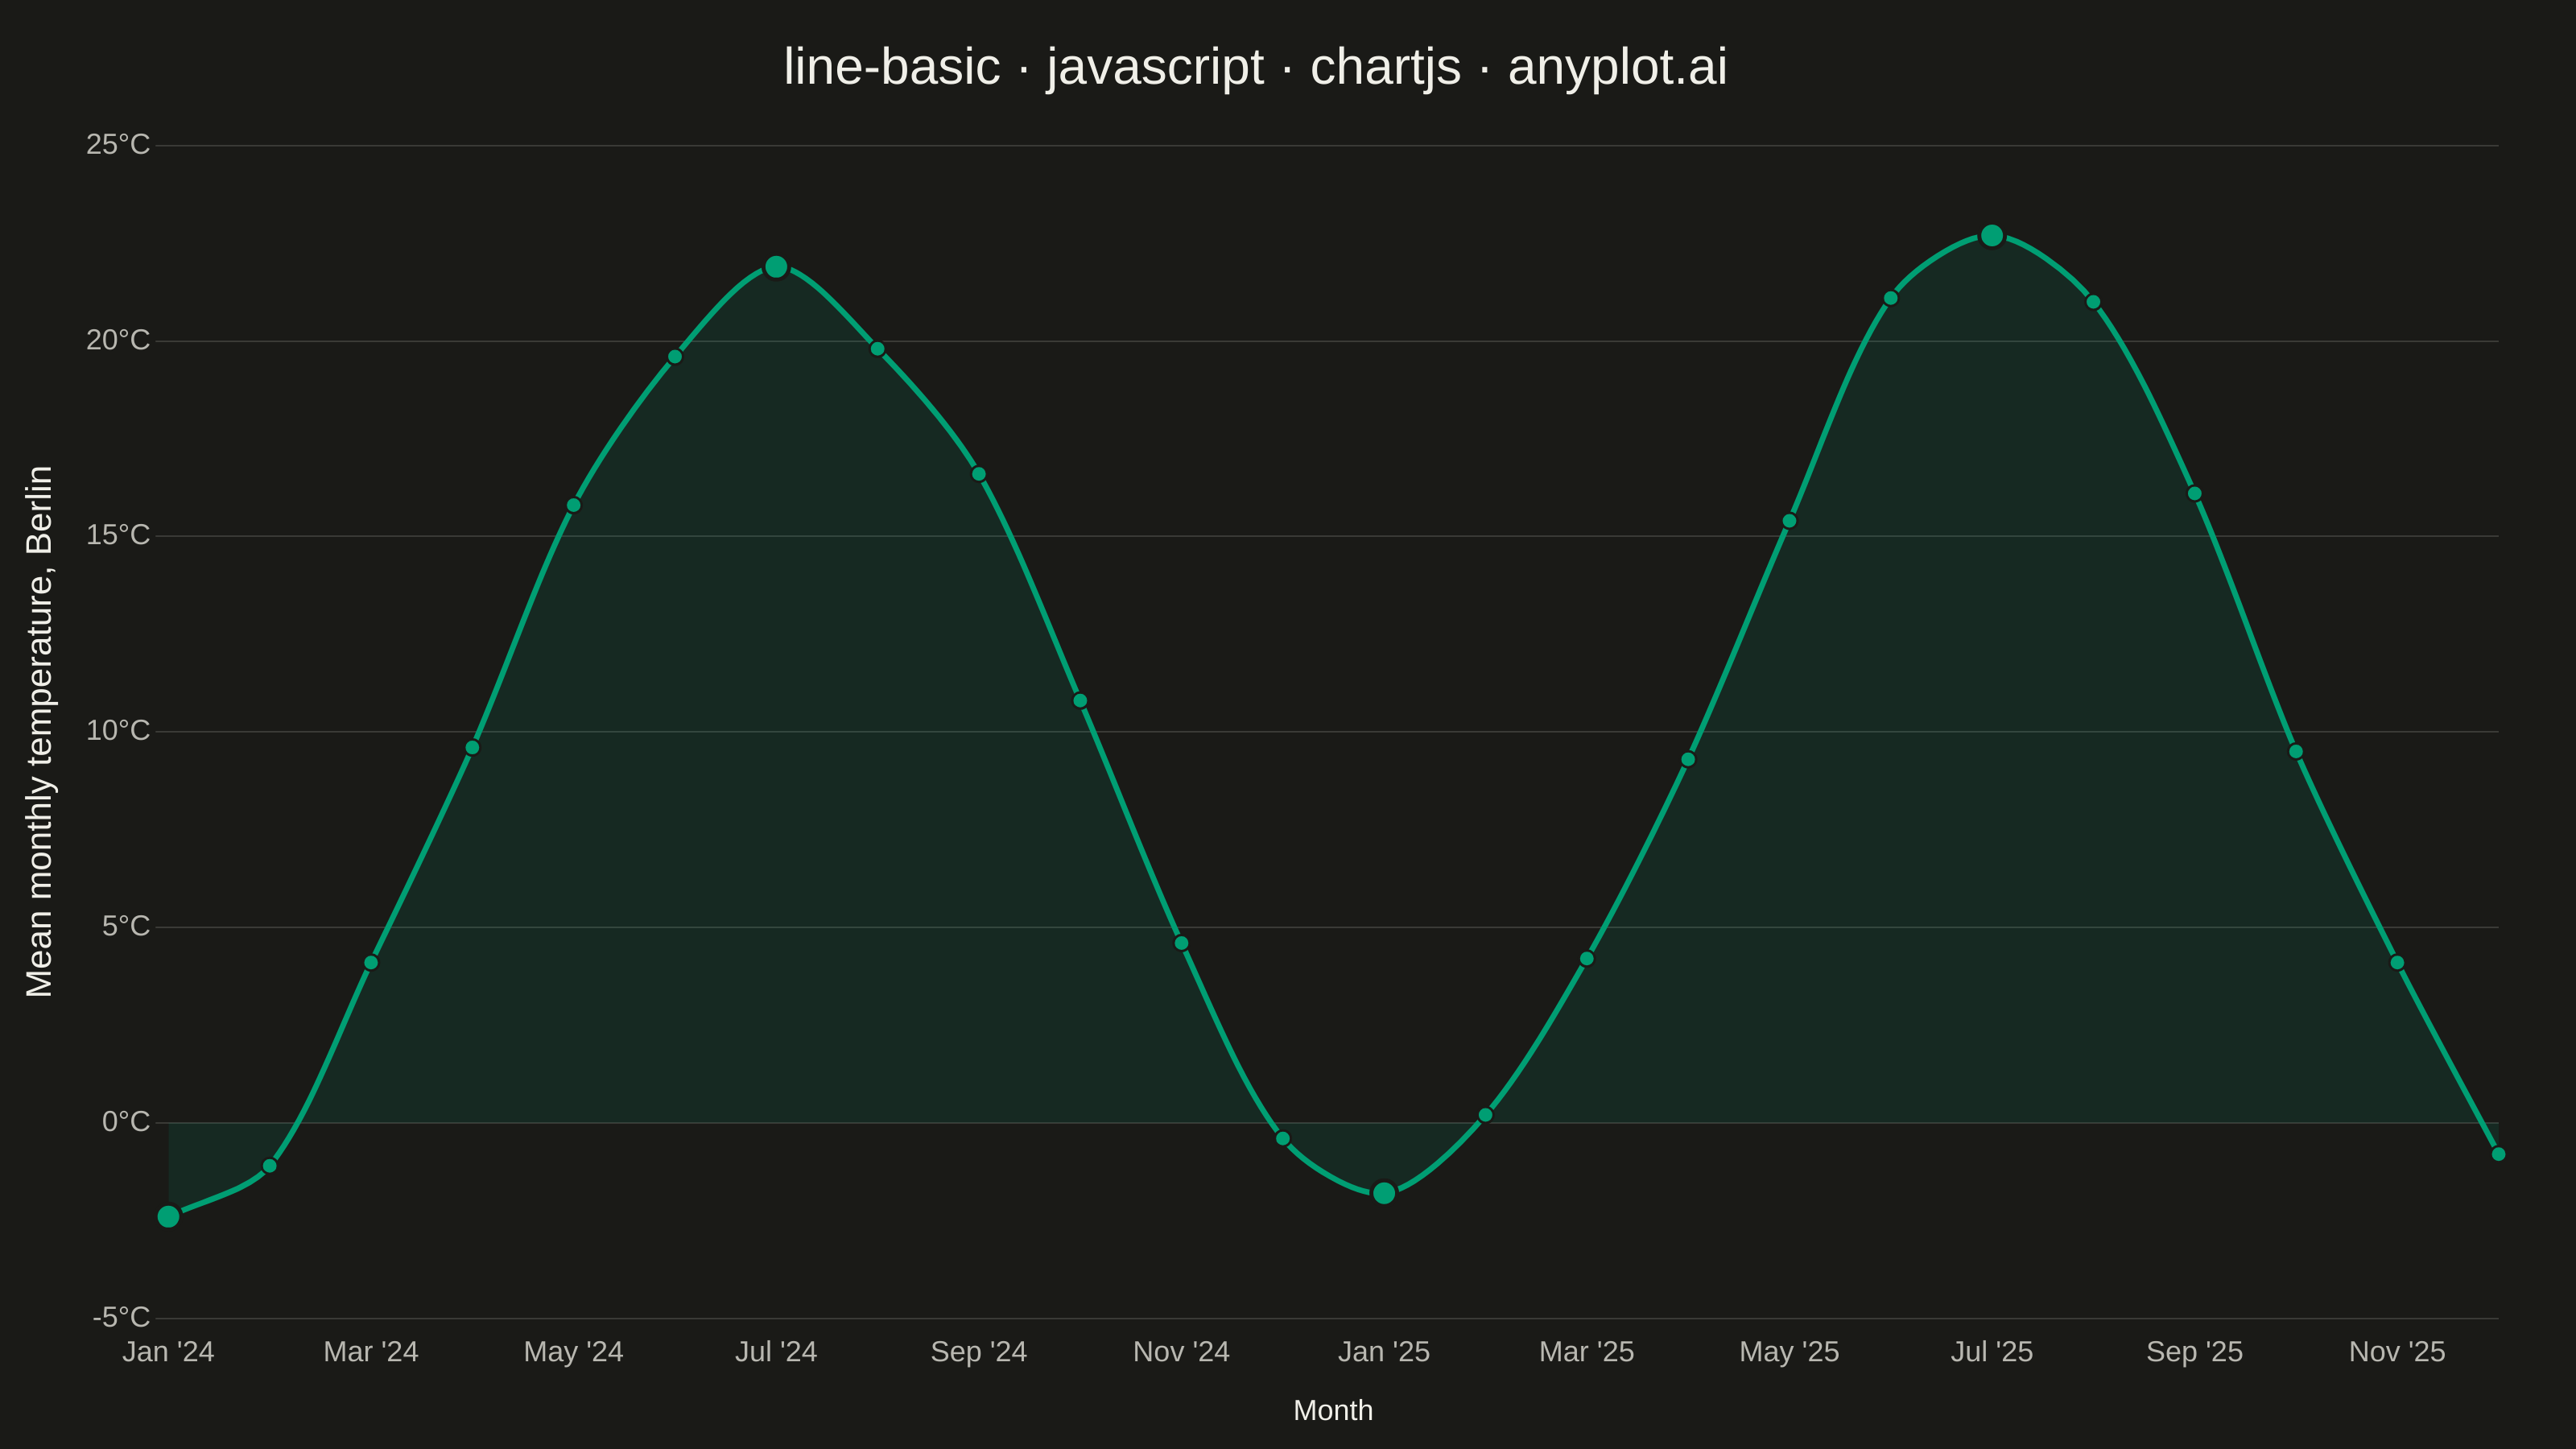
The same plot in 14 other libraries — JavaScript: D3.js, Apache ECharts, Highcharts, MUI X Charts; Python: Altair, Bokeh, lets-plot, Matplotlib, Plotly, plotnine, Pygal, Seaborn; R: ggplot2; Julia: Makie.jl. Compare all 15 side by side: Basic Line Plot in Python, R, Julia and JavaScript.
A basic line plot connects data points with straight lines to show how a continuous variable changes over a sequence or time. It's ideal for revealing trends, patterns, and changes in data over ordered intervals. The simplicity of a single-line design makes it easy to interpret at a glance.
// anyplot.ai
// line-basic: Basic Line Plot
// Library: chartjs 4.4.7 | JavaScript 22.22.3
// Quality: 87/100 | Created: 2026-06-02

//# anyplot-orientation: landscape

const t = window.ANYPLOT_TOKENS;

// Deterministic LCG so the monthly noise is reproducible across renders (seed = 42)
let seed = 42;
const rand = () => { seed = (seed * 1664525 + 1013904223) >>> 0; return seed / 0x100000000; };

// Data: Berlin monthly mean temperature, Jan 2024 - Dec 2025 (two full seasonal cycles)
const monthLabels = [
  "Jan '24", "Feb '24", "Mar '24", "Apr '24", "May '24", "Jun '24",
  "Jul '24", "Aug '24", "Sep '24", "Oct '24", "Nov '24", "Dec '24",
  "Jan '25", "Feb '25", "Mar '25", "Apr '25", "May '25", "Jun '25",
  "Jul '25", "Aug '25", "Sep '25", "Oct '25", "Nov '25", "Dec '25",
];
const temperatures = monthLabels.map((_, i) => {
  const seasonal = 10 + 12 * Math.cos((2 * Math.PI * (i - 6)) / 12);
  const noise = (rand() - 0.5) * 1.6;
  return +(seasonal + noise).toFixed(1);
});

// Focal-point storytelling: emphasise the per-cycle summer peak and winter trough
const peakIdx = [0, 12].map((s) => {
  const slice = temperatures.slice(s, s + 12);
  return s + slice.indexOf(Math.max(...slice));
});
const troughIdx = [0, 12].map((s) => {
  const slice = temperatures.slice(s, s + 12);
  return s + slice.indexOf(Math.min(...slice));
});
const focal = new Set([...peakIdx, ...troughIdx]);

// Subtle tinted fill below the line (low-alpha brand green works on both themes)
const fillTint = "rgba(0, 158, 115, 0.12)";

// Mount canvas into the harness container
const canvas = document.createElement("canvas");
document.getElementById("container").appendChild(canvas);

new Chart(canvas, {
  type: "line",
  data: {
    labels: monthLabels,
    datasets: [{
      label: "Mean temperature",
      data: temperatures,
      borderColor: t.palette[0],
      backgroundColor: fillTint,
      borderWidth: 3.5,
      pointRadius: temperatures.map((_, i) => (focal.has(i) ? 8 : 5)),
      pointHoverRadius: temperatures.map((_, i) => (focal.has(i) ? 10 : 7)),
      pointBackgroundColor: t.palette[0],
      pointBorderColor: t.pageBg,
      pointBorderWidth: temperatures.map((_, i) => (focal.has(i) ? 2.5 : 1.5)),
      tension: 0.3,
      fill: "origin",
    }],
  },
  options: {
    responsive: true,
    maintainAspectRatio: false,
    animation: false,
    layout: { padding: { top: 16, right: 48, bottom: 8, left: 8 } },
    plugins: {
      title: {
        display: true,
        text: "line-basic · javascript · chartjs · anyplot.ai",
        color: t.ink,
        font: { size: 32, weight: "normal" },
        padding: { top: 8, bottom: 28 },
      },
      legend: { display: false },
    },
    scales: {
      x: {
        ticks: {
          color: t.inkSoft,
          font: { size: 18 },
          maxRotation: 0,
          autoSkip: true,
          autoSkipPadding: 24,
        },
        grid: { display: false },
        border: { display: false },
        title: {
          display: true,
          text: "Month",
          color: t.ink,
          font: { size: 18 },
          padding: { top: 12 },
        },
      },
      y: {
        ticks: {
          color: t.inkSoft,
          font: { size: 18 },
          callback: (v) => `${v}°C`,
        },
        grid: { color: t.grid },
        border: { display: false },
        title: {
          display: true,
          text: "Mean monthly temperature, Berlin",
          color: t.ink,
          font: { size: 22 },
          padding: { bottom: 12 },
        },
      },
    },
  },
});
Runnable source as JSON, for any HTTP client: https://api.anyplot.ai/specs/line-basic/chartjs/code. Any spec id and library id listed in llms-full.txt fit the same URL shape; every URL below is complete and callable.
{
  "spec_id": "line-basic",
  "language": "javascript",
  "library": "chartjs",
  "page": "https://anyplot.ai/line-basic/javascript/chartjs",
  "hub": "https://anyplot.ai/line-basic",
  "code_json": "https://api.anyplot.ai/specs/line-basic/chartjs/code",
  "spec_json": "https://api.anyplot.ai/specs/line-basic",
  "render_light_png": "https://storage.googleapis.com/anyplot-images/plots/line-basic/javascript/chartjs/plot-light.png",
  "render_dark_png": "https://storage.googleapis.com/anyplot-images/plots/line-basic/javascript/chartjs/plot-dark.png",
  "interactive_light_html": "https://storage.googleapis.com/anyplot-images/plots/line-basic/javascript/chartjs/plot-light.html",
  "interactive_dark_html": "https://storage.googleapis.com/anyplot-images/plots/line-basic/javascript/chartjs/plot-dark.html",
  "quality_score": 87.0,
  "license": "MIT",
  "guide": "https://anyplot.ai/llms.txt"
}
Part of Basic Line Plot on anyplot.ai.