The same plot in 14 other libraries — JavaScript: Chart.js, D3.js, Highcharts, MUI X Charts; Python: Altair, Bokeh, lets-plot, Matplotlib, Plotly, plotnine, Pygal, Seaborn; R: ggplot2; Julia: Makie.jl. Compare all 15 side by side: Basic Line Plot in Python, R, Julia and JavaScript.
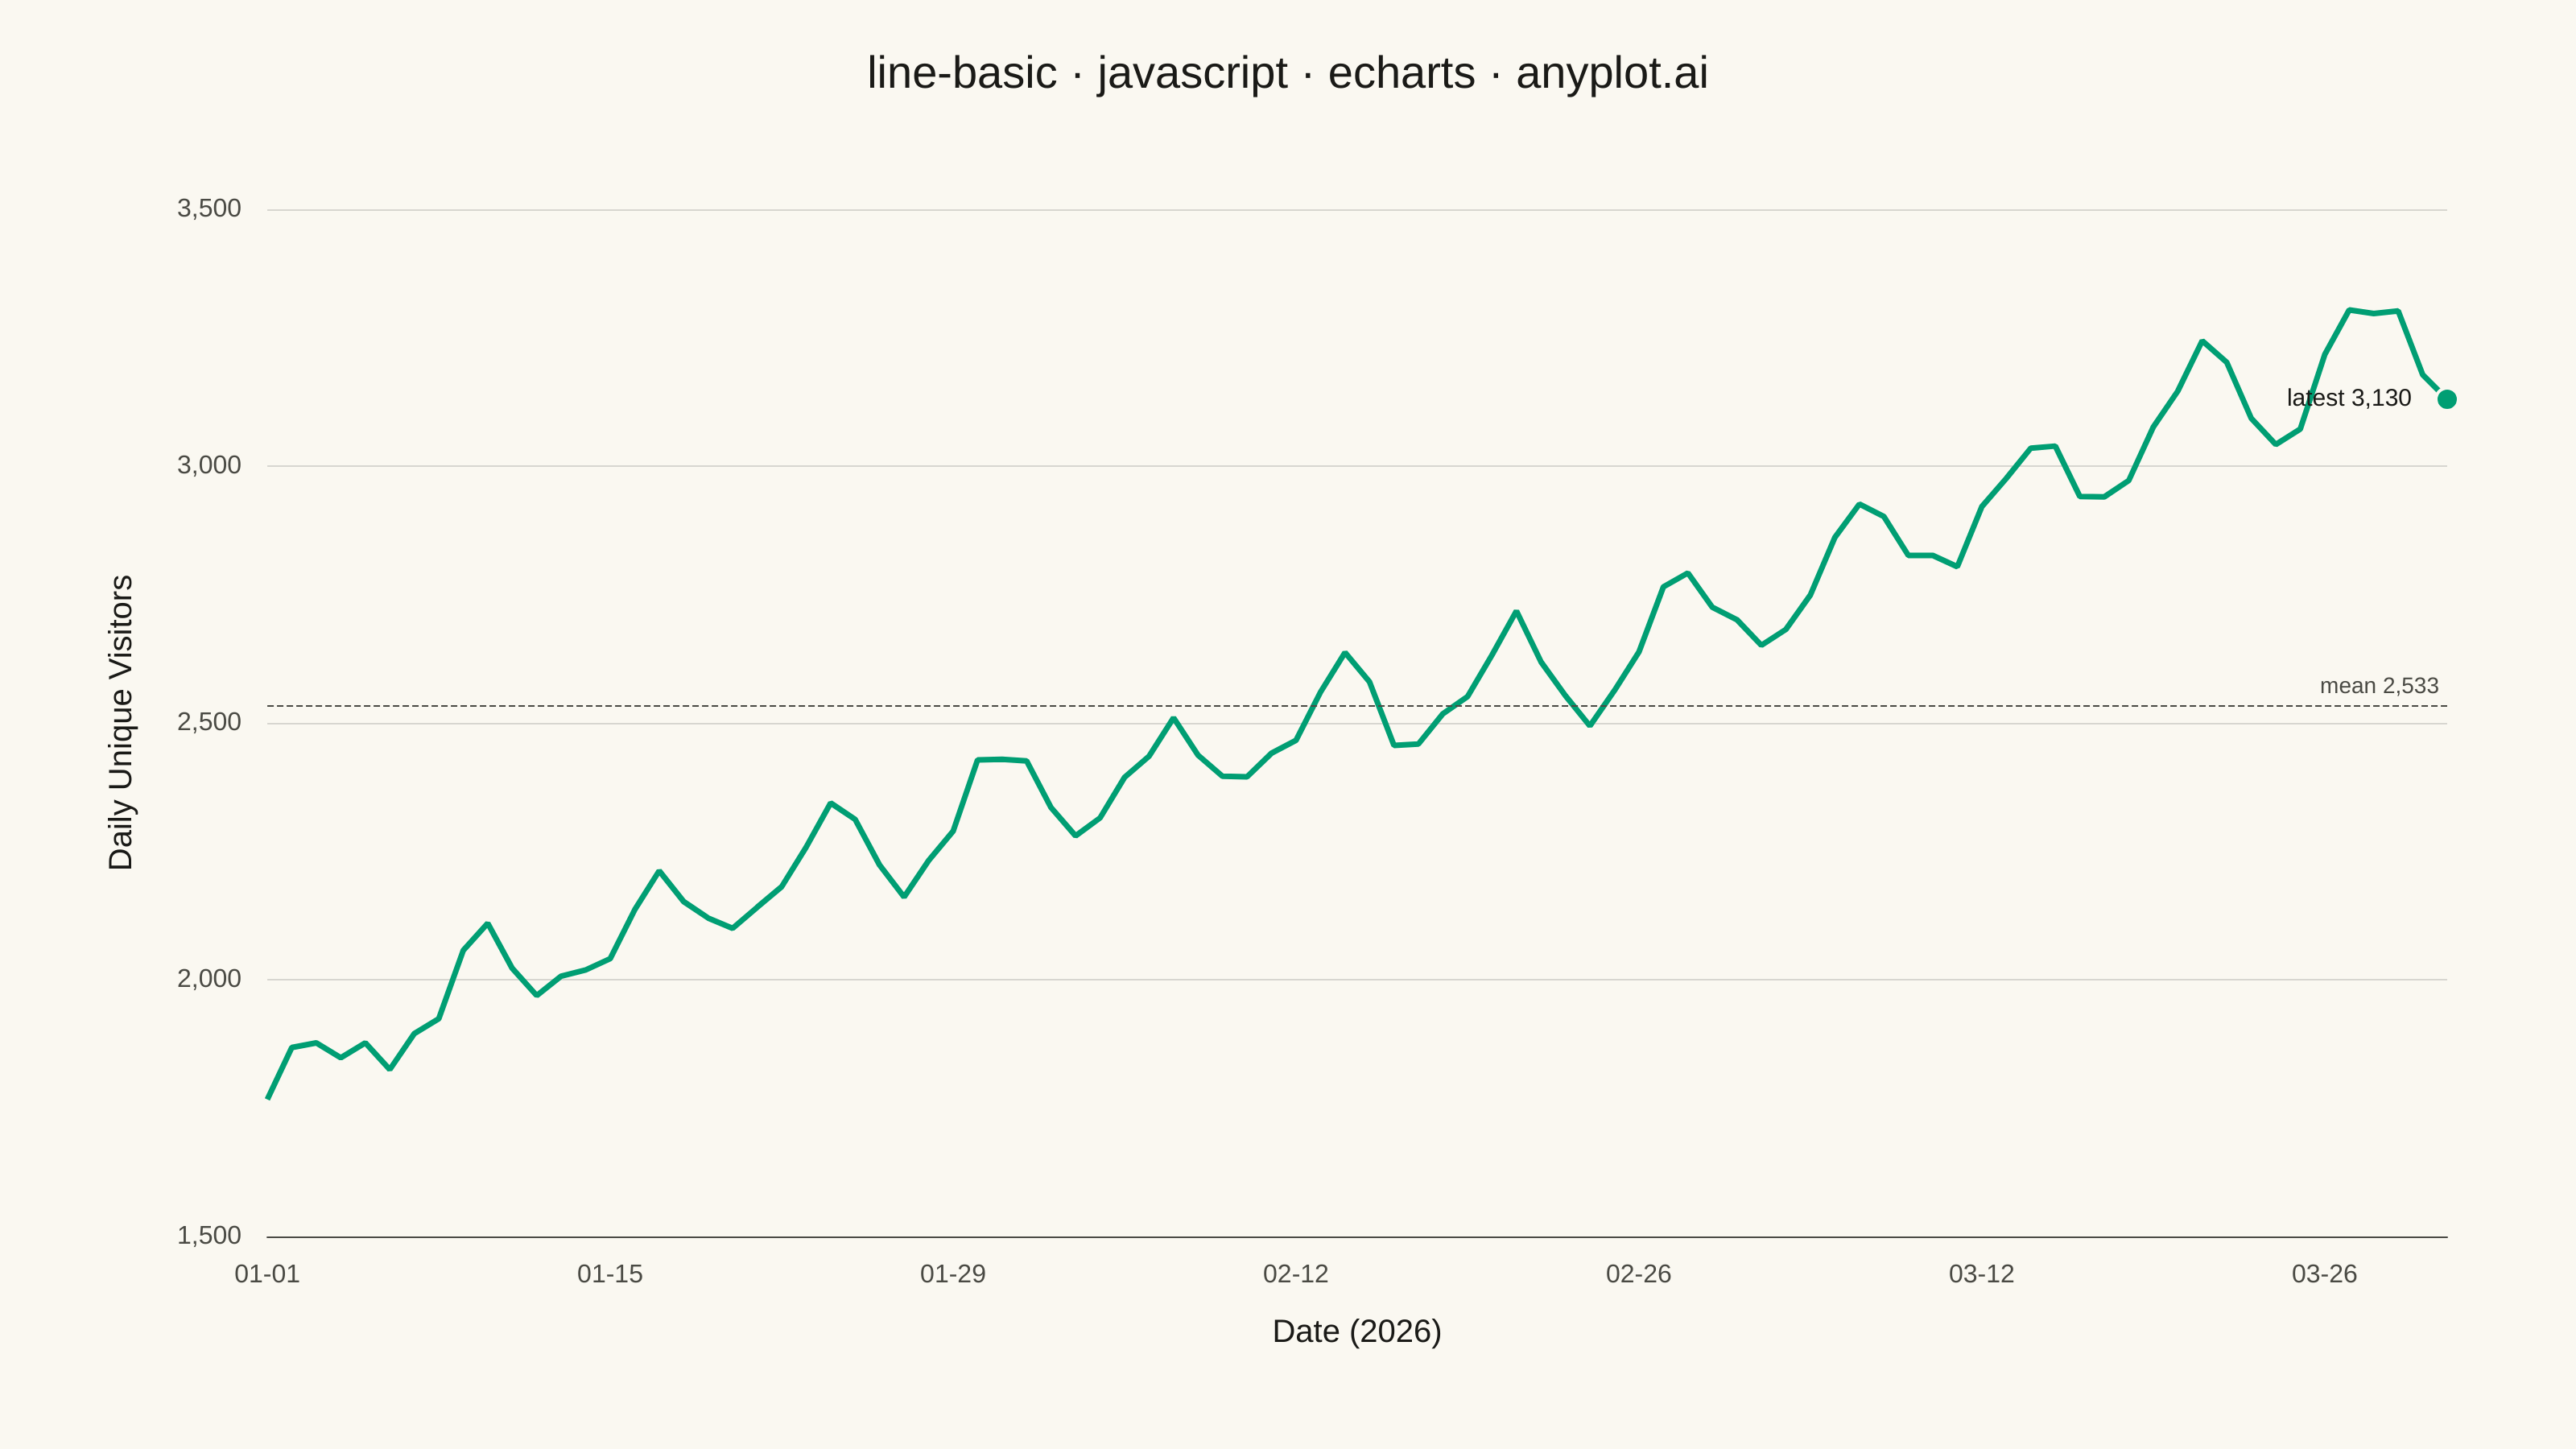
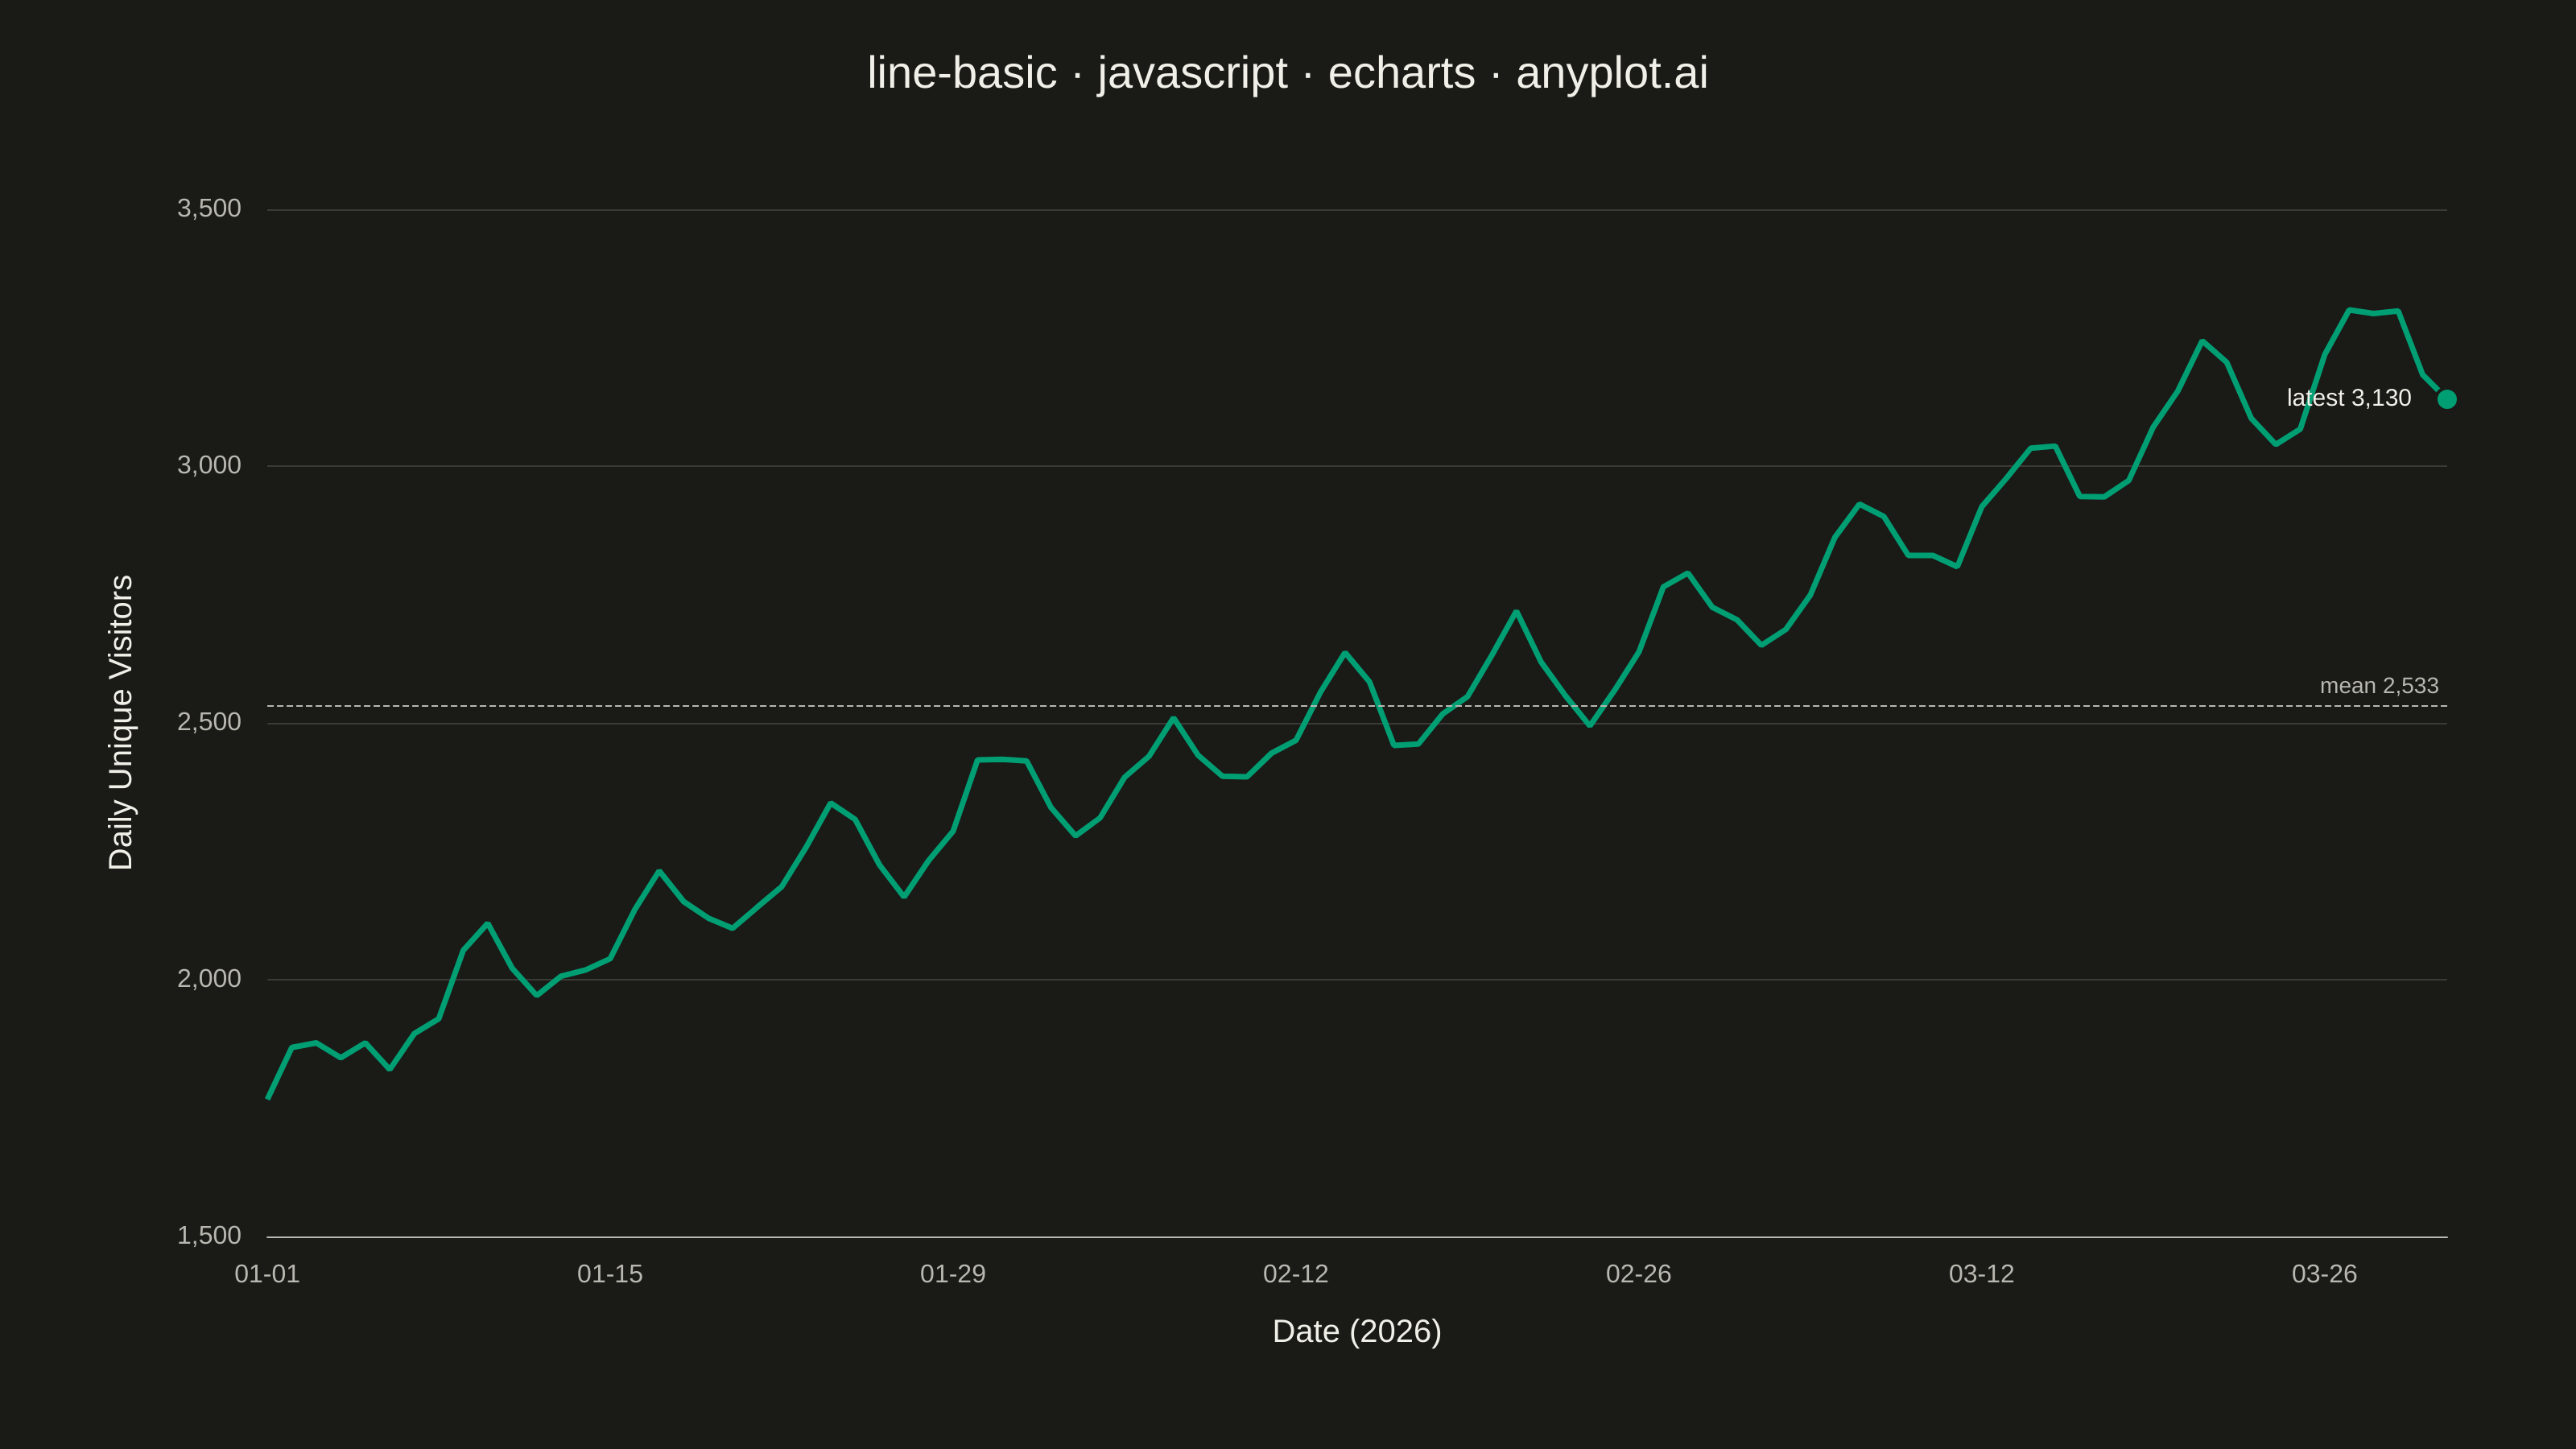
A basic line plot connects data points with straight lines to show how a continuous variable changes over a sequence or time. It's ideal for revealing trends, patterns, and changes in data over ordered intervals. The simplicity of a single-line design makes it easy to interpret at a glance.
// anyplot.ai
// line-basic: Basic Line Plot
// Library: echarts 5.5.1 | JavaScript 22.22.3
// Quality: 87/100 | Created: 2026-06-02
//# anyplot-orientation: landscape
// anyplot.ai
// line-basic: Basic Line Plot
// Library: echarts 5.x | JavaScript 22
// Quality: pending | Created: 2026-06-02

const t = window.ANYPLOT_TOKENS;

// Data — daily unique visitors over 90 days (deterministic LCG, fixed seed)
let seed = 42;
const rand = () => {
  seed = (seed * 1664525 + 1013904223) >>> 0;
  return seed / 4294967296;
};

const startDate = new Date(2026, 0, 1);
const days = 90;
const dates = [];
const visitors = [];
let base = 1800;
for (let i = 0; i < days; i++) {
  const d = new Date(startDate);
  d.setDate(startDate.getDate() + i);
  dates.push(`${String(d.getMonth() + 1).padStart(2, "0")}-${String(d.getDate()).padStart(2, "0")}`);
  base += (rand() - 0.45) * 60 + 12;
  const weekly = 90 * Math.sin((i / 7) * 2 * Math.PI);
  visitors.push(Math.round(base + weekly + (rand() - 0.5) * 80));
}

// Init
const chart = echarts.init(document.getElementById("container"));

// Option
chart.setOption({
  animation: false,
  color: t.palette,
  backgroundColor: "transparent",
  textStyle: { color: t.inkSoft, fontFamily: "Helvetica, Arial, sans-serif" },
  title: {
    text: "line-basic · javascript · echarts · anyplot.ai",
    left: "center",
    top: 28,
    textStyle: { color: t.ink, fontSize: 28, fontWeight: 500 },
  },
  grid: { left: 110, right: 80, top: 130, bottom: 100, containLabel: true },
  xAxis: {
    type: "category",
    data: dates,
    boundaryGap: false,
    name: "Date (2026)",
    nameLocation: "middle",
    nameGap: 50,
    nameTextStyle: { color: t.ink, fontSize: 20 },
    axisLabel: {
      color: t.inkSoft,
      fontSize: 16,
      interval: 13,
      margin: 16,
    },
    axisLine: { lineStyle: { color: t.inkSoft } },
    axisTick: { show: false },
    splitLine: { show: false },
  },
  yAxis: {
    type: "value",
    name: "Daily Unique Visitors",
    nameLocation: "middle",
    nameGap: 80,
    nameTextStyle: { color: t.ink, fontSize: 20 },
    min: 1500,
    max: 3500,
    axisLabel: {
      color: t.inkSoft,
      fontSize: 16,
      margin: 16,
      formatter: (v) => v.toLocaleString("en-US"),
    },
    axisLine: { show: false },
    axisTick: { show: false },
    splitLine: { lineStyle: { color: t.grid, width: 1 } },
  },
  series: [
    {
      type: "line",
      data: visitors,
      showSymbol: false,
      lineStyle: { color: t.palette[0], width: 3.5 },
      itemStyle: { color: t.palette[0] },
      emphasis: { focus: "series" },
      markLine: {
        symbol: "none",
        silent: true,
        lineStyle: { color: t.inkSoft, type: "dashed", width: 1 },
        label: {
          color: t.inkSoft,
          fontSize: 14,
          formatter: (p) => `mean ${Math.round(p.value).toLocaleString("en-US")}`,
          position: "insideEndTop",
        },
        data: [{ type: "average" }],
      },
      markPoint: {
        symbol: "circle",
        symbolSize: 14,
        itemStyle: { color: t.palette[0], borderColor: t.pageBg, borderWidth: 2 },
        label: {
          color: t.ink,
          fontSize: 15,
          fontWeight: 500,
          position: "left",
          distance: 14,
          formatter: (p) => `latest ${p.value.toLocaleString("en-US")}`,
        },
        data: [
          {
            coord: [dates[dates.length - 1], visitors[visitors.length - 1]],
            value: visitors[visitors.length - 1],
          },
        ],
      },
    },
  ],
});

chart.on("finished", () => {
  window.__anyplotReady = true;
});
Runnable source as JSON, for any HTTP client: https://api.anyplot.ai/specs/line-basic/echarts/code. Any spec id and library id listed in llms-full.txt fit the same URL shape; every URL below is complete and callable.
{
  "spec_id": "line-basic",
  "language": "javascript",
  "library": "echarts",
  "page": "https://anyplot.ai/line-basic/javascript/echarts",
  "hub": "https://anyplot.ai/line-basic",
  "code_json": "https://api.anyplot.ai/specs/line-basic/echarts/code",
  "spec_json": "https://api.anyplot.ai/specs/line-basic",
  "render_light_png": "https://storage.googleapis.com/anyplot-images/plots/line-basic/javascript/echarts/plot-light.png",
  "render_dark_png": "https://storage.googleapis.com/anyplot-images/plots/line-basic/javascript/echarts/plot-dark.png",
  "interactive_light_html": "https://storage.googleapis.com/anyplot-images/plots/line-basic/javascript/echarts/plot-light.html",
  "interactive_dark_html": "https://storage.googleapis.com/anyplot-images/plots/line-basic/javascript/echarts/plot-dark.html",
  "quality_score": 87.0,
  "license": "MIT",
  "guide": "https://anyplot.ai/llms.txt"
}
Part of Basic Line Plot on anyplot.ai.