Source code in 15 libraries — Python: Altair, Bokeh, lets-plot, Matplotlib, Plotly, plotnine, Pygal, Seaborn; R: ggplot2; Julia: Makie.jl; JavaScript: Chart.js, D3.js, Apache ECharts, Highcharts, MUI X Charts.
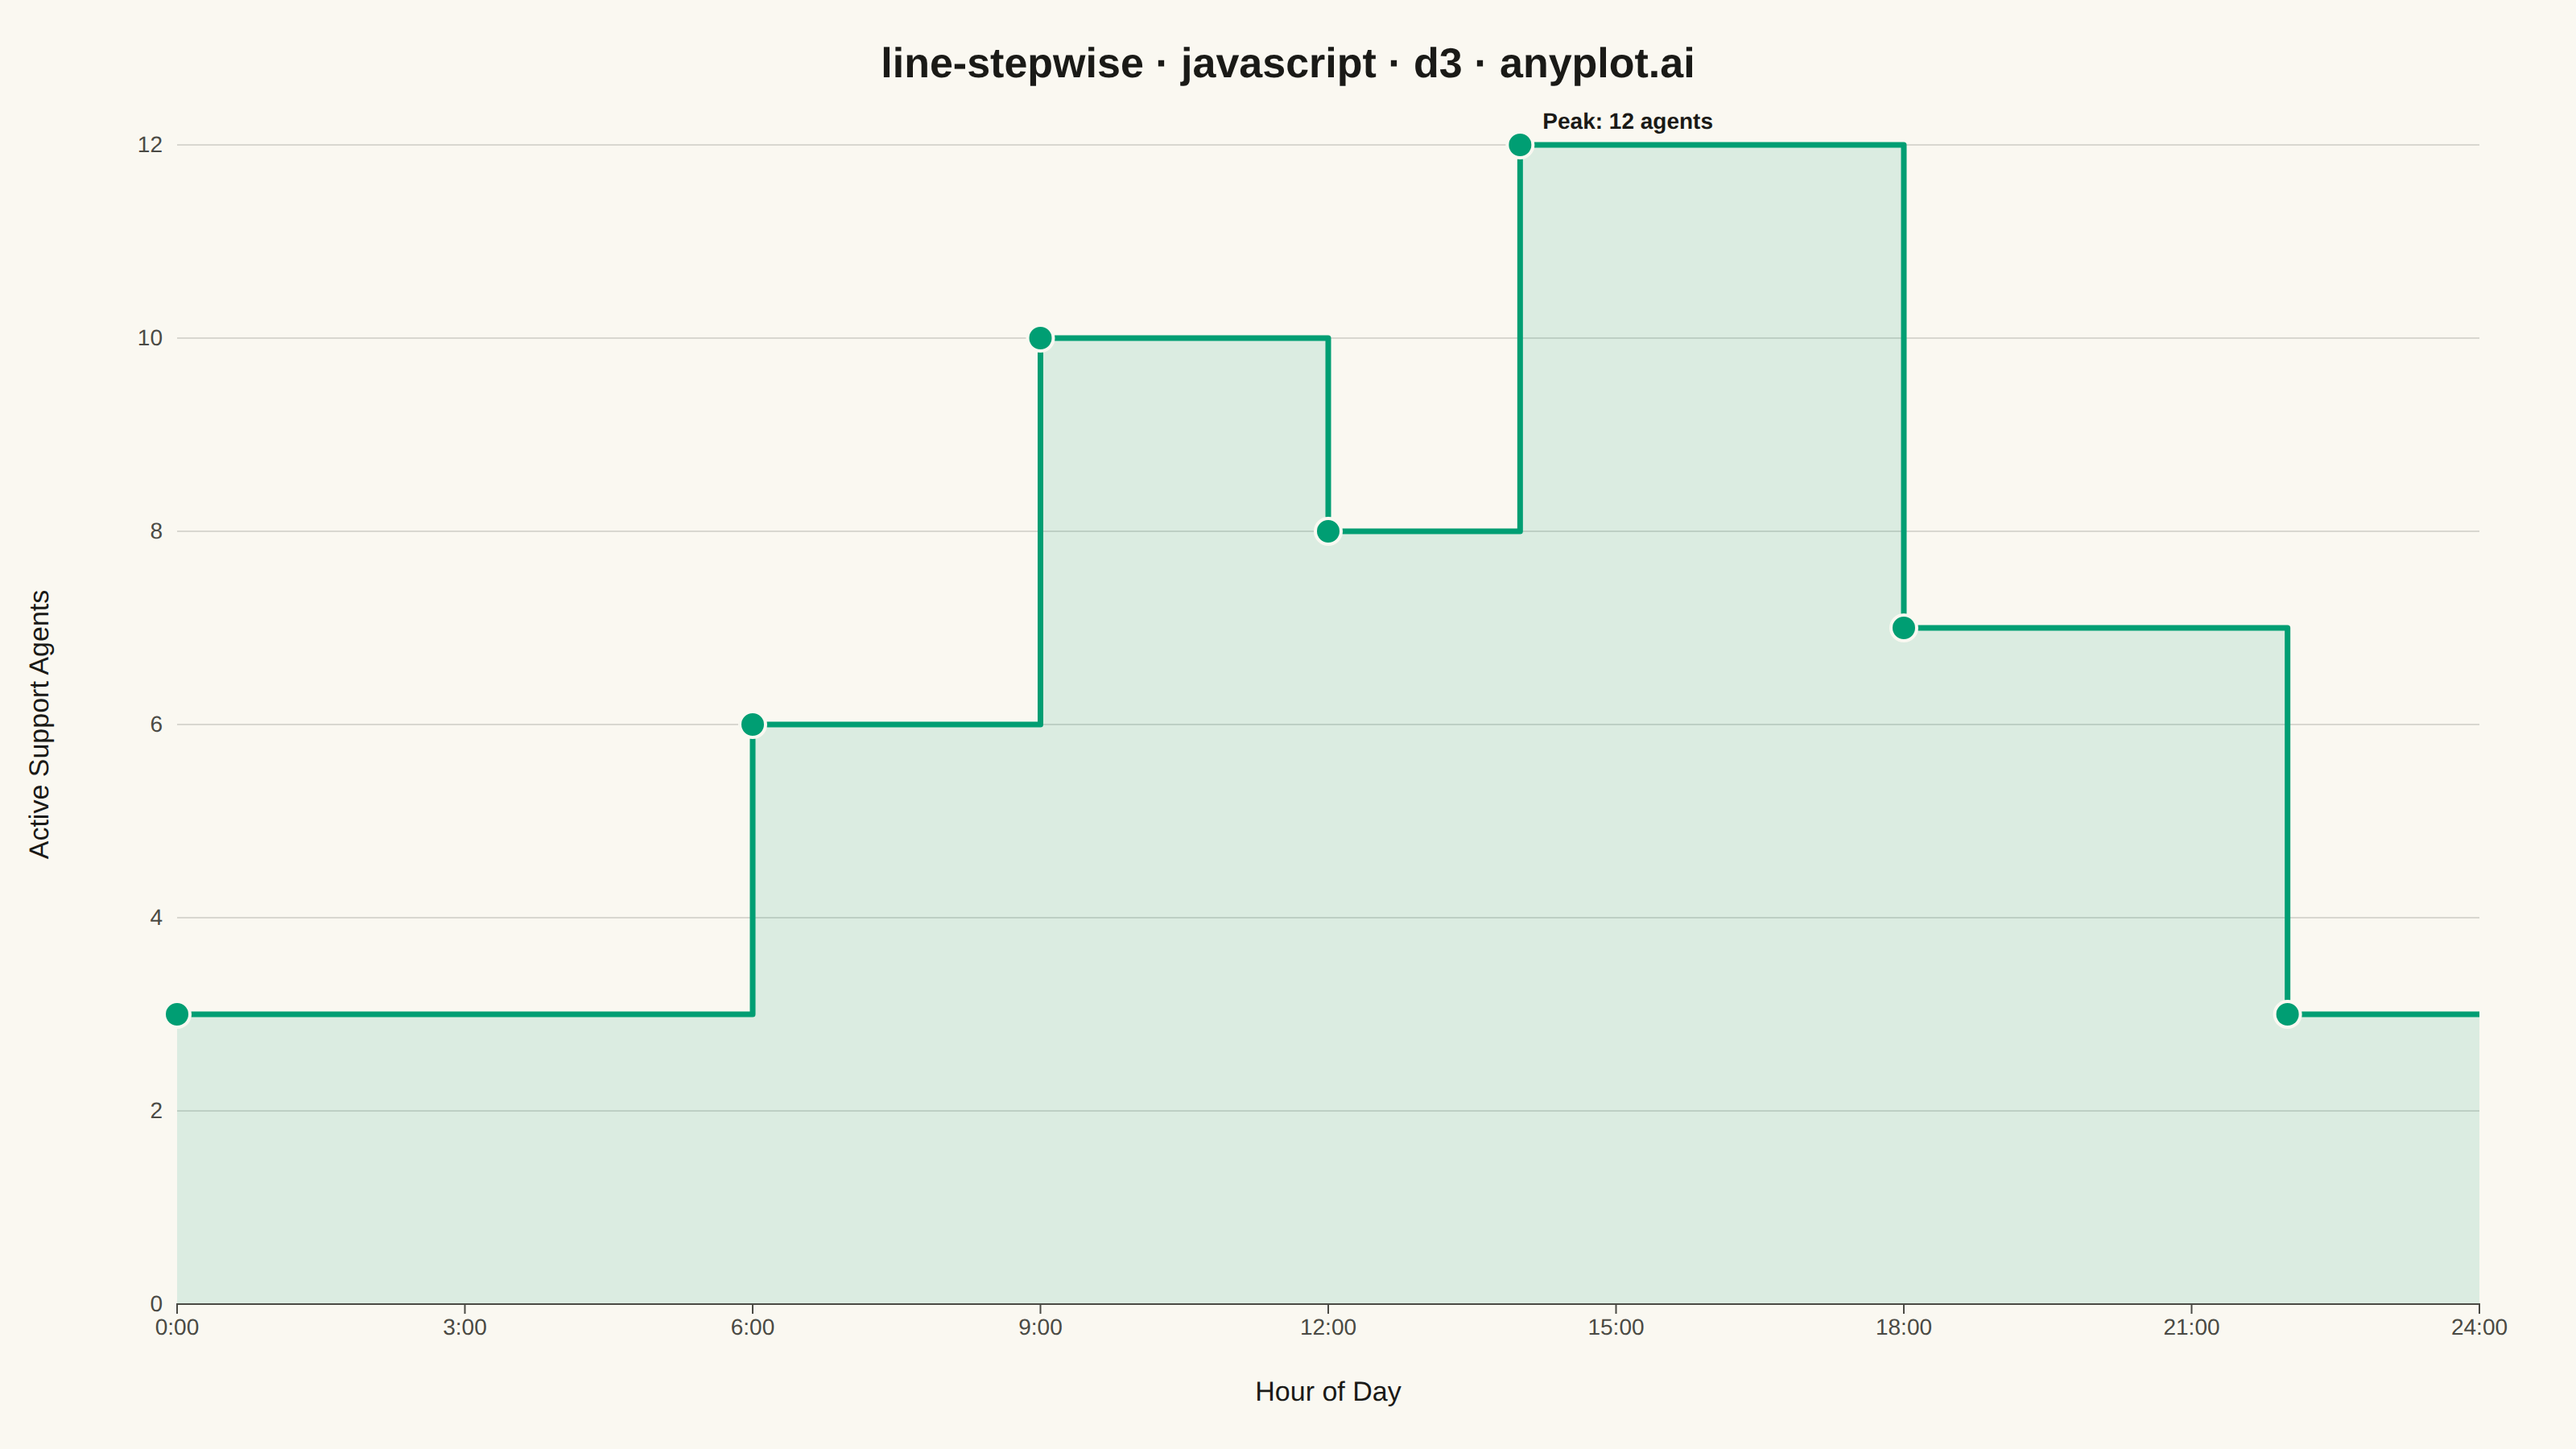
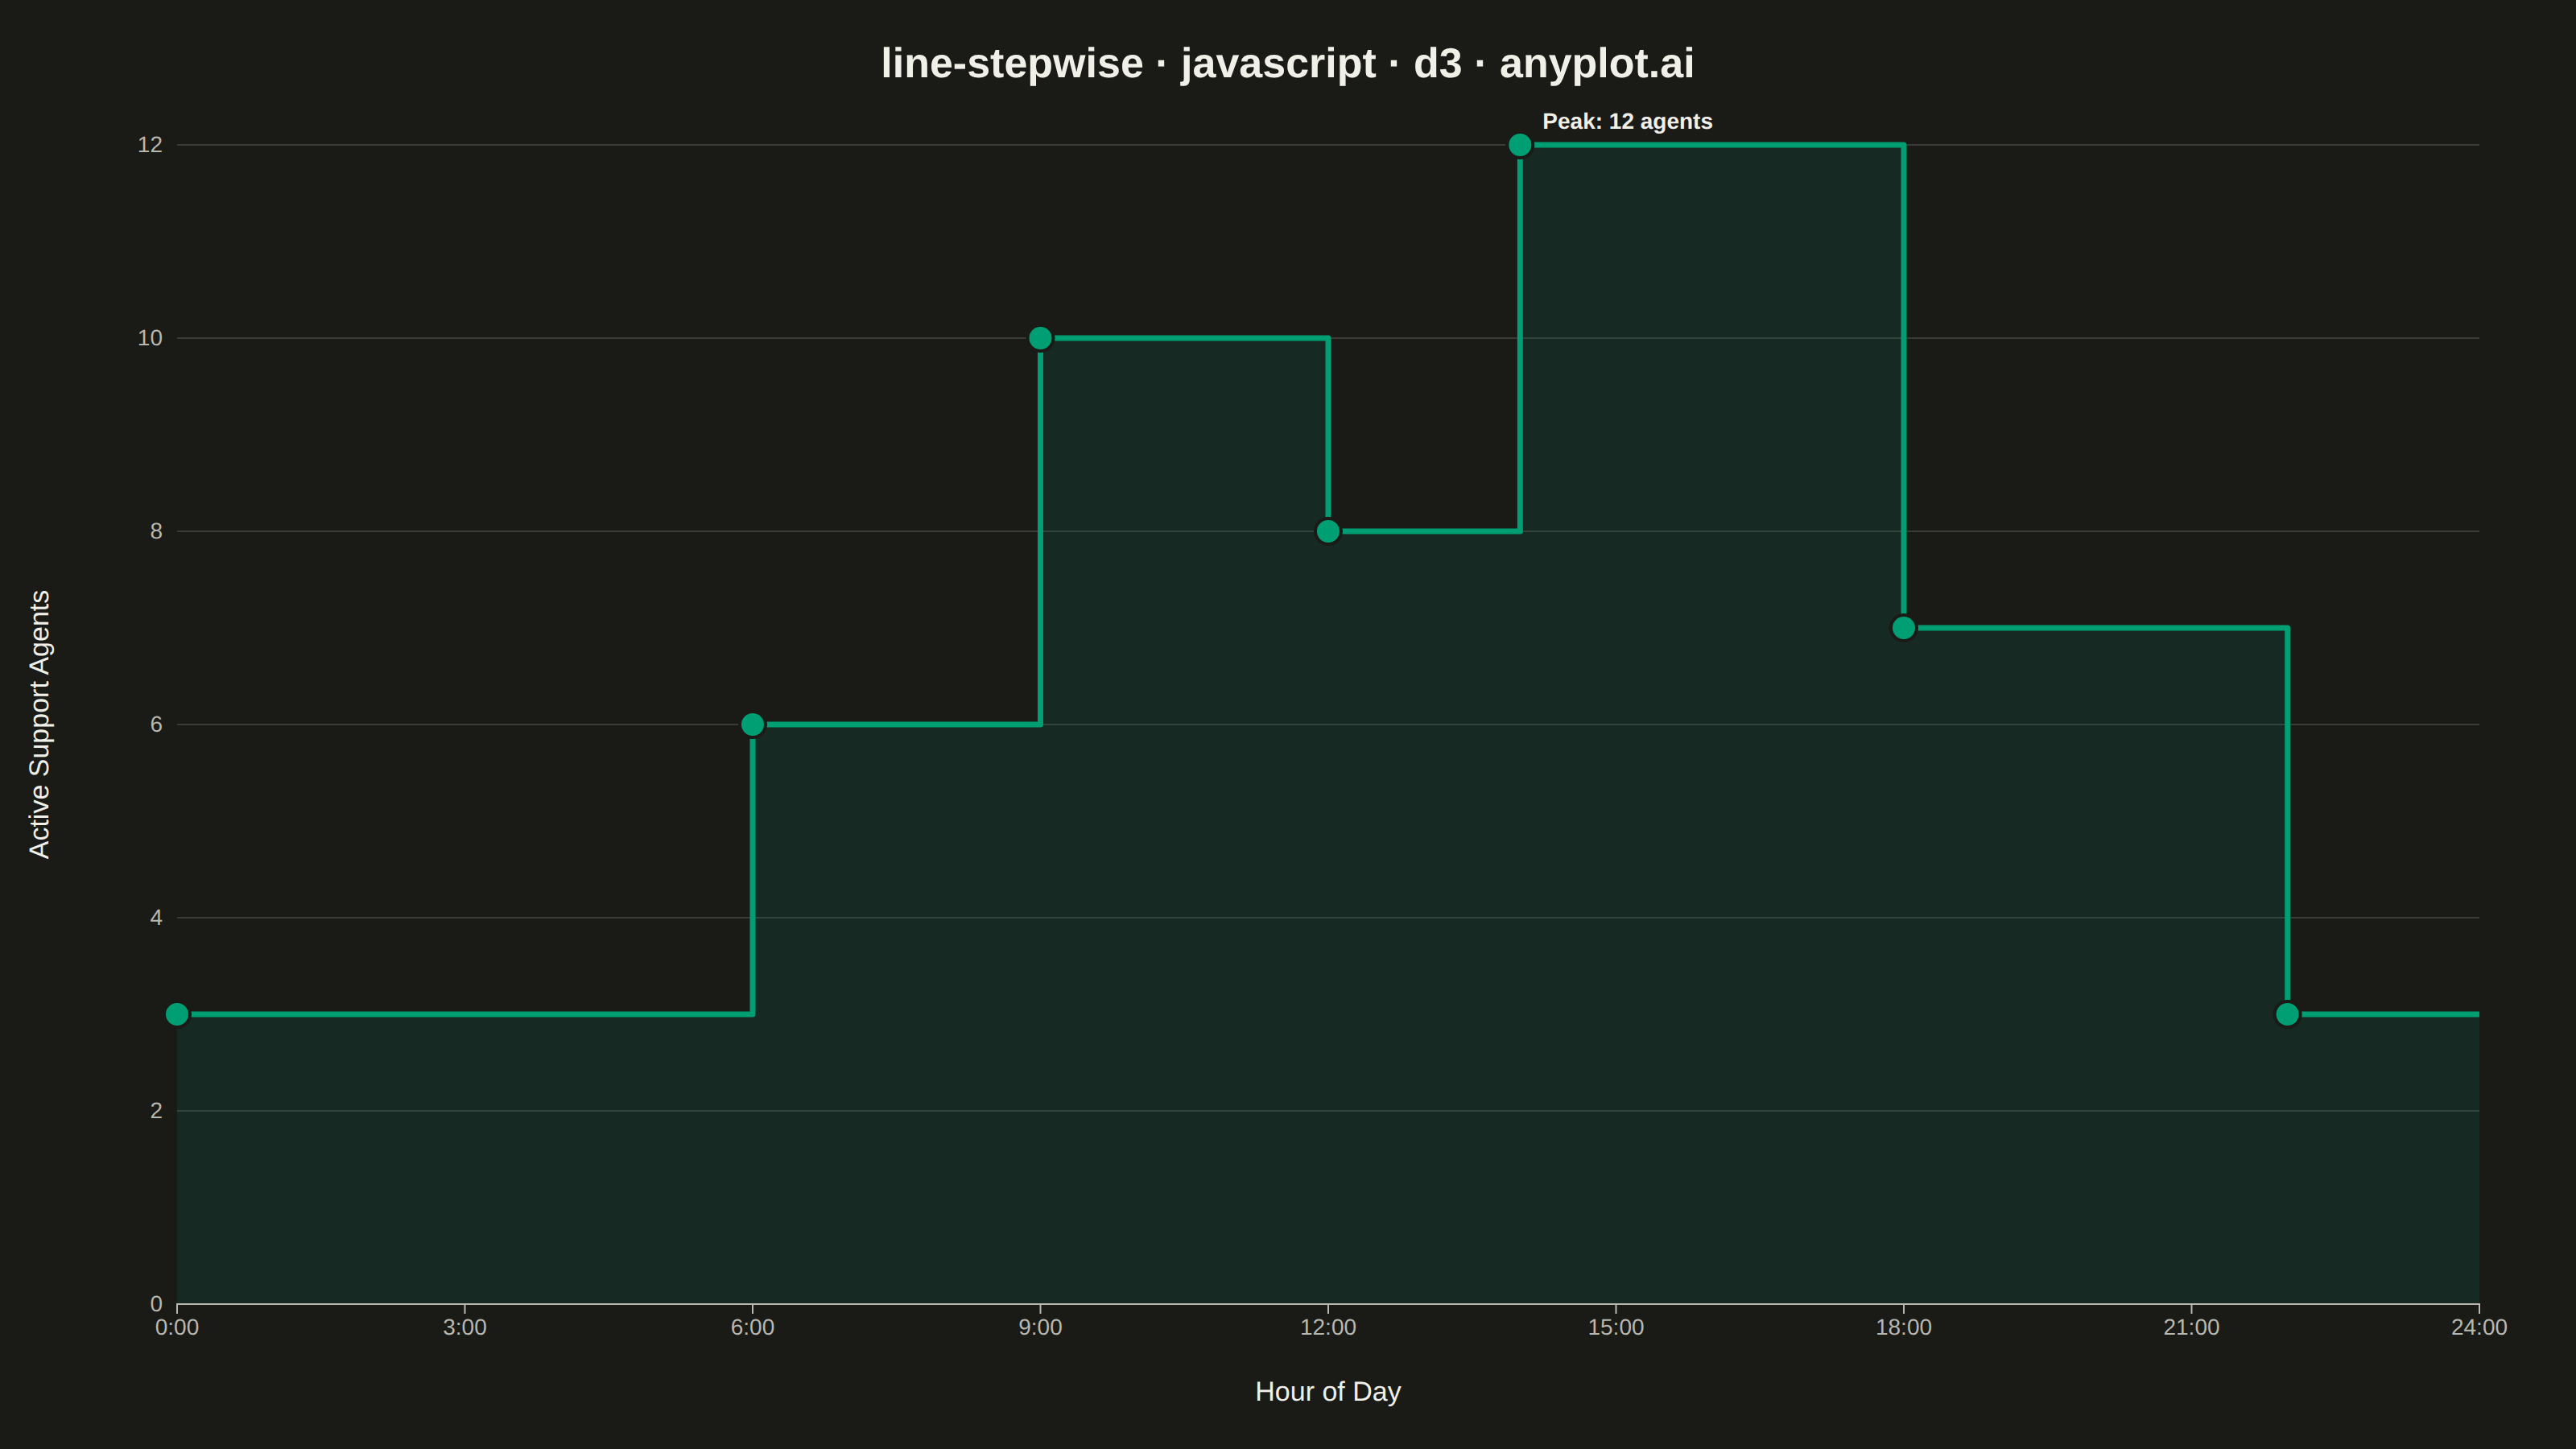
A step function plot where values remain constant until the next change, creating horizontal-then-vertical transitions. This visualization emphasizes discrete changes rather than interpolated values.
Preview render from the D3.js implementation.