The same plot in 14 other libraries — JavaScript: Chart.js, Apache ECharts, Highcharts, MUI X Charts; Python: Altair, Bokeh, lets-plot, Matplotlib, Plotly, plotnine, Pygal, Seaborn; R: ggplot2; Julia: Makie.jl. Compare all 15 side by side: Step Line Plot in Python, R, Julia and JavaScript.
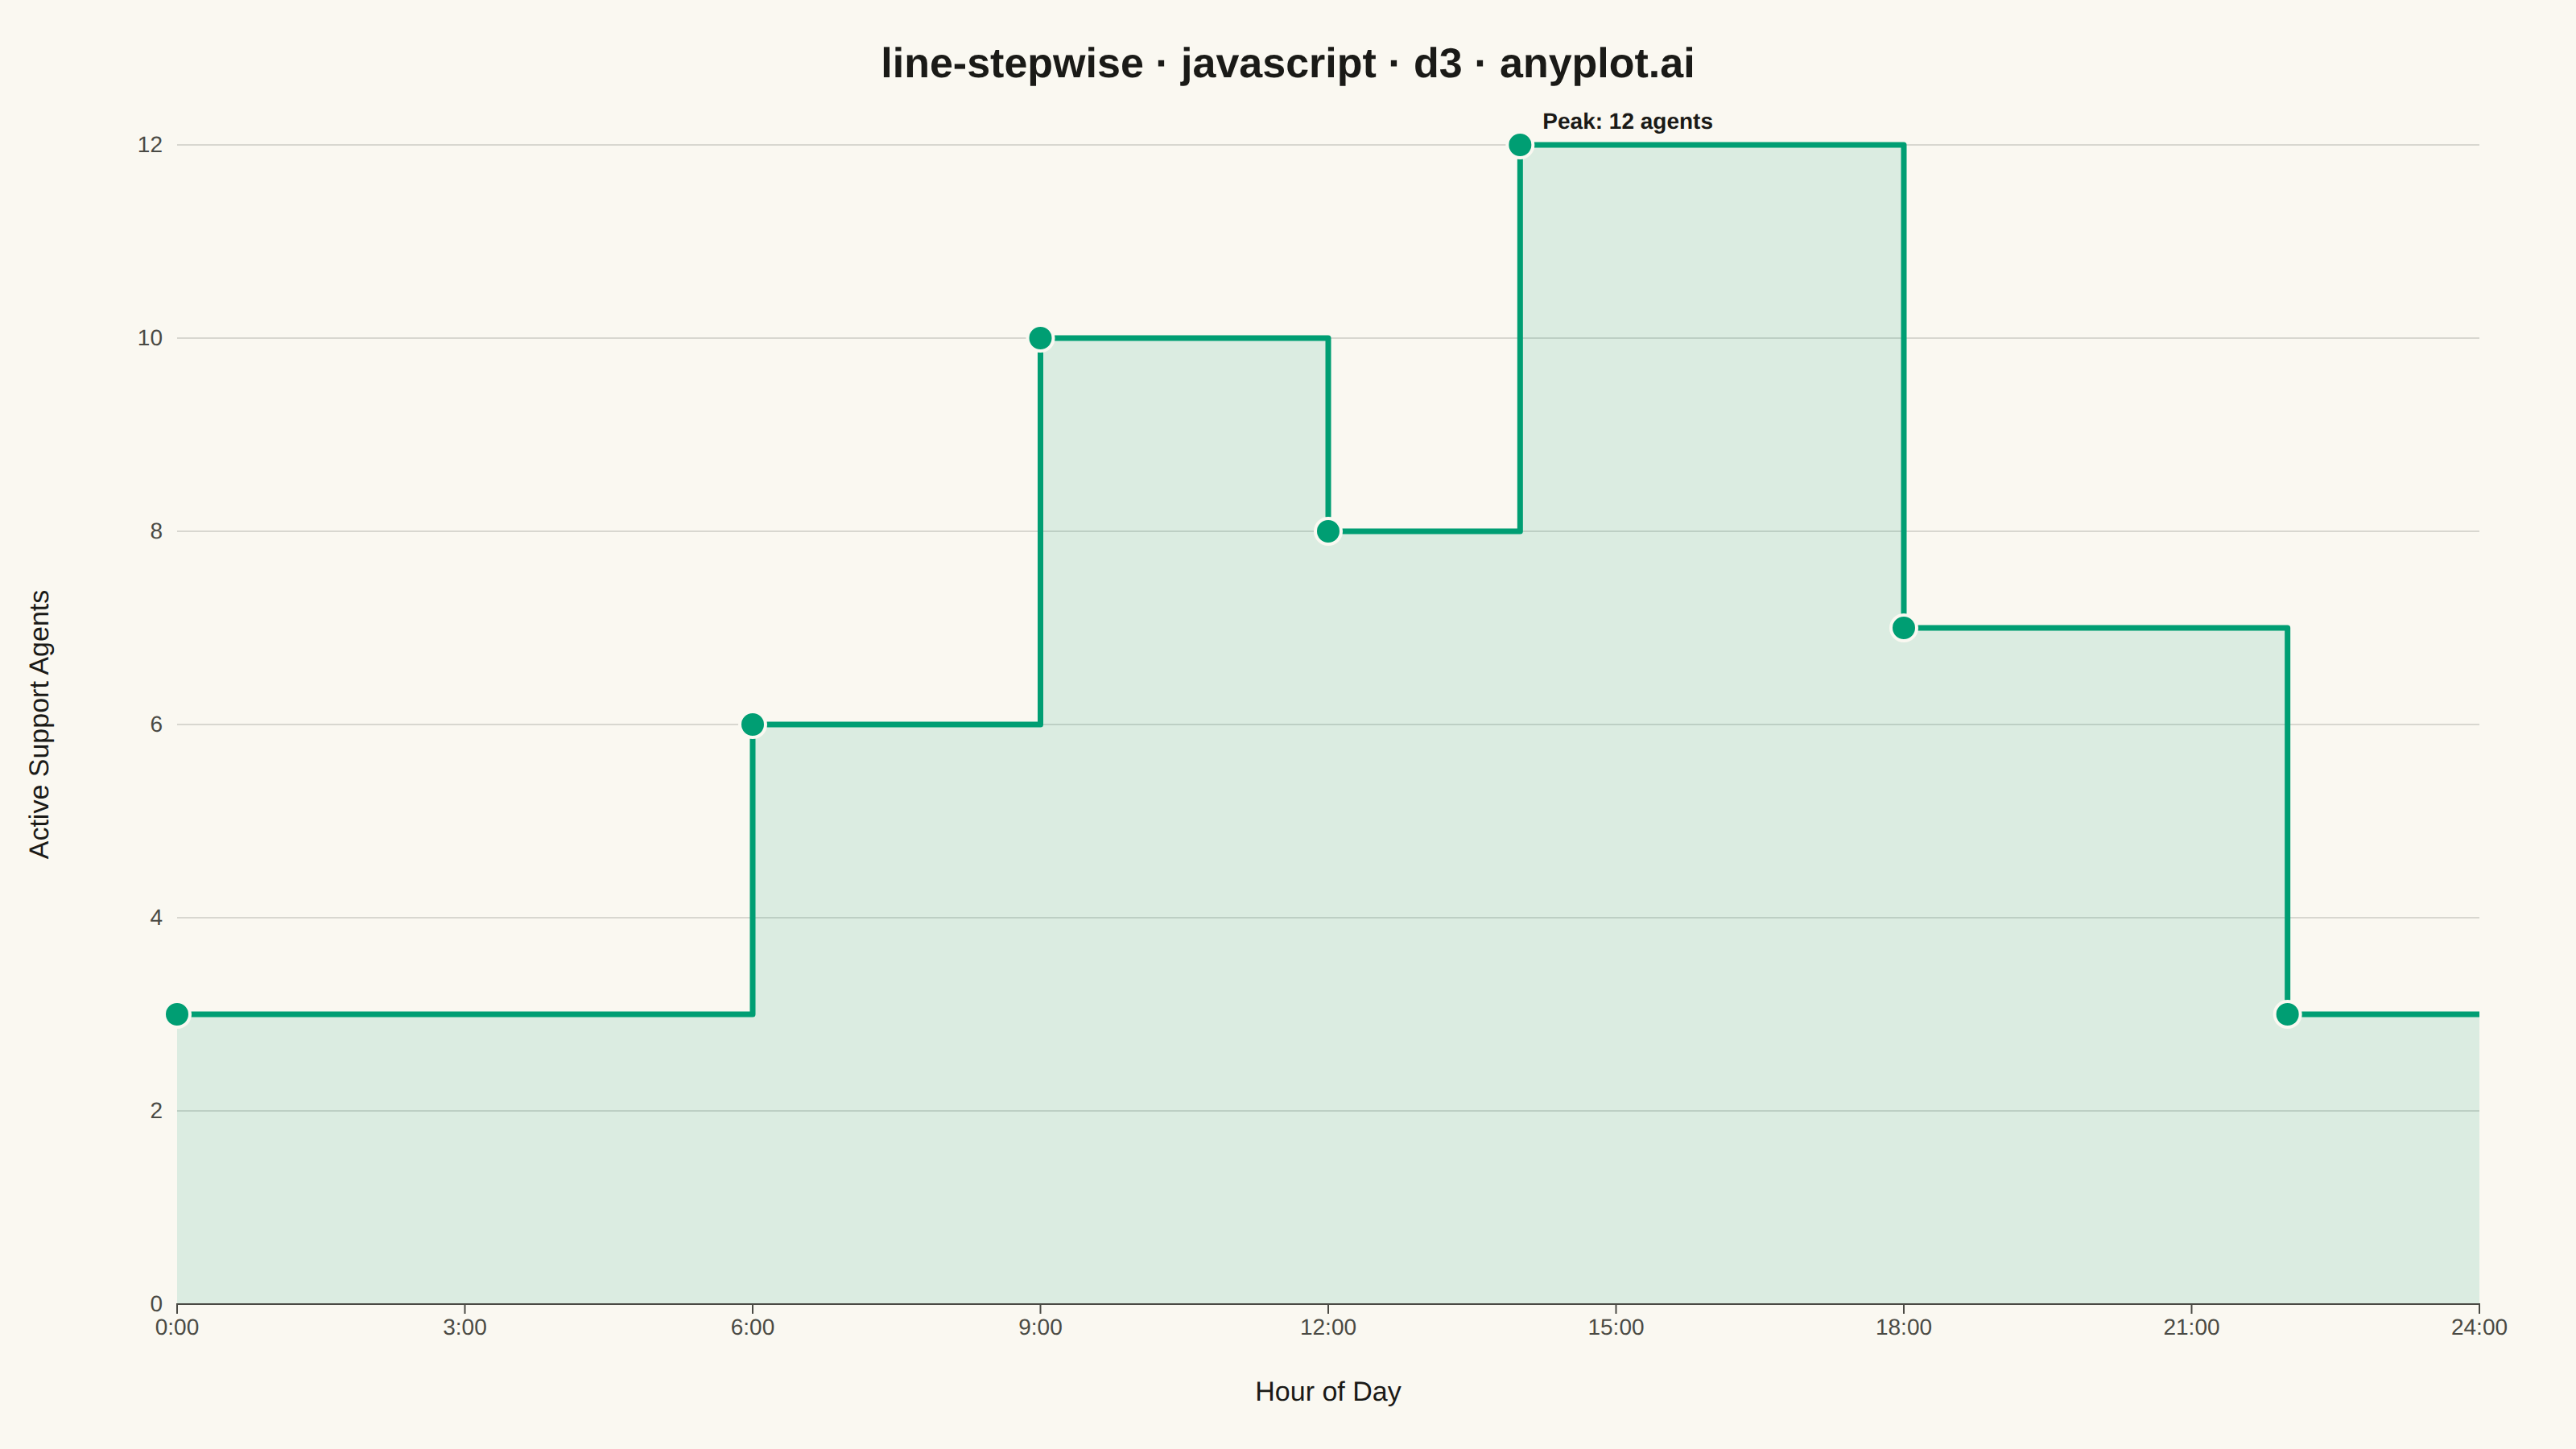
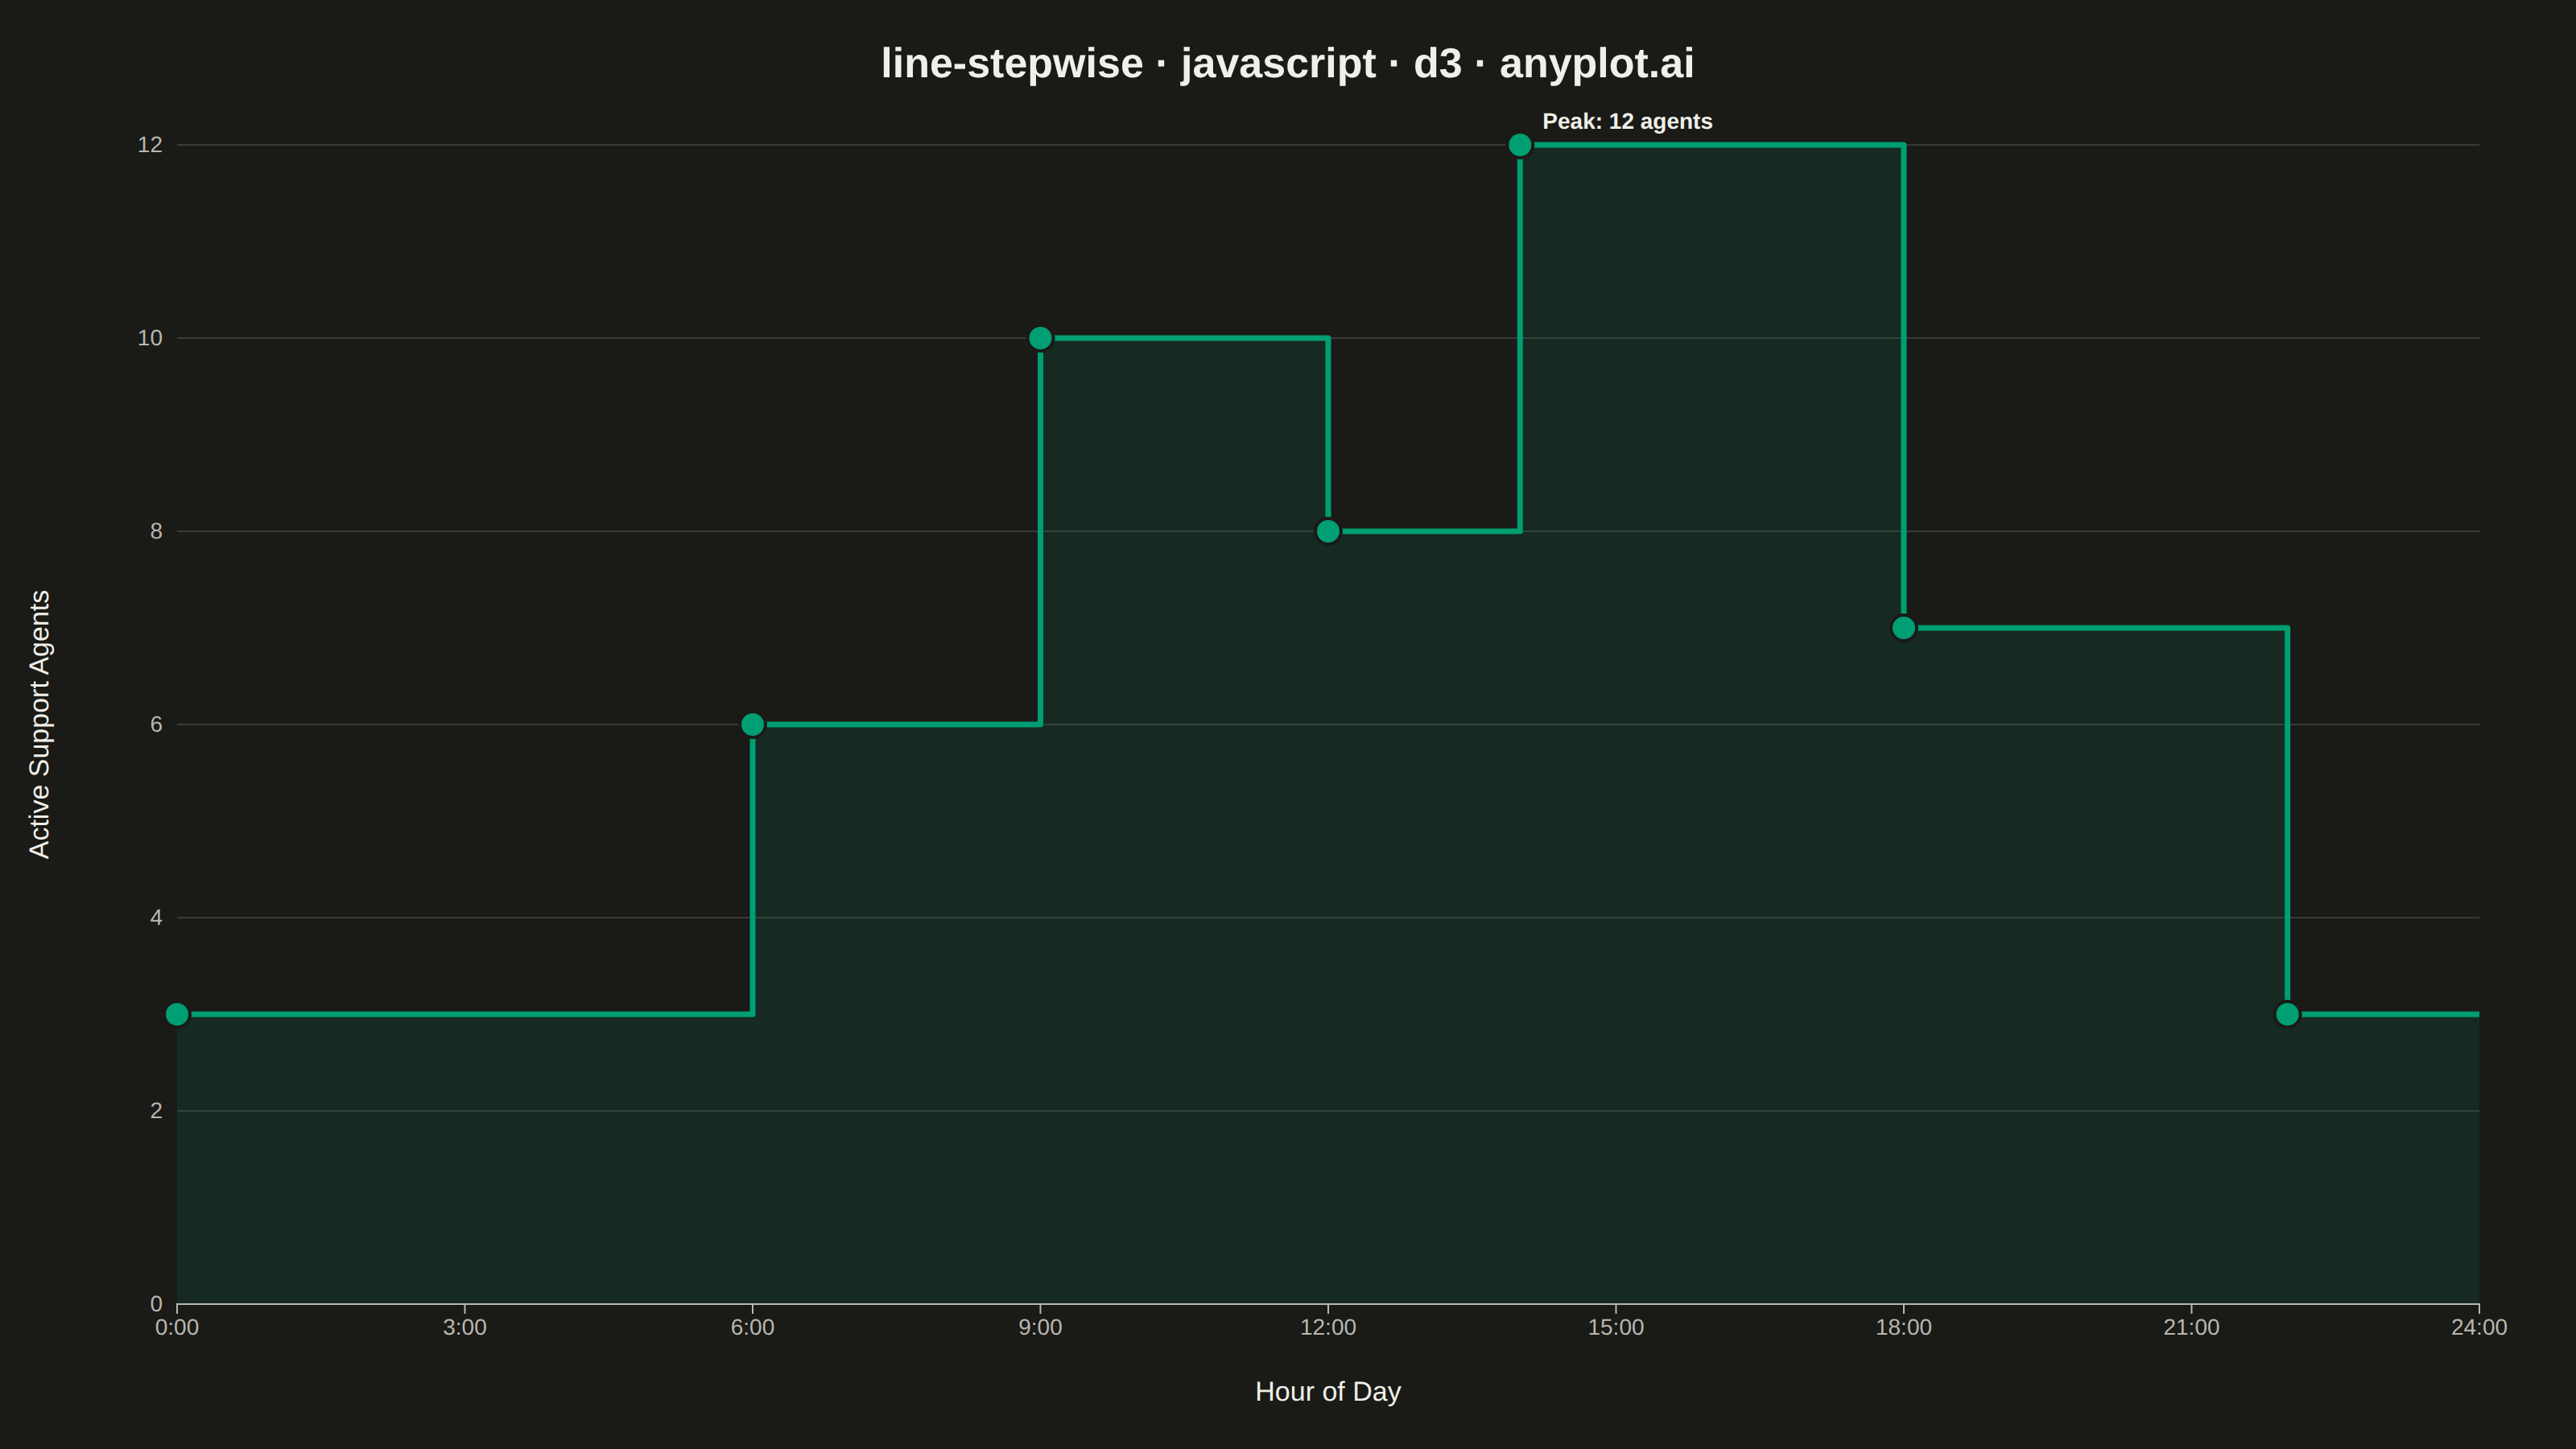
A step function plot where values remain constant until the next change, creating horizontal-then-vertical transitions. This visualization emphasizes discrete changes rather than interpolated values.
// anyplot.ai
// line-stepwise: Step Line Plot
// Library: d3 7.9.0 | JavaScript 22.23.2
// Quality: 94/100 | Created: 2026-09-05

const t = window.ANYPLOT_TOKENS;
const { width, height } = window.ANYPLOT_SIZE;
const margin = { top: 90, right: 60, bottom: 90, left: 110 };
const iw = width - margin.left - margin.right;
const ih = height - margin.top - margin.bottom;

// --- Data: call-center staffing level over a 24h shift schedule -------------
// Each point holds its agent count until the next shift change (step-after).
const staffing = [
  { hour: 0, agents: 3 },
  { hour: 6, agents: 3 },
  { hour: 6, agents: 6 },
  { hour: 9, agents: 6 },
  { hour: 9, agents: 10 },
  { hour: 12, agents: 10 },
  { hour: 12, agents: 8 },
  { hour: 14, agents: 8 },
  { hour: 14, agents: 12 },
  { hour: 18, agents: 12 },
  { hour: 18, agents: 7 },
  { hour: 22, agents: 7 },
  { hour: 22, agents: 3 },
  { hour: 24, agents: 3 },
];
// Vertices where the shift level actually changes (for the marker layer).
const changePoints = [
  { hour: 0, agents: 3 },
  { hour: 6, agents: 6 },
  { hour: 9, agents: 10 },
  { hour: 12, agents: 8 },
  { hour: 14, agents: 12 },
  { hour: 18, agents: 7 },
  { hour: 22, agents: 3 },
];

// --- SVG mount ----------------------------------------------------------------
const svg = d3.select("#container").append("svg").attr("width", width).attr("height", height);
const g = svg.append("g").attr("transform", `translate(${margin.left},${margin.top})`);

// --- Scales ---------------------------------------------------------------
const x = d3.scaleLinear().domain([0, 24]).range([0, iw]);
const y = d3
  .scaleLinear()
  .domain([0, d3.max(staffing, (d) => d.agents)])
  .nice()
  .range([ih, 0]);

// --- Y gridlines (subtle, data ink stays uncontested) ----------------------
g.append("g")
  .selectAll("line")
  .data(y.ticks(6))
  .join("line")
  .attr("x1", 0)
  .attr("x2", iw)
  .attr("y1", (d) => y(d))
  .attr("y2", (d) => y(d))
  .attr("stroke", t.grid)
  .attr("stroke-width", 1);

// --- Area fill under the step curve (brand color, low alpha) --------------
const area = d3
  .area()
  .curve(d3.curveStepAfter)
  .x((d) => x(d.hour))
  .y0(ih)
  .y1((d) => y(d.agents));

g.append("path").datum(staffing).attr("d", area).attr("fill", t.palette[0]).attr("fill-opacity", 0.12);

// --- Step line ---------------------------------------------------------------
const line = d3
  .line()
  .curve(d3.curveStepAfter)
  .x((d) => x(d.hour))
  .y((d) => y(d.agents));

g.append("path")
  .datum(staffing)
  .attr("d", line)
  .attr("fill", "none")
  .attr("stroke", t.palette[0])
  .attr("stroke-width", 3.5)
  .attr("stroke-linejoin", "round");

// --- Markers at each shift-change vertex -----------------------------------
g.selectAll("circle")
  .data(changePoints)
  .join("circle")
  .attr("cx", (d) => x(d.hour))
  .attr("cy", (d) => y(d.agents))
  .attr("r", 8)
  .attr("fill", t.palette[0])
  .attr("stroke", t.pageBg)
  .attr("stroke-width", 2);

// --- Peak callout (highlights the single highest staffing vertex) ---------
const peak = changePoints.reduce((a, b) => (b.agents > a.agents ? b : a));
g.append("text")
  .attr("x", x(peak.hour) + 14)
  .attr("y", y(peak.agents) - 10)
  .attr("text-anchor", "start")
  .attr("fill", t.ink)
  .style("font-size", "14px")
  .style("font-weight", "600")
  .text(`Peak: ${peak.agents} agents`);

// --- Axes -------------------------------------------------------------------
const xAxis = g
  .append("g")
  .attr("transform", `translate(0,${ih})`)
  .call(
    d3
      .axisBottom(x)
      .tickValues([0, 3, 6, 9, 12, 15, 18, 21, 24])
      .tickFormat((d) => `${d}:00`),
  );
const yAxis = g.append("g").call(d3.axisLeft(y).ticks(6));
for (const ax of [xAxis, yAxis]) {
  ax.selectAll("text").attr("fill", t.inkSoft).style("font-size", "14px");
  ax.selectAll("line").attr("stroke", t.inkSoft);
  ax.select(".domain").attr("stroke", t.inkSoft);
}
// Hide the y-axis vertical domain line for a clean L-shape without a right/top frame.
yAxis.select(".domain").remove();
yAxis.selectAll("line").remove();

// --- Axis labels --------------------------------------------------------------
g.append("text")
  .attr("x", iw / 2)
  .attr("y", ih + 60)
  .attr("text-anchor", "middle")
  .attr("fill", t.ink)
  .style("font-size", "17px")
  .text("Hour of Day");

g.append("text")
  .attr("transform", "rotate(-90)")
  .attr("x", -ih / 2)
  .attr("y", -80)
  .attr("text-anchor", "middle")
  .attr("fill", t.ink)
  .style("font-size", "17px")
  .text("Active Support Agents");

// --- Title --------------------------------------------------------------------
svg
  .append("text")
  .attr("x", width / 2)
  .attr("y", 48)
  .attr("text-anchor", "middle")
  .attr("fill", t.ink)
  .style("font-size", "26px")
  .style("font-weight", "700")
  .text("line-stepwise · javascript · d3 · anyplot.ai");
Runnable source as JSON, for any HTTP client: https://api.anyplot.ai/specs/line-stepwise/d3/code. Any spec id and library id listed in llms-full.txt fit the same URL shape; every URL below is complete and callable.
{
  "spec_id": "line-stepwise",
  "language": "javascript",
  "library": "d3",
  "page": "https://anyplot.ai/line-stepwise/javascript/d3",
  "hub": "https://anyplot.ai/line-stepwise",
  "code_json": "https://api.anyplot.ai/specs/line-stepwise/d3/code",
  "spec_json": "https://api.anyplot.ai/specs/line-stepwise",
  "render_light_png": "https://storage.googleapis.com/anyplot-images/plots/line-stepwise/javascript/d3/plot-light.png",
  "render_dark_png": "https://storage.googleapis.com/anyplot-images/plots/line-stepwise/javascript/d3/plot-dark.png",
  "interactive_light_html": "https://storage.googleapis.com/anyplot-images/plots/line-stepwise/javascript/d3/plot-light.html",
  "interactive_dark_html": "https://storage.googleapis.com/anyplot-images/plots/line-stepwise/javascript/d3/plot-dark.html",
  "quality_score": 94.0,
  "license": "MIT",
  "guide": "https://anyplot.ai/llms.txt"
}
Part of Step Line Plot on anyplot.ai.