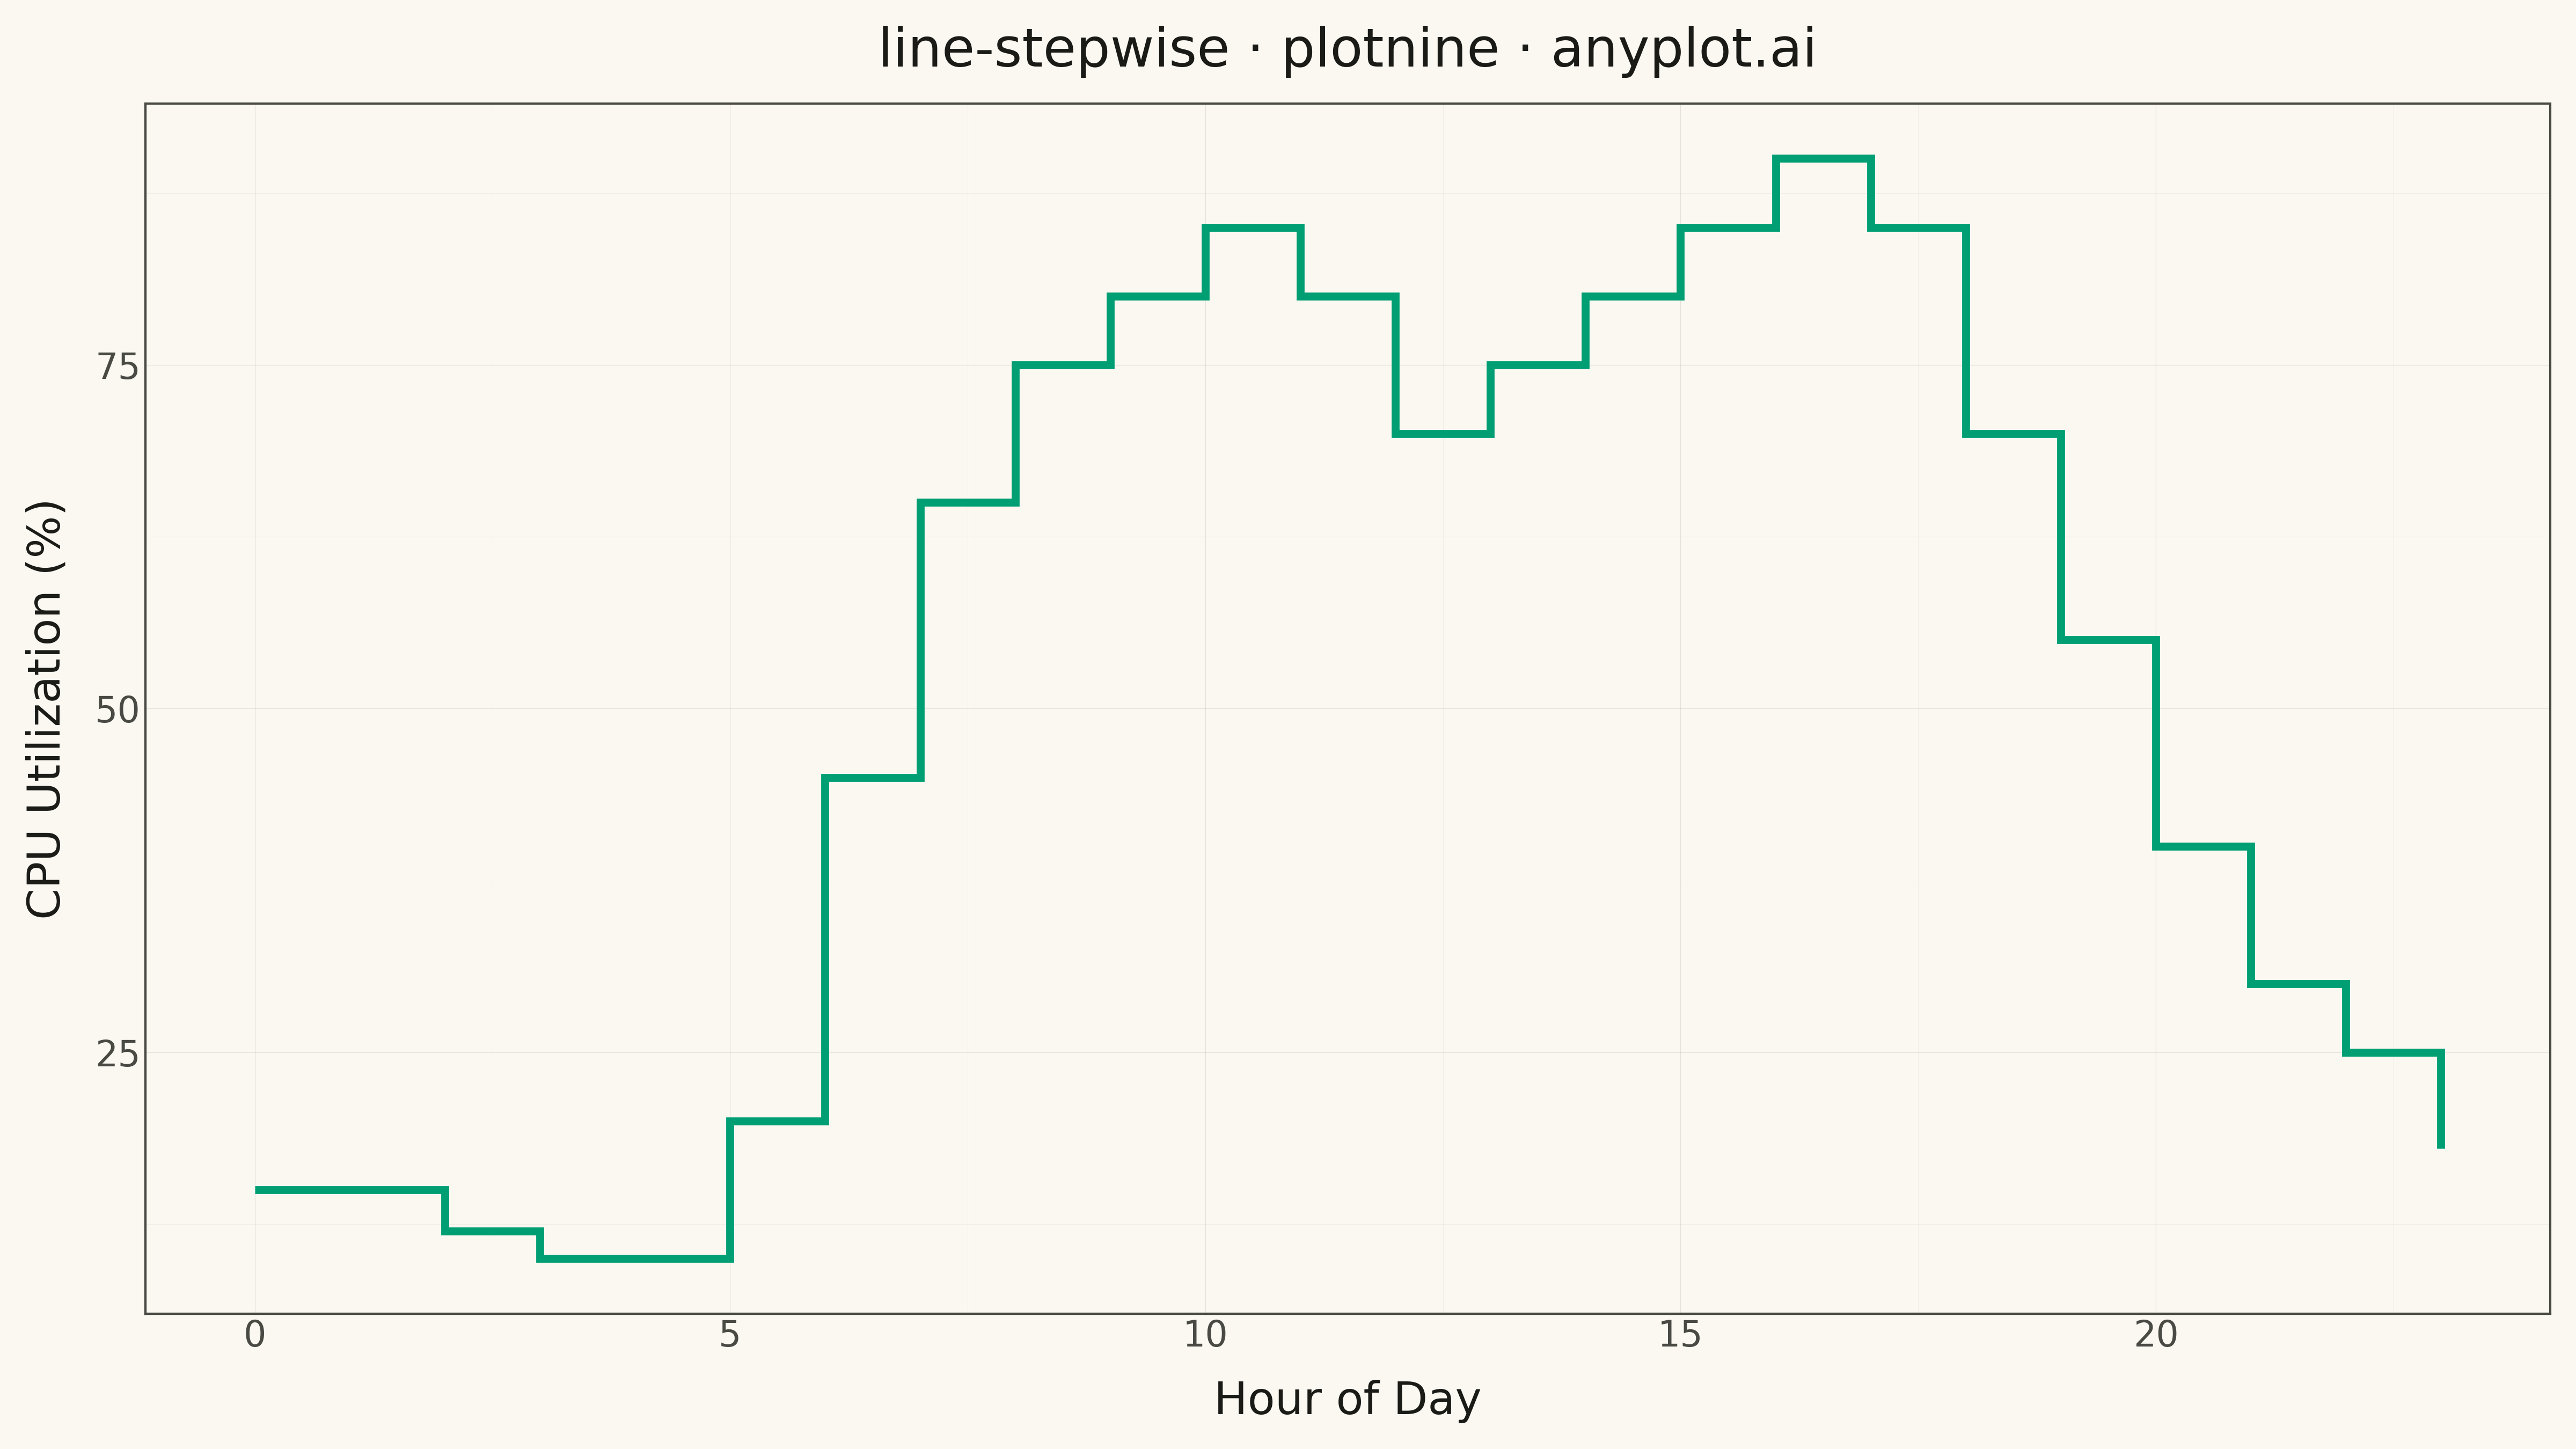
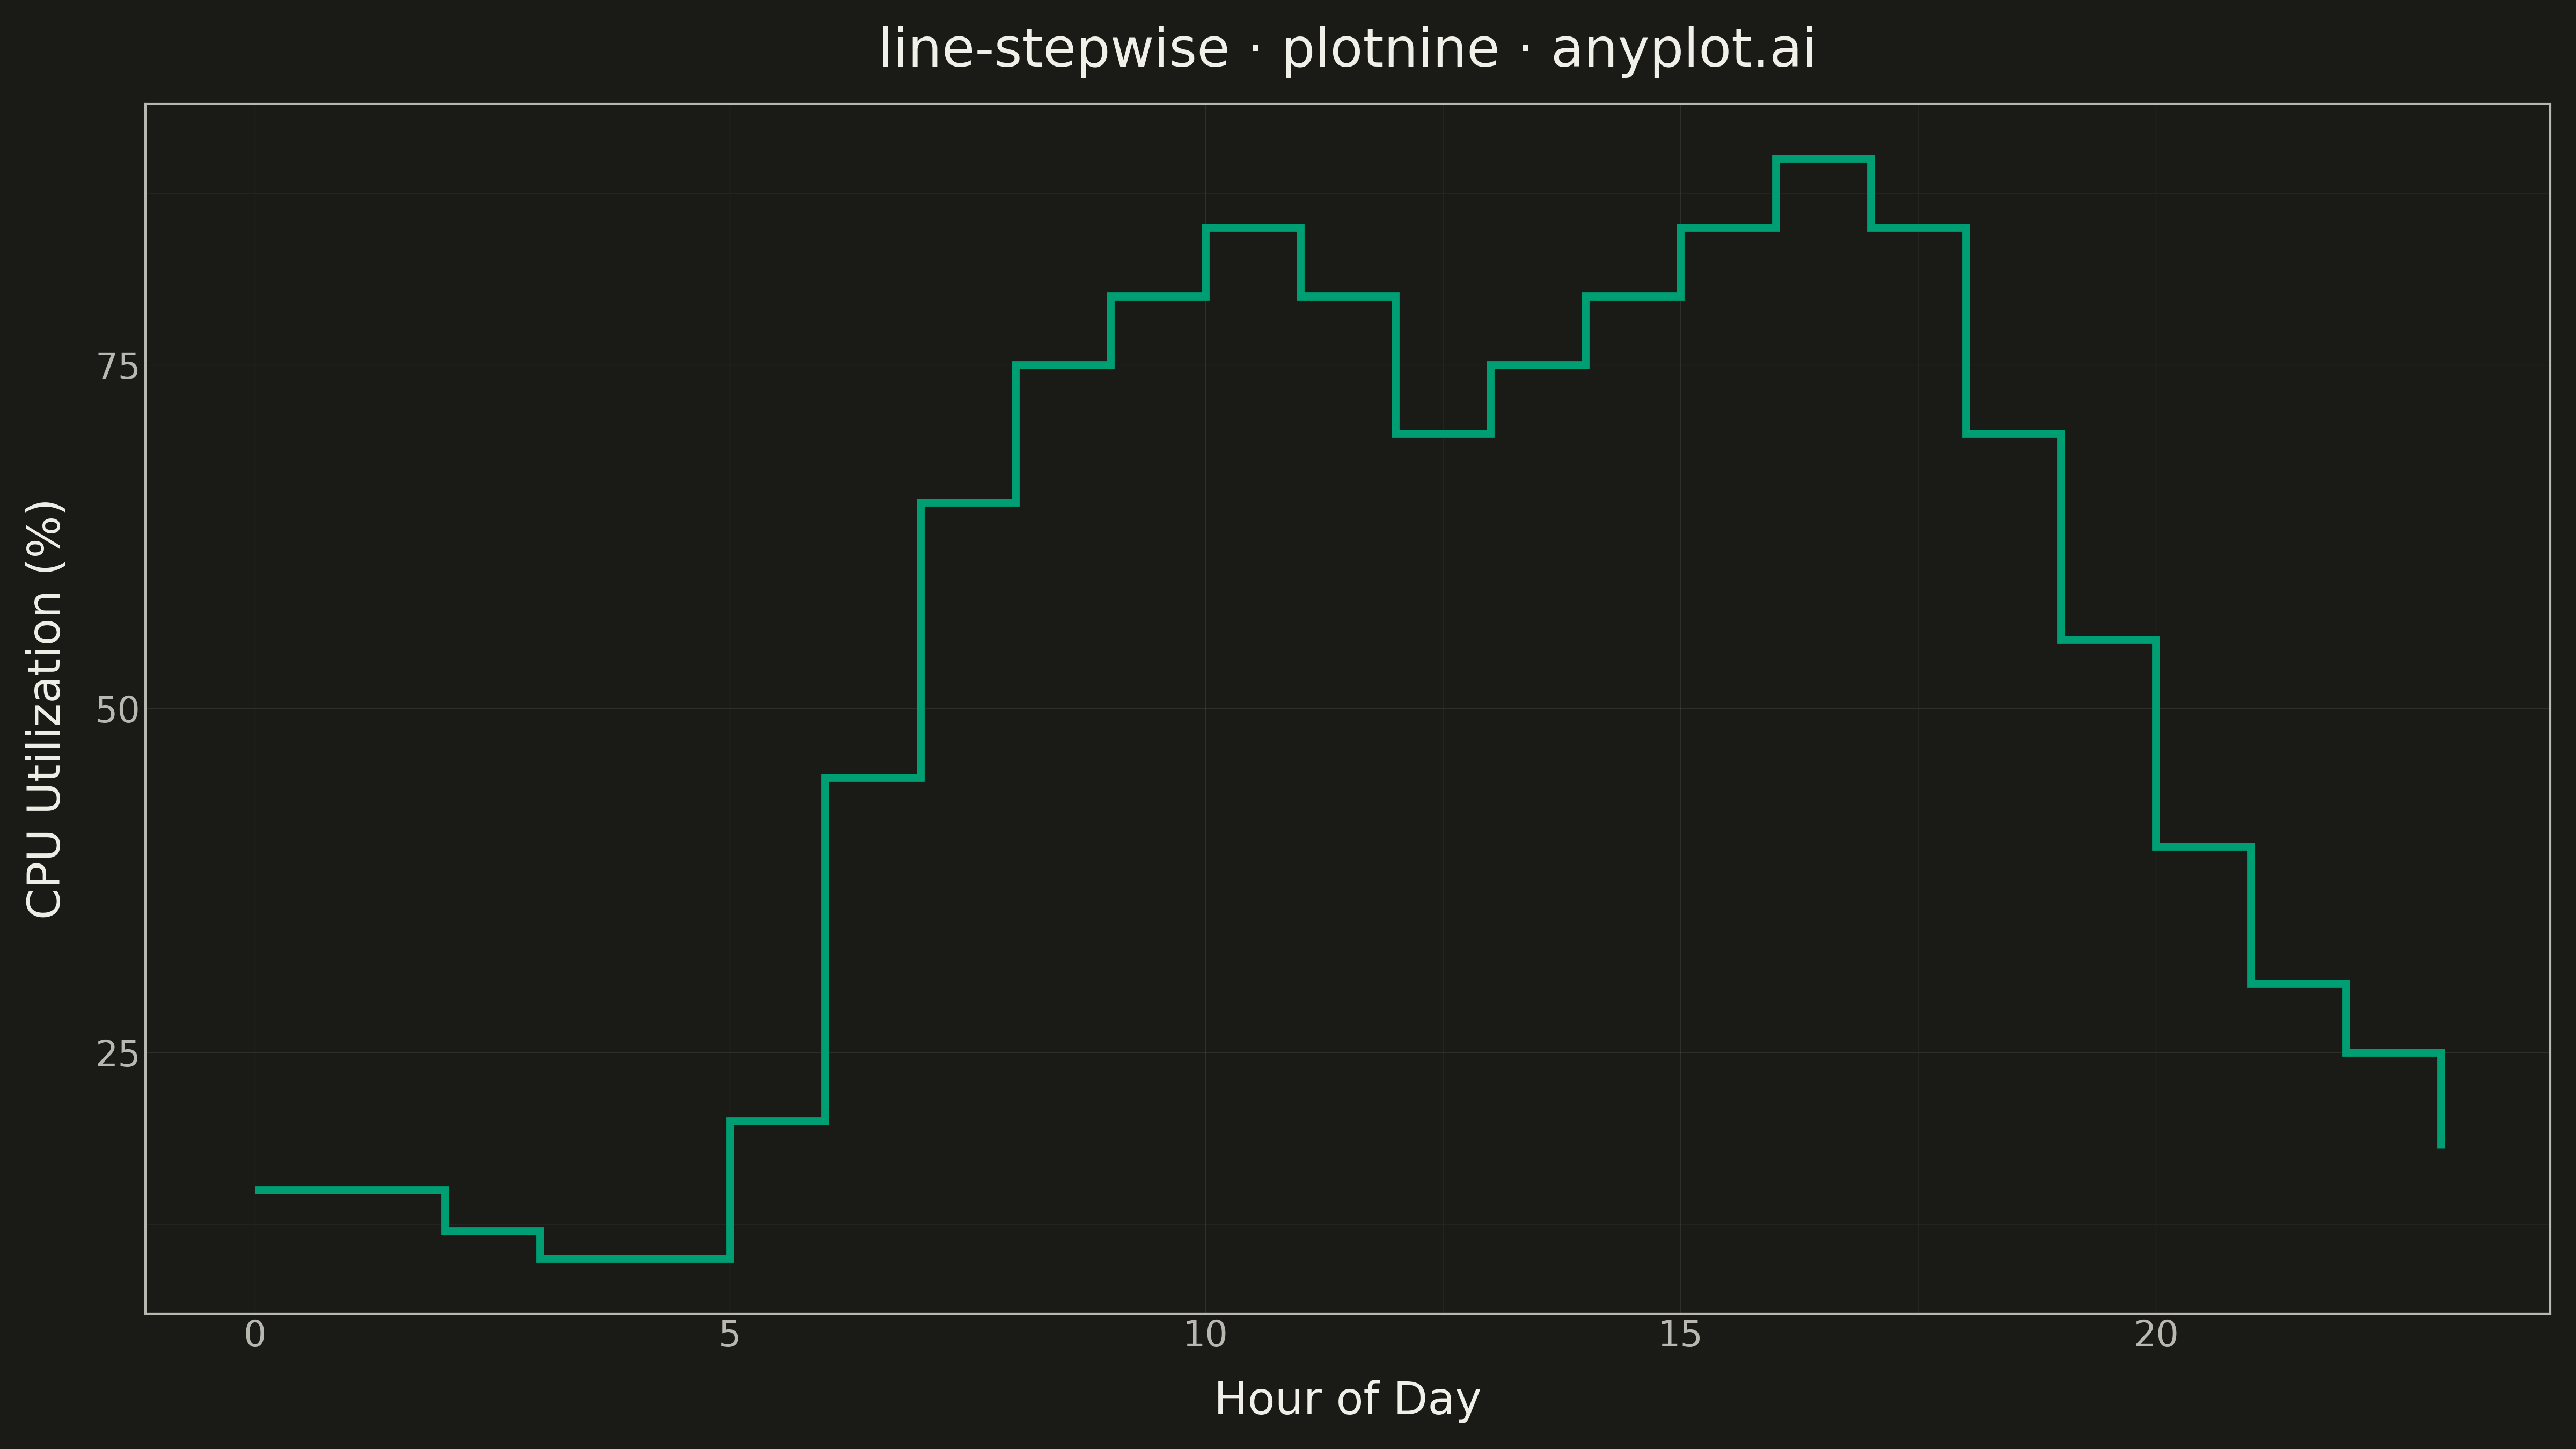
A step function plot where values remain constant until the next change, creating horizontal-then-vertical transitions. This visualization emphasizes discrete changes rather than interpolated values.
""" anyplot.ai
line-stepwise: Step Line Plot
Library: plotnine 0.15.4 | Python 3.13.13
Quality: 82/100 | Updated: 2026-05-13
"""

import os

import numpy as np
import pandas as pd
from plotnine import aes, element_line, element_rect, element_text, geom_step, ggplot, labs, theme, theme_minimal


# Theme tokens
THEME = os.getenv("ANYPLOT_THEME", "light")
PAGE_BG = "#FAF8F1" if THEME == "light" else "#1A1A17"
ELEVATED_BG = "#FFFDF6" if THEME == "light" else "#242420"
INK = "#1A1A17" if THEME == "light" else "#F0EFE8"
INK_SOFT = "#4A4A44" if THEME == "light" else "#B8B7B0"
BRAND = "#009E73"

# Data - Server CPU utilization showing discrete state changes
np.random.seed(42)
hours = np.arange(0, 24)
# Simulate CPU utilization that changes in discrete steps
base_utilization = np.array(
    [
        15,
        15,
        12,
        10,
        10,
        20,  # Night/early morning - low usage
        45,
        65,
        75,
        80,
        85,
        80,  # Morning ramp-up - high load
        70,
        75,
        80,
        85,
        90,
        85,  # Afternoon - peak hours
        70,
        55,
        40,
        30,
        25,
        18,  # Evening wind-down
    ]
)

df = pd.DataFrame({"hour": hours, "cpu_utilization": base_utilization})

# Theme
anyplot_theme = theme(
    figure_size=(16, 9),
    plot_background=element_rect(fill=PAGE_BG, color=PAGE_BG),
    panel_background=element_rect(fill=PAGE_BG),
    panel_grid_major=element_line(color=INK, size=0.3, alpha=0.10),
    panel_grid_minor=element_line(color=INK, size=0.2, alpha=0.05),
    panel_border=element_rect(color=INK_SOFT, fill=None),
    axis_title=element_text(size=20, color=INK),
    axis_text=element_text(size=16, color=INK_SOFT),
    axis_line=element_line(color=INK_SOFT),
    plot_title=element_text(size=24, color=INK),
)

# Plot
plot = (
    ggplot(df, aes(x="hour", y="cpu_utilization"))
    + geom_step(color=BRAND, size=2, direction="hv")
    + labs(x="Hour of Day", y="CPU Utilization (%)", title="line-stepwise · plotnine · anyplot.ai")
    + theme_minimal()
    + anyplot_theme
)

# Save
plot.save(f"plot-{THEME}.png", dpi=300, verbose=False)
Runnable source as JSON, for any HTTP client: https://api.anyplot.ai/specs/line-stepwise/plotnine/code. Any spec id and library id listed in llms-full.txt fit the same URL shape; every URL below is complete and callable.
{
  "spec_id": "line-stepwise",
  "language": "python",
  "library": "plotnine",
  "page": "https://anyplot.ai/line-stepwise/python/plotnine",
  "hub": "https://anyplot.ai/line-stepwise",
  "code_json": "https://api.anyplot.ai/specs/line-stepwise/plotnine/code",
  "spec_json": "https://api.anyplot.ai/specs/line-stepwise",
  "render_light_png": "https://storage.googleapis.com/anyplot-images/plots/line-stepwise/python/plotnine/plot-light.png",
  "render_dark_png": "https://storage.googleapis.com/anyplot-images/plots/line-stepwise/python/plotnine/plot-dark.png",
  "quality_score": 82.0,
  "license": "MIT",
  "guide": "https://anyplot.ai/llms.txt"
}
Part of Step Line Plot on anyplot.ai.