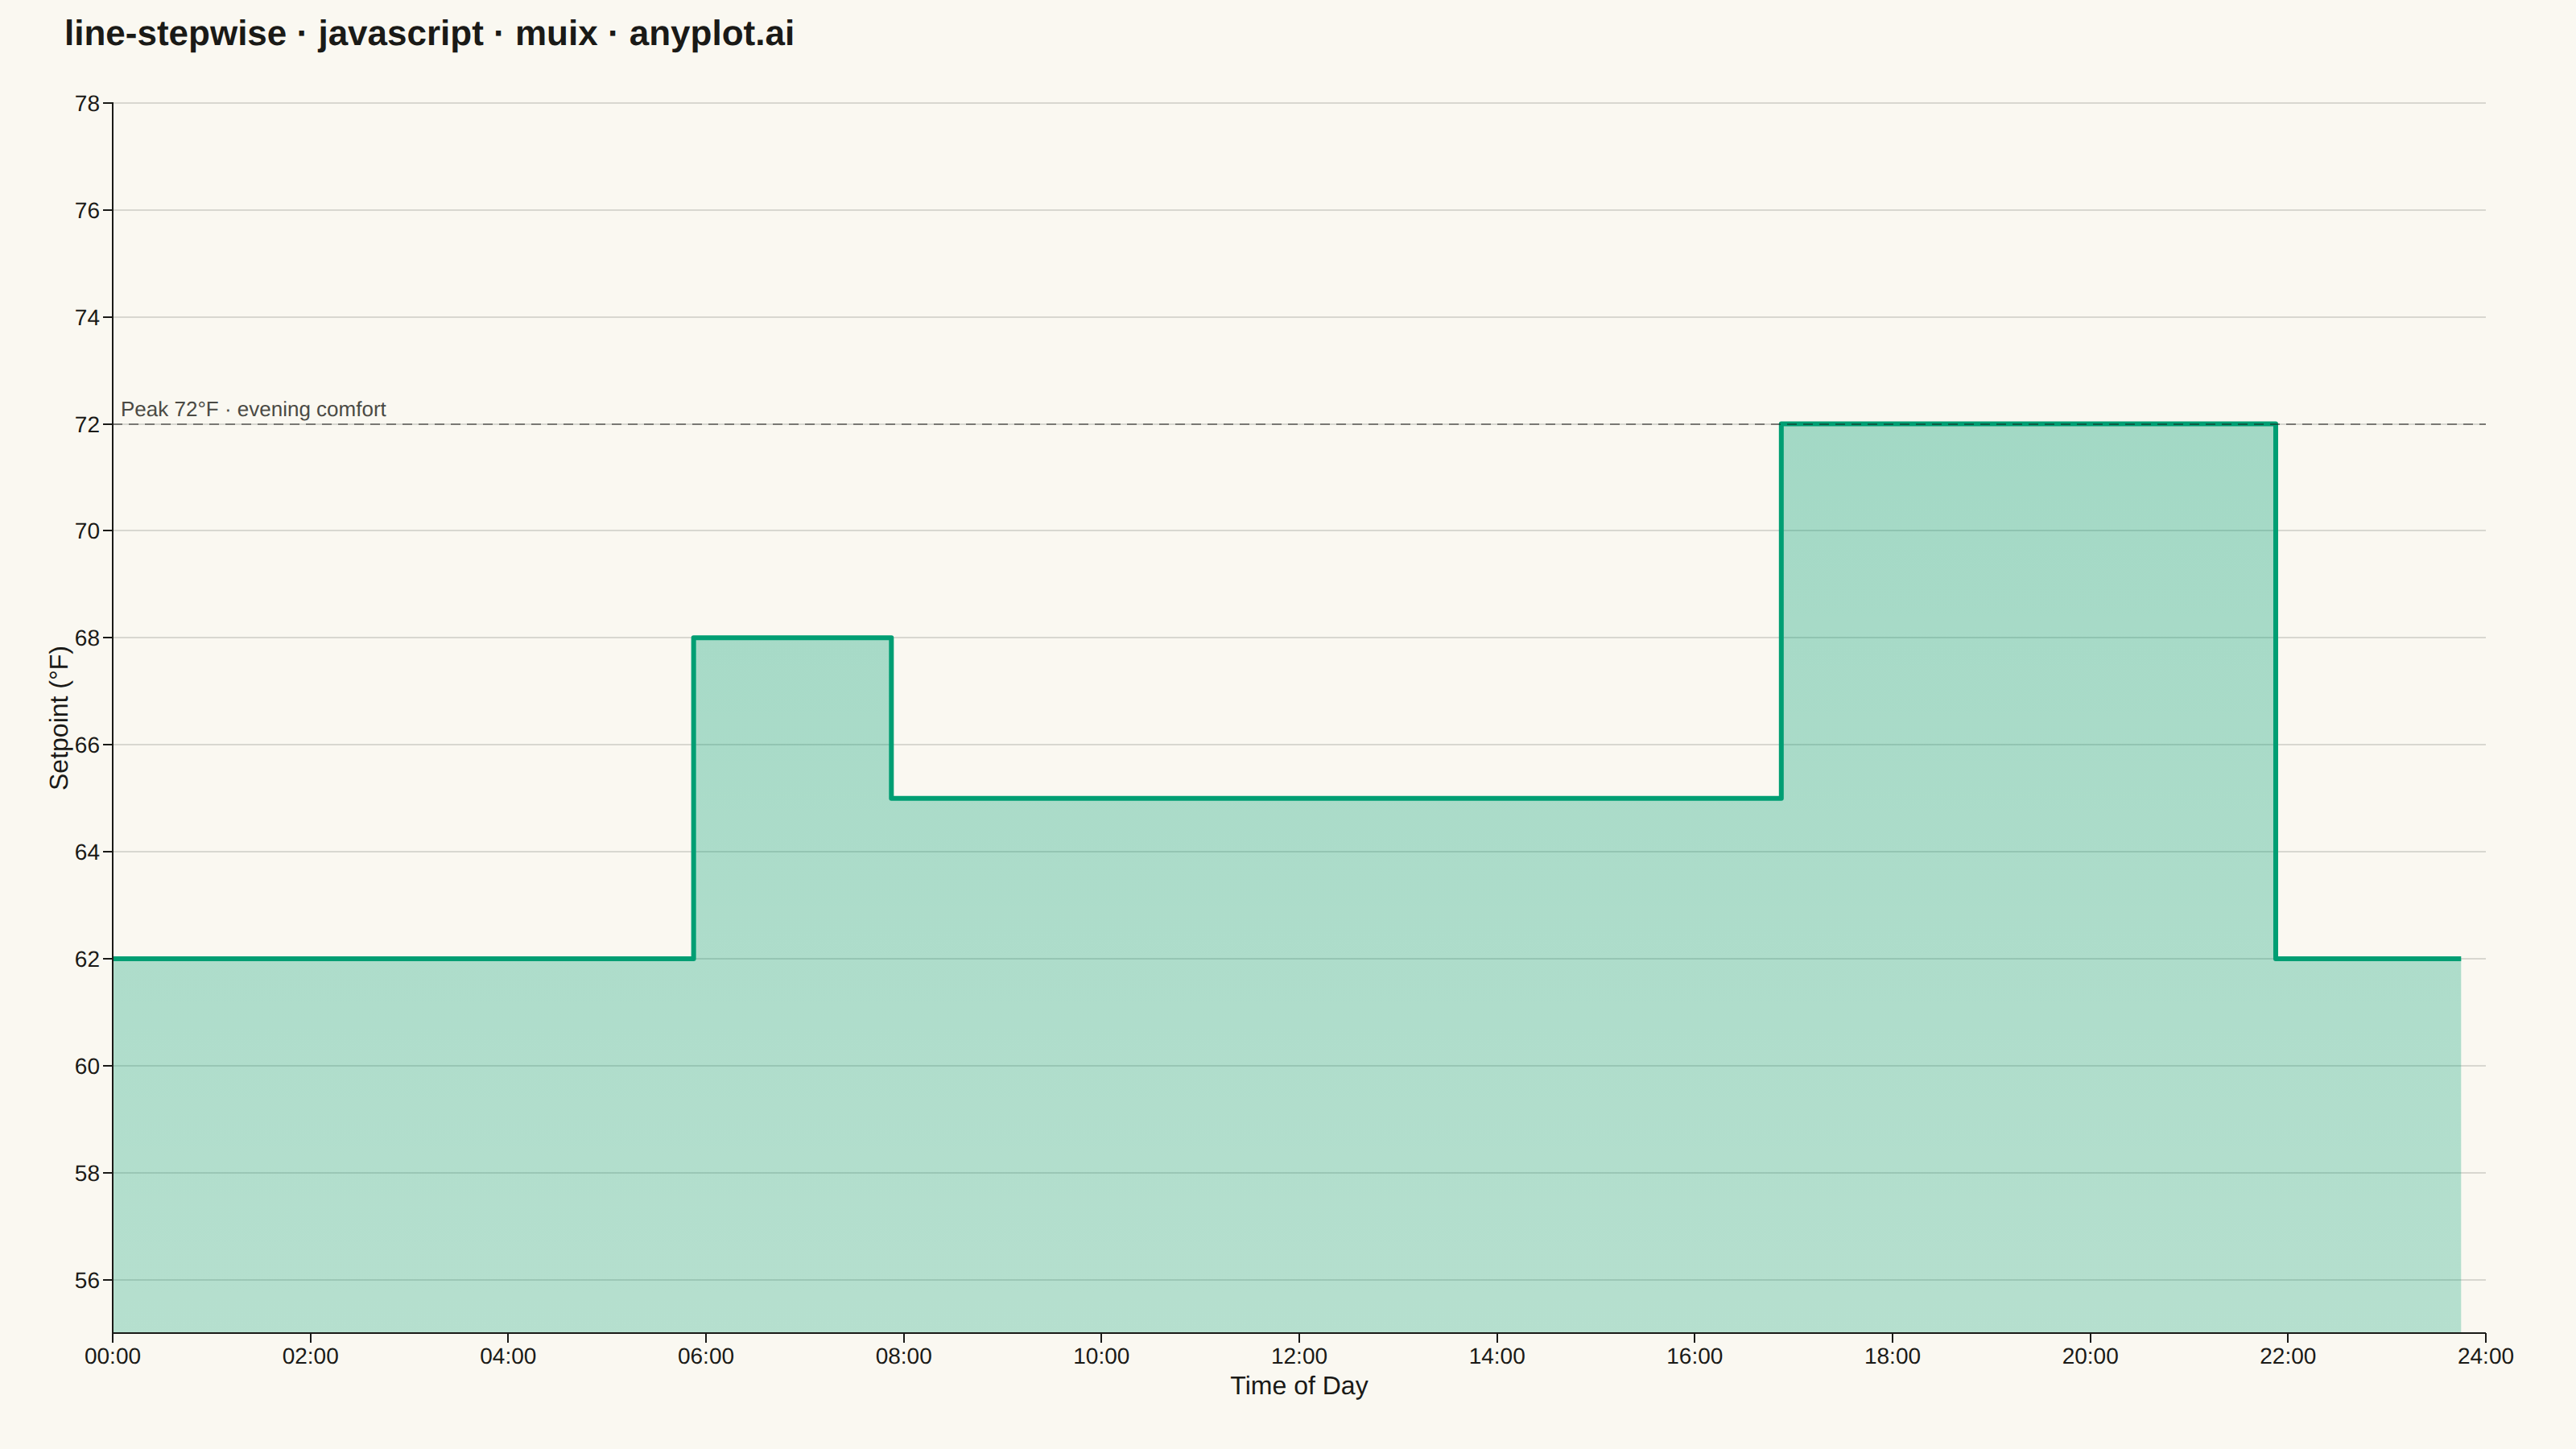
The same plot in 14 other libraries — JavaScript: Chart.js, D3.js, Apache ECharts, Highcharts; Python: Altair, Bokeh, lets-plot, Matplotlib, Plotly, plotnine, Pygal, Seaborn; R: ggplot2; Julia: Makie.jl. Compare all 15 side by side: Step Line Plot in Python, R, Julia and JavaScript.
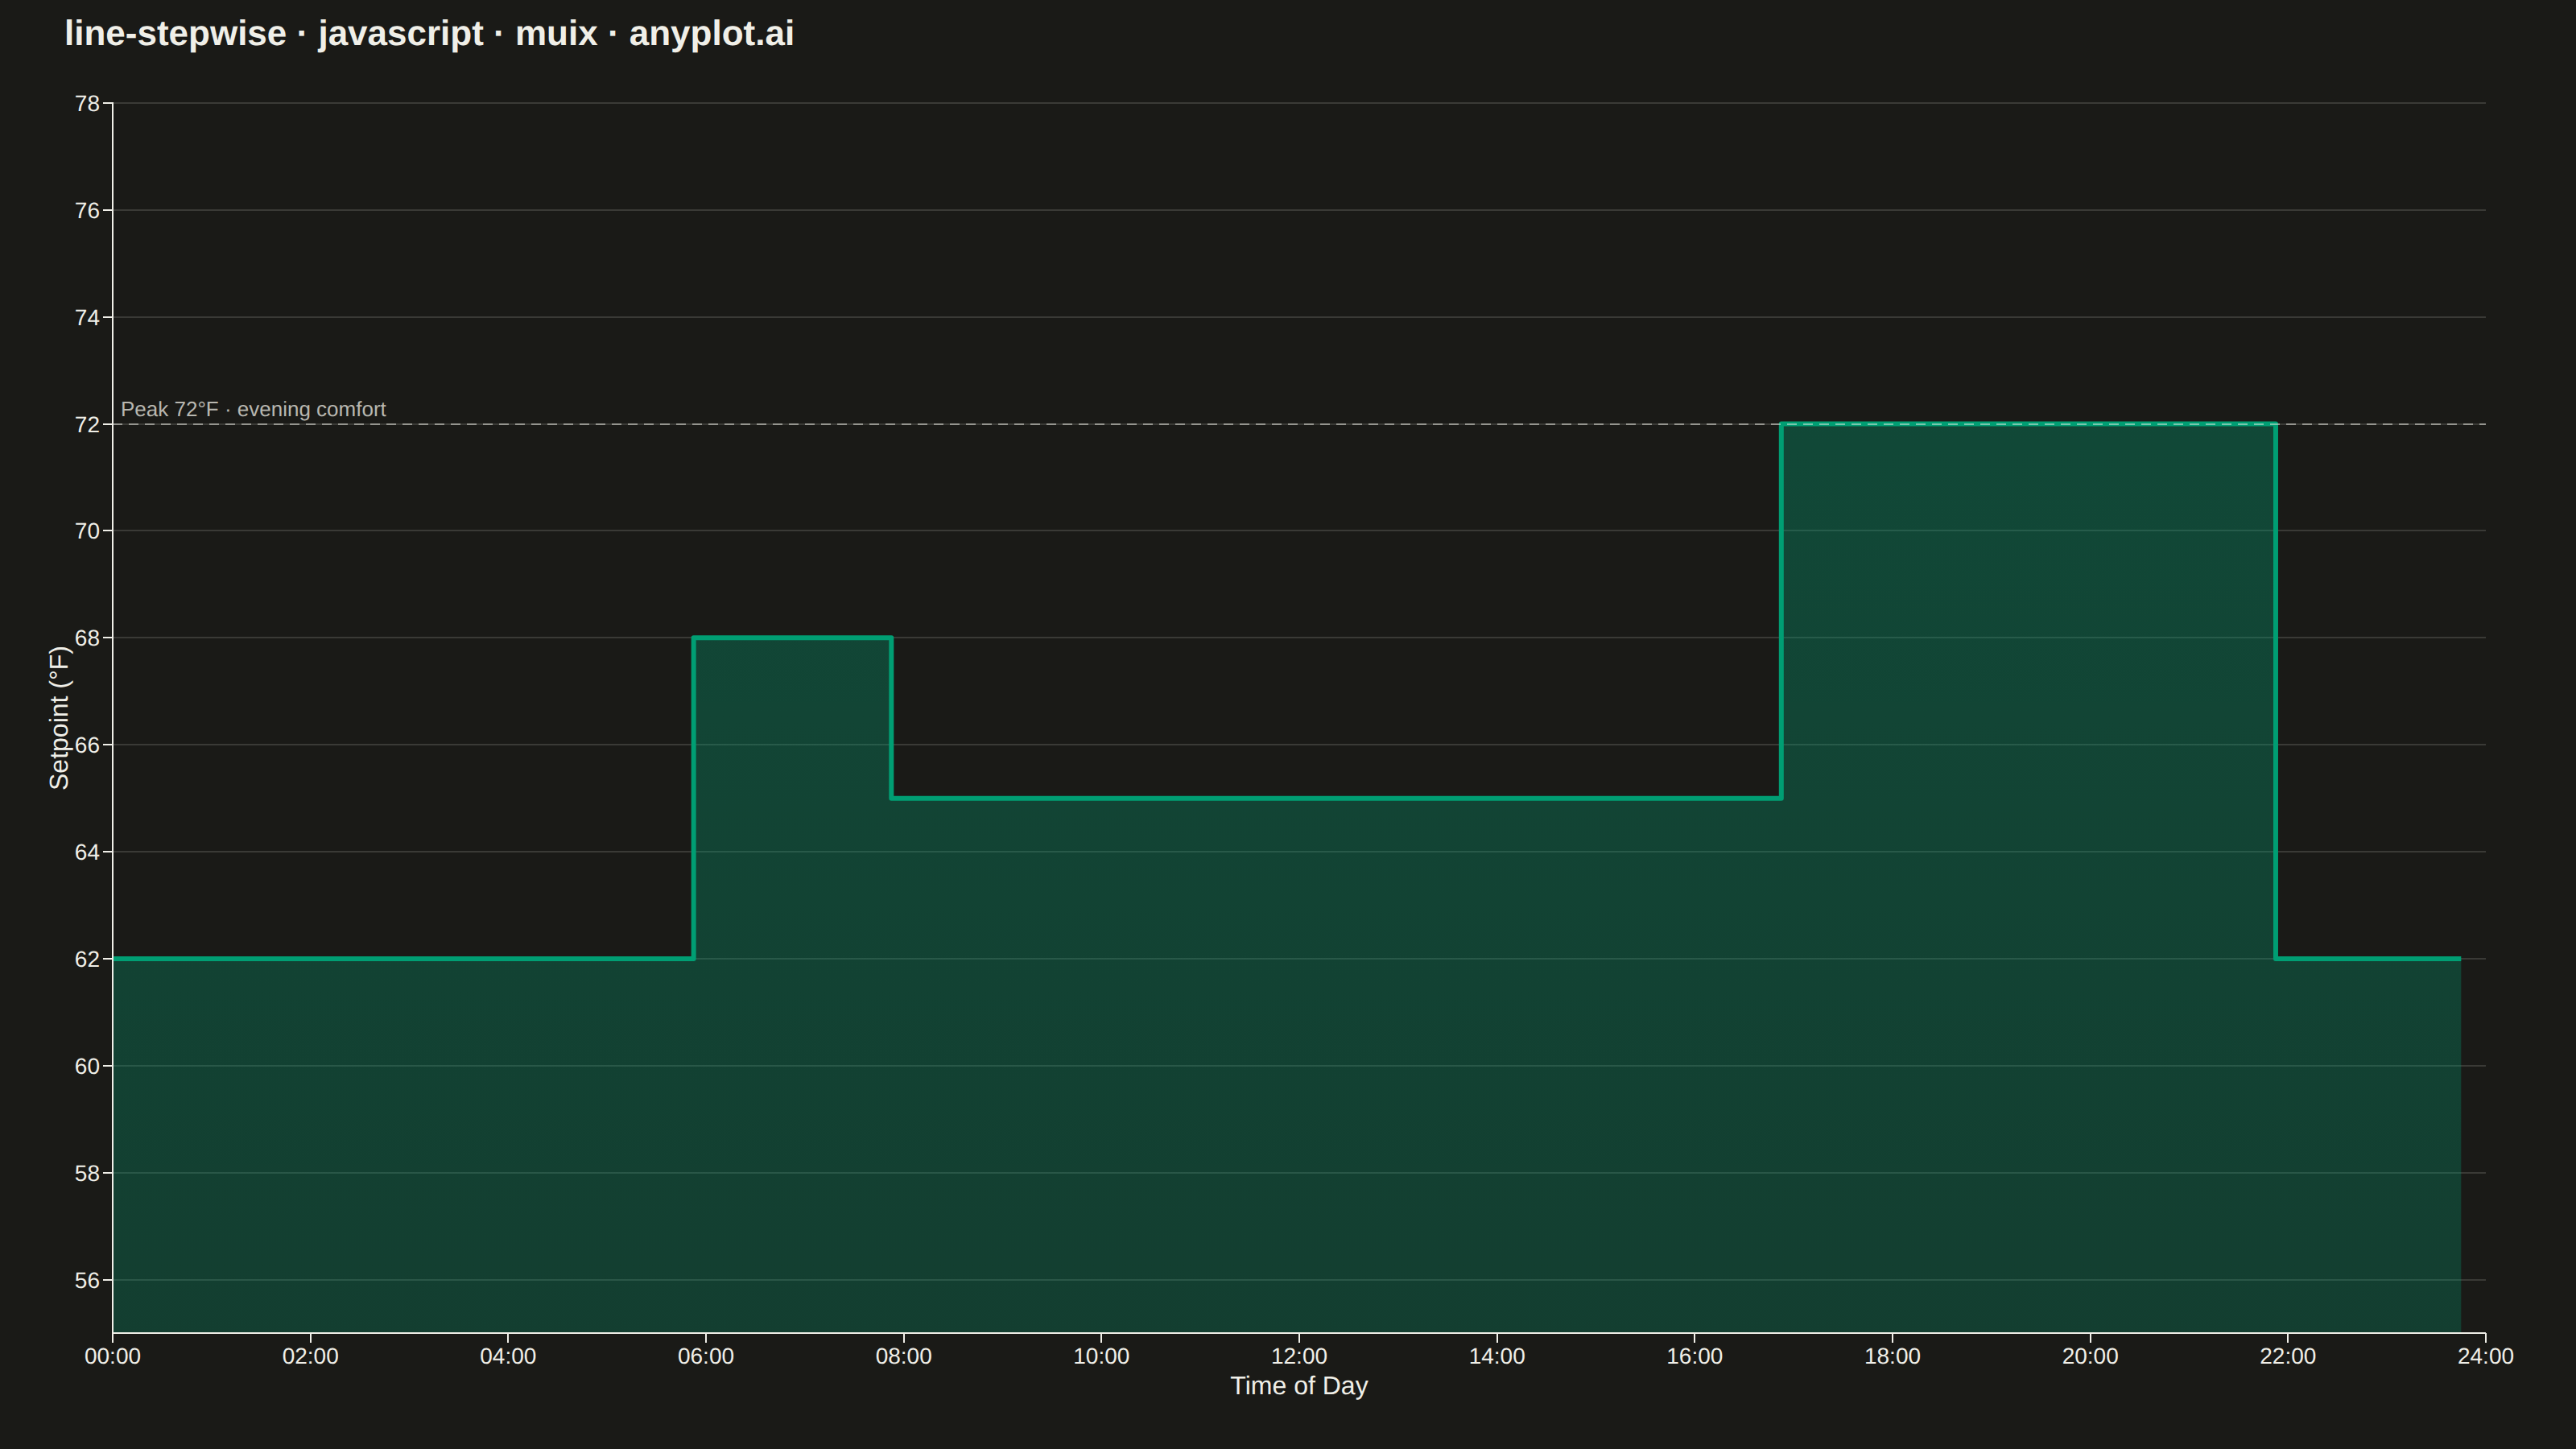
A step function plot where values remain constant until the next change, creating horizontal-then-vertical transitions. This visualization emphasizes discrete changes rather than interpolated values.
// anyplot.ai
// line-stepwise: Step Line Plot
// Library: muix 7.29.1 | JavaScript 22.23.2
// Quality: 87/100 | Created: 2026-09-05
import { LineChart } from "@mui/x-charts/LineChart";
import { ChartsReferenceLine } from "@mui/x-charts/ChartsReferenceLine";
import { Box, Typography } from "@mui/material";

const t = window.ANYPLOT_TOKENS;

// --- Data (in-memory, deterministic) ----------------------------------------
// Smart-thermostat setpoint schedule, logged every 15 minutes over a day. The
// schedule engine issues a new setpoint at fixed hours, but the telemetry
// logger only samples on a fixed cadence — the exact moment a command took
// effect sits somewhere between two consecutive readings, so mid-point step
// alignment (`curve="step"`) represents that uncertainty honestly, unlike
// "stepAfter" (which would claim the change landed exactly on a sample).
const SAMPLES_PER_HOUR = 4;
const SCHEDULE = [
  { hours: 6, setpoint: 62 }, // overnight sleep mode
  { hours: 2, setpoint: 68 }, // morning warm-up
  { hours: 9, setpoint: 65 }, // away / eco during work hours
  { hours: 5, setpoint: 72 }, // evening comfort
  { hours: 2, setpoint: 62 }, // night wind-down
];

const hoursOfDay = [];
const setpoints = [];
let hour = 0;
for (const block of SCHEDULE) {
  const samples = block.hours * SAMPLES_PER_HOUR;
  for (let i = 0; i < samples; i += 1) {
    hoursOfDay.push(hour);
    setpoints.push(block.setpoint);
    hour += 1 / SAMPLES_PER_HOUR;
  }
}

function formatHour(h) {
  const wholeHour = Math.floor(h);
  const minutes = Math.round((h - wholeHour) * 60);
  return `${String(wholeHour).padStart(2, "0")}:${String(minutes).padStart(2, "0")}`;
}

const TITLE = "line-stepwise · javascript · muix · anyplot.ai";
const TITLE_H = 56;
const AREA_GRADIENT_ID = "stepAreaFillGradient";

// The evening-comfort plateau is the schedule's warmest setpoint — call it
// out with a reference line so the chart has a clear focal point beyond the
// step shape itself.
const PEAK_SETPOINT = Math.max(...SCHEDULE.map((b) => b.setpoint));

// --- Chart (default-exported component — the harness mounts it) ------------
export default function Chart() {
  const { width, height } = window.ANYPLOT_SIZE;

  return (
    <Box sx={{ width, height, display: "flex", flexDirection: "column" }}>
      <Typography sx={{ fontSize: 22, fontWeight: 600, color: "text.primary", px: "40px", pt: "10px", lineHeight: 1 }}>
        {TITLE}
      </Typography>
      <LineChart
        width={width}
        height={height - TITLE_H}
        skipAnimation
        series={[
          {
            data: setpoints,
            color: t.palette[0],
            curve: "step",
            area: true,
            showMark: false,
            valueFormatter: (v) => `${v}°F`,
          },
        ]}
        xAxis={[
          {
            data: hoursOfDay,
            scaleType: "linear",
            label: "Time of Day",
            min: 0,
            max: 24,
            tickNumber: 8,
            valueFormatter: (h) => formatHour(h),
            tickLabelStyle: { fontSize: 14 },
            labelStyle: { fontSize: 16 },
          },
        ]}
        yAxis={[
          {
            min: 55,
            max: 78,
            label: "Setpoint (°F)",
            tickLabelStyle: { fontSize: 14 },
            labelStyle: { fontSize: 16 },
          },
        ]}
        margin={{ top: 20, right: 56, bottom: 60, left: 70 }}
        grid={{ horizontal: true }}
        slotProps={{ legend: { hidden: true } }}
        sx={{
          "& .MuiLineElement-root": { strokeWidth: 3 },
          "& .MuiAreaElement-root": { fill: `url(#${AREA_GRADIENT_ID})` },
          "& .MuiChartsGrid-line": { stroke: t.grid, strokeWidth: 1 },
        }}
      >
        <defs>
          <linearGradient id={AREA_GRADIENT_ID} x1="0" y1="0" x2="0" y2="1">
            <stop offset="0%" stopColor={t.palette[0]} stopOpacity={0.35} />
            <stop offset="100%" stopColor={t.palette[0]} stopOpacity={0.03} />
          </linearGradient>
        </defs>
        <ChartsReferenceLine
          y={PEAK_SETPOINT}
          label={`Peak ${PEAK_SETPOINT}°F · evening comfort`}
          labelAlign="start"
          lineStyle={{ stroke: t.ink, strokeDasharray: "6 4", strokeOpacity: 0.5 }}
          labelStyle={{ fill: t.inkSoft, fontSize: 13 }}
        />
      </LineChart>
    </Box>
  );
}
Runnable source as JSON, for any HTTP client: https://api.anyplot.ai/specs/line-stepwise/muix/code. Any spec id and library id listed in llms-full.txt fit the same URL shape; every URL below is complete and callable.
{
  "spec_id": "line-stepwise",
  "language": "javascript",
  "library": "muix",
  "page": "https://anyplot.ai/line-stepwise/javascript/muix",
  "hub": "https://anyplot.ai/line-stepwise",
  "code_json": "https://api.anyplot.ai/specs/line-stepwise/muix/code",
  "spec_json": "https://api.anyplot.ai/specs/line-stepwise",
  "render_light_png": "https://storage.googleapis.com/anyplot-images/plots/line-stepwise/javascript/muix/plot-light.png",
  "render_dark_png": "https://storage.googleapis.com/anyplot-images/plots/line-stepwise/javascript/muix/plot-dark.png",
  "interactive_light_html": "https://storage.googleapis.com/anyplot-images/plots/line-stepwise/javascript/muix/plot-light.html",
  "interactive_dark_html": "https://storage.googleapis.com/anyplot-images/plots/line-stepwise/javascript/muix/plot-dark.html",
  "quality_score": 87.0,
  "license": "MIT",
  "guide": "https://anyplot.ai/llms.txt"
}
Part of Step Line Plot on anyplot.ai.