The same plot in 14 other libraries — JavaScript: Chart.js, D3.js, Highcharts, MUI X Charts; Python: Altair, Bokeh, lets-plot, Matplotlib, Plotly, plotnine, Pygal, Seaborn; R: ggplot2; Julia: Makie.jl. Compare all 15 side by side: Step Line Plot in Python, R, Julia and JavaScript.
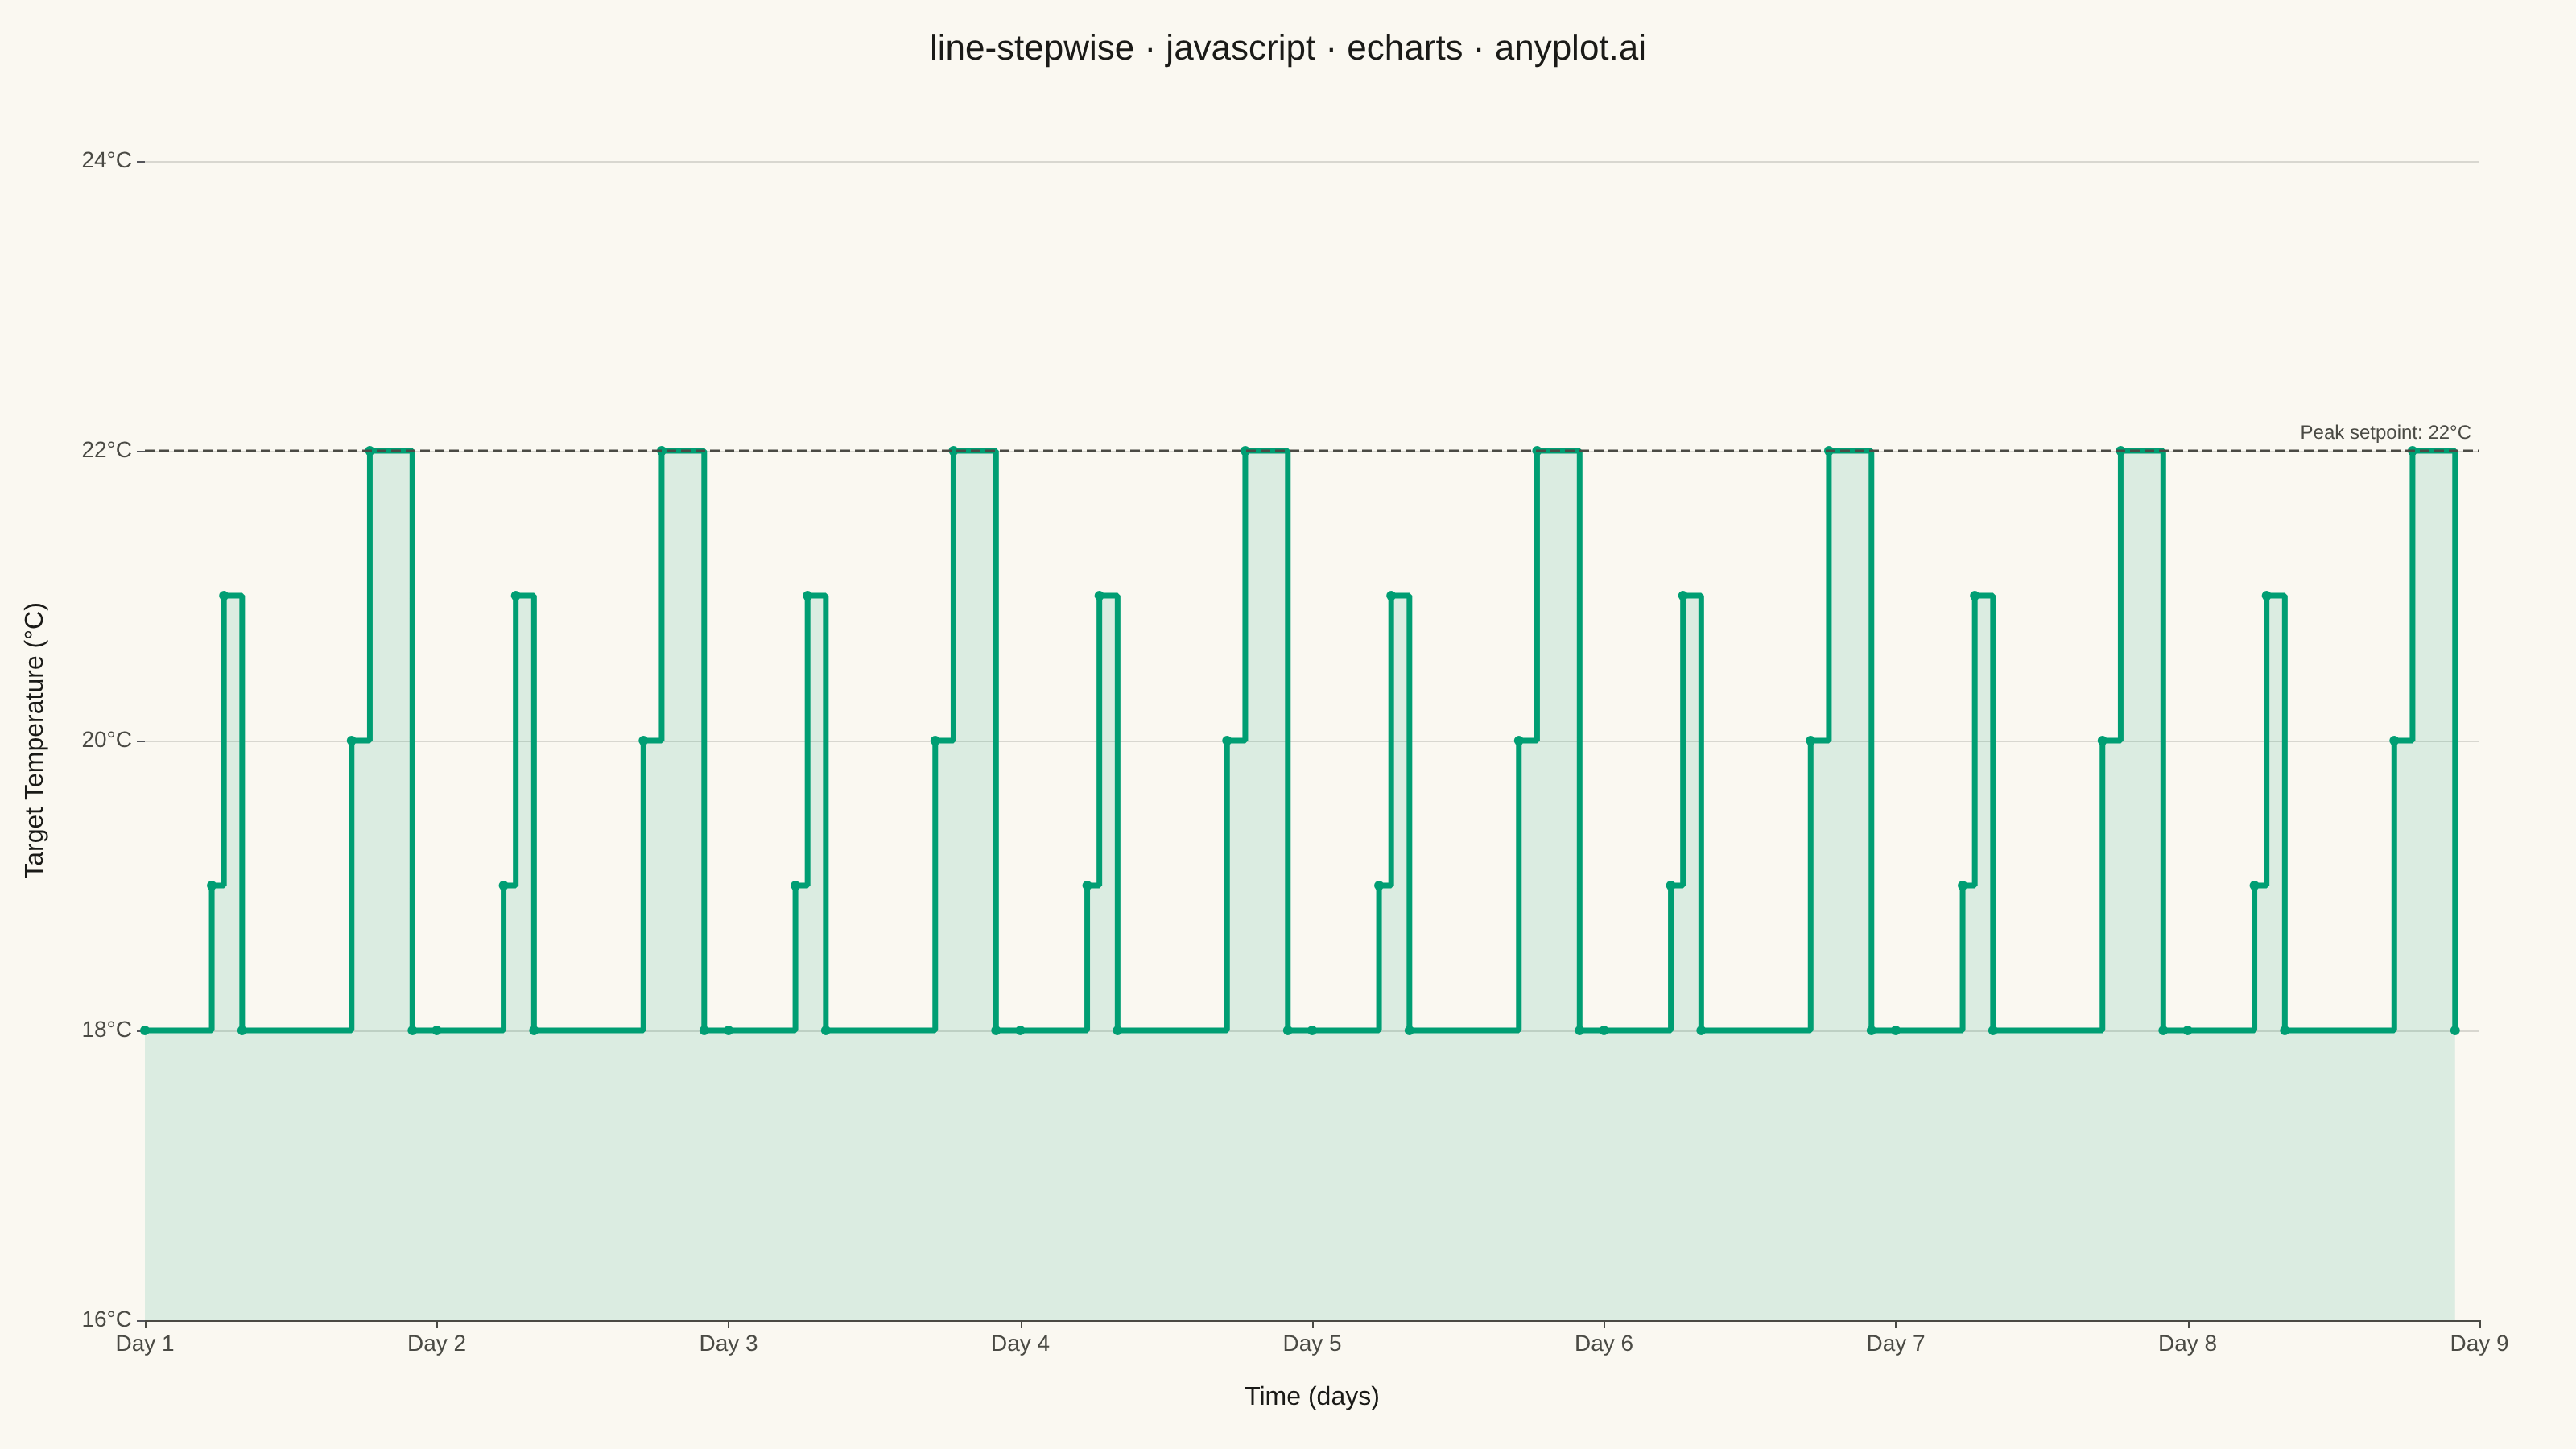
A step function plot where values remain constant until the next change, creating horizontal-then-vertical transitions. This visualization emphasizes discrete changes rather than interpolated values.
// anyplot.ai
// line-stepwise: Step Line Plot
// Library: echarts 6.1.0 | JavaScript 22.23.2
// Quality: 87/100 | Created: 2026-09-05

const t = window.ANYPLOT_TOKENS;

// --- Data (in-memory, deterministic) ----------------------------------------
// Smart thermostat target-temperature schedule: the setpoint changes at a
// handful of events per day and holds constant until the next event — a
// textbook piecewise-constant signal, sampled across 8 days.
const DAILY_SCHEDULE = [
  [0, 18],
  [5.5, 19],
  [6.5, 21],
  [8, 18],
  [17, 20],
  [18.5, 22],
  [22, 18],
];

const hours = [];
const setpoints = [];
for (let day = 0; day < 8; day++) {
  for (const [hourOfDay, tempC] of DAILY_SCHEDULE) {
    hours.push(day * 24 + hourOfDay);
    setpoints.push(tempC);
  }
}
const data = hours.map((h, i) => [h, setpoints[i]]);

// --- Init --------------------------------------------------------------------
const chart = echarts.init(document.getElementById("container"));

// --- Option --------------------------------------------------------------------
chart.setOption({
  animation: false,
  color: t.palette,
  backgroundColor: "transparent",
  title: {
    text: "line-stepwise · javascript · echarts · anyplot.ai",
    left: "center",
    textStyle: { color: t.ink, fontSize: 22, fontWeight: 500 },
  },
  tooltip: {
    trigger: "axis",
    formatter: (params) => {
      const p = params[0];
      const h = p.value[0];
      const day = Math.floor(h / 24) + 1;
      const hourOfDay = h % 24;
      const hh = String(Math.floor(hourOfDay)).padStart(2, "0");
      const mm = String(Math.round((hourOfDay % 1) * 60)).padStart(2, "0");
      return `Day ${day}, ${hh}:${mm} → ${p.value[1]}°C`;
    },
  },
  grid: { left: 90, right: 60, top: 100, bottom: 80 },
  xAxis: {
    type: "value",
    name: "Time (days)",
    nameLocation: "middle",
    nameGap: 40,
    nameTextStyle: { color: t.ink, fontSize: 16 },
    min: 0,
    max: 192,
    interval: 24,
    axisLabel: { color: t.inkSoft, fontSize: 14, formatter: (v) => `Day ${v / 24 + 1}` },
    axisLine: { lineStyle: { color: t.inkSoft } },
    splitLine: { show: false },
  },
  yAxis: {
    type: "value",
    name: "Target Temperature (°C)",
    nameLocation: "middle",
    nameGap: 60,
    nameTextStyle: { color: t.ink, fontSize: 16 },
    min: 16,
    max: 24,
    axisLabel: { color: t.inkSoft, fontSize: 14, formatter: "{value}°C" },
    axisLine: { show: false },
    splitLine: { lineStyle: { color: t.grid } },
  },
  series: [
    {
      type: "line",
      data: data,
      step: "end",
      symbol: "circle",
      symbolSize: 6,
      lineStyle: { color: t.palette[0], width: 3.5 },
      itemStyle: { color: t.palette[0] },
      areaStyle: { color: t.palette[0], opacity: 0.12 },
      markLine: {
        silent: true,
        symbol: "none",
        lineStyle: { color: t.inkSoft, type: "dashed", width: 1.5 },
        label: {
          color: t.inkSoft,
          fontSize: 12,
          position: "insideEndTop",
          formatter: "Peak setpoint: 22°C",
        },
        data: [{ yAxis: 22 }],
      },
    },
  ],
});
Runnable source as JSON, for any HTTP client: https://api.anyplot.ai/specs/line-stepwise/echarts/code. Any spec id and library id listed in llms-full.txt fit the same URL shape; every URL below is complete and callable.
{
  "spec_id": "line-stepwise",
  "language": "javascript",
  "library": "echarts",
  "page": "https://anyplot.ai/line-stepwise/javascript/echarts",
  "hub": "https://anyplot.ai/line-stepwise",
  "code_json": "https://api.anyplot.ai/specs/line-stepwise/echarts/code",
  "spec_json": "https://api.anyplot.ai/specs/line-stepwise",
  "render_light_png": "https://storage.googleapis.com/anyplot-images/plots/line-stepwise/javascript/echarts/plot-light.png",
  "render_dark_png": "https://storage.googleapis.com/anyplot-images/plots/line-stepwise/javascript/echarts/plot-dark.png",
  "interactive_light_html": "https://storage.googleapis.com/anyplot-images/plots/line-stepwise/javascript/echarts/plot-light.html",
  "interactive_dark_html": "https://storage.googleapis.com/anyplot-images/plots/line-stepwise/javascript/echarts/plot-dark.html",
  "quality_score": 87.0,
  "license": "MIT",
  "guide": "https://anyplot.ai/llms.txt"
}
Part of Step Line Plot on anyplot.ai.