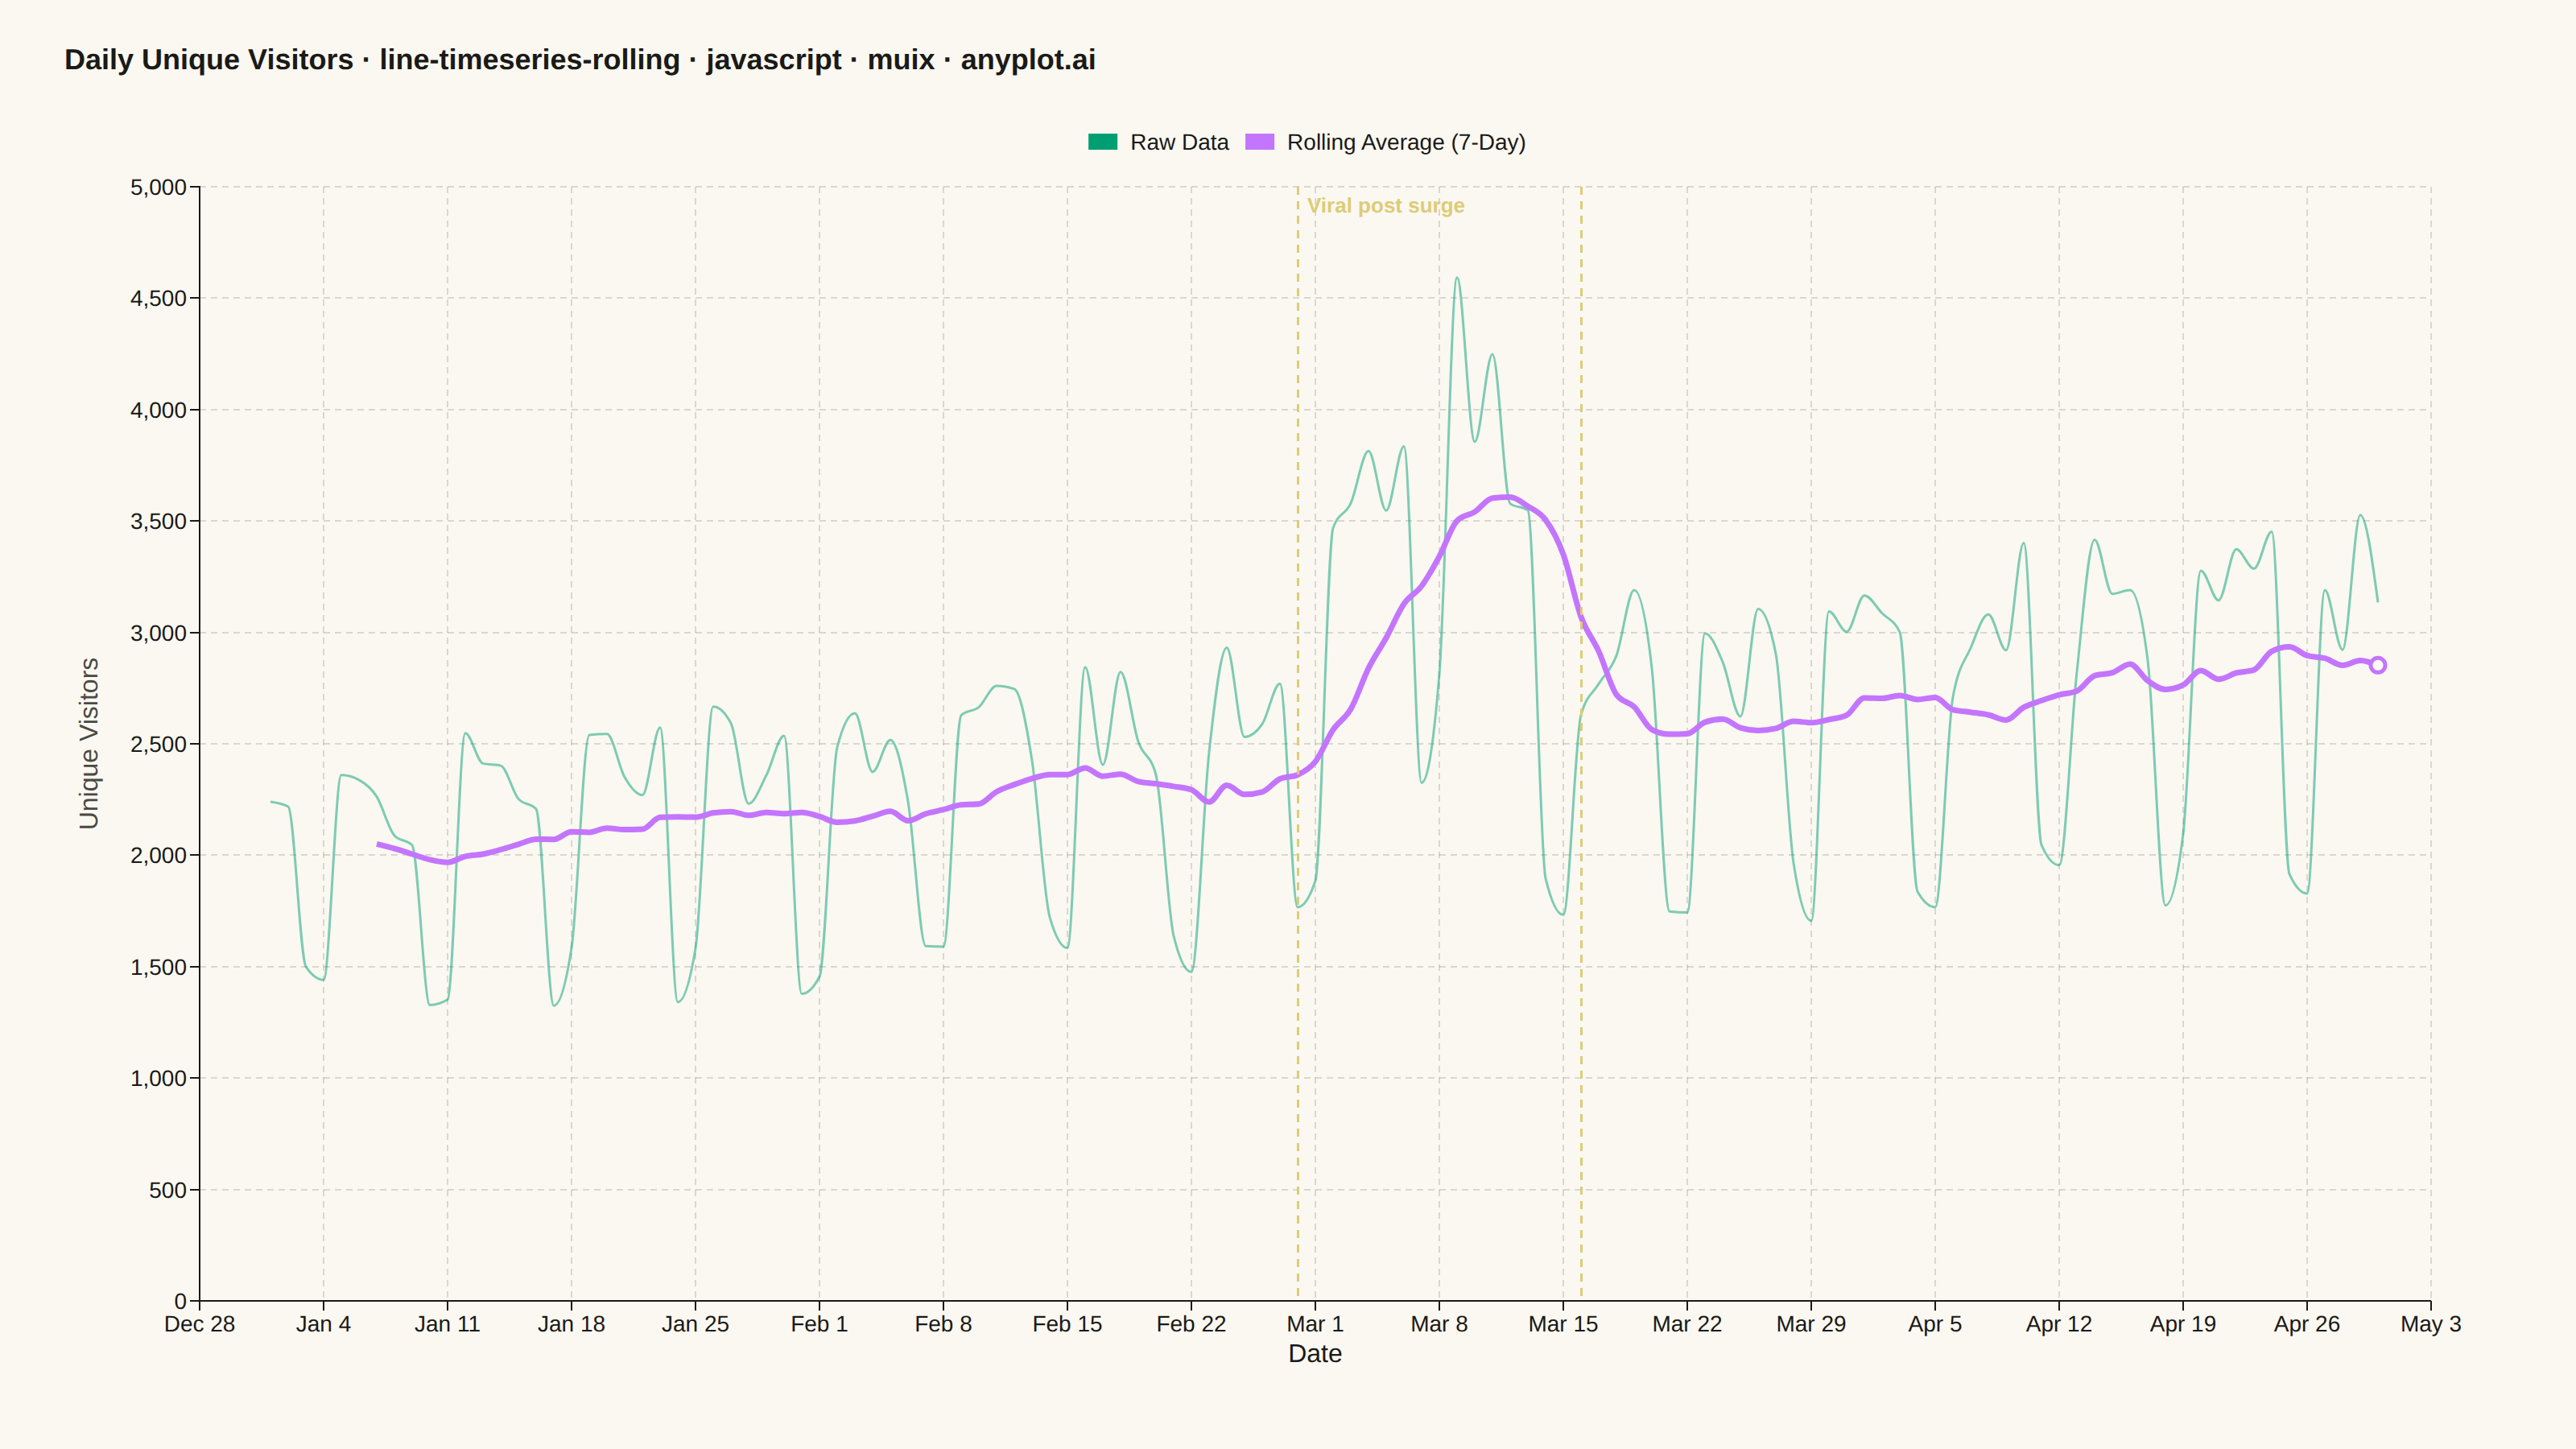
A time series plot that displays raw data points alongside a smoothed rolling average (moving average) line. The raw data shows actual observations while the rolling average reveals underlying trends by reducing noise and short-term fluctuations. This dual-layer visualization is essential for trend identification, making patterns visible that might be obscured by day-to-day volatility.
Preview render from the MUI X Charts implementation.