Source code in 15 libraries — Python: Altair, Bokeh, lets-plot, Matplotlib, Plotly, plotnine, Pygal, Seaborn; R: ggplot2; Julia: Makie.jl; JavaScript: Chart.js, D3.js, Apache ECharts, Highcharts, MUI X Charts.
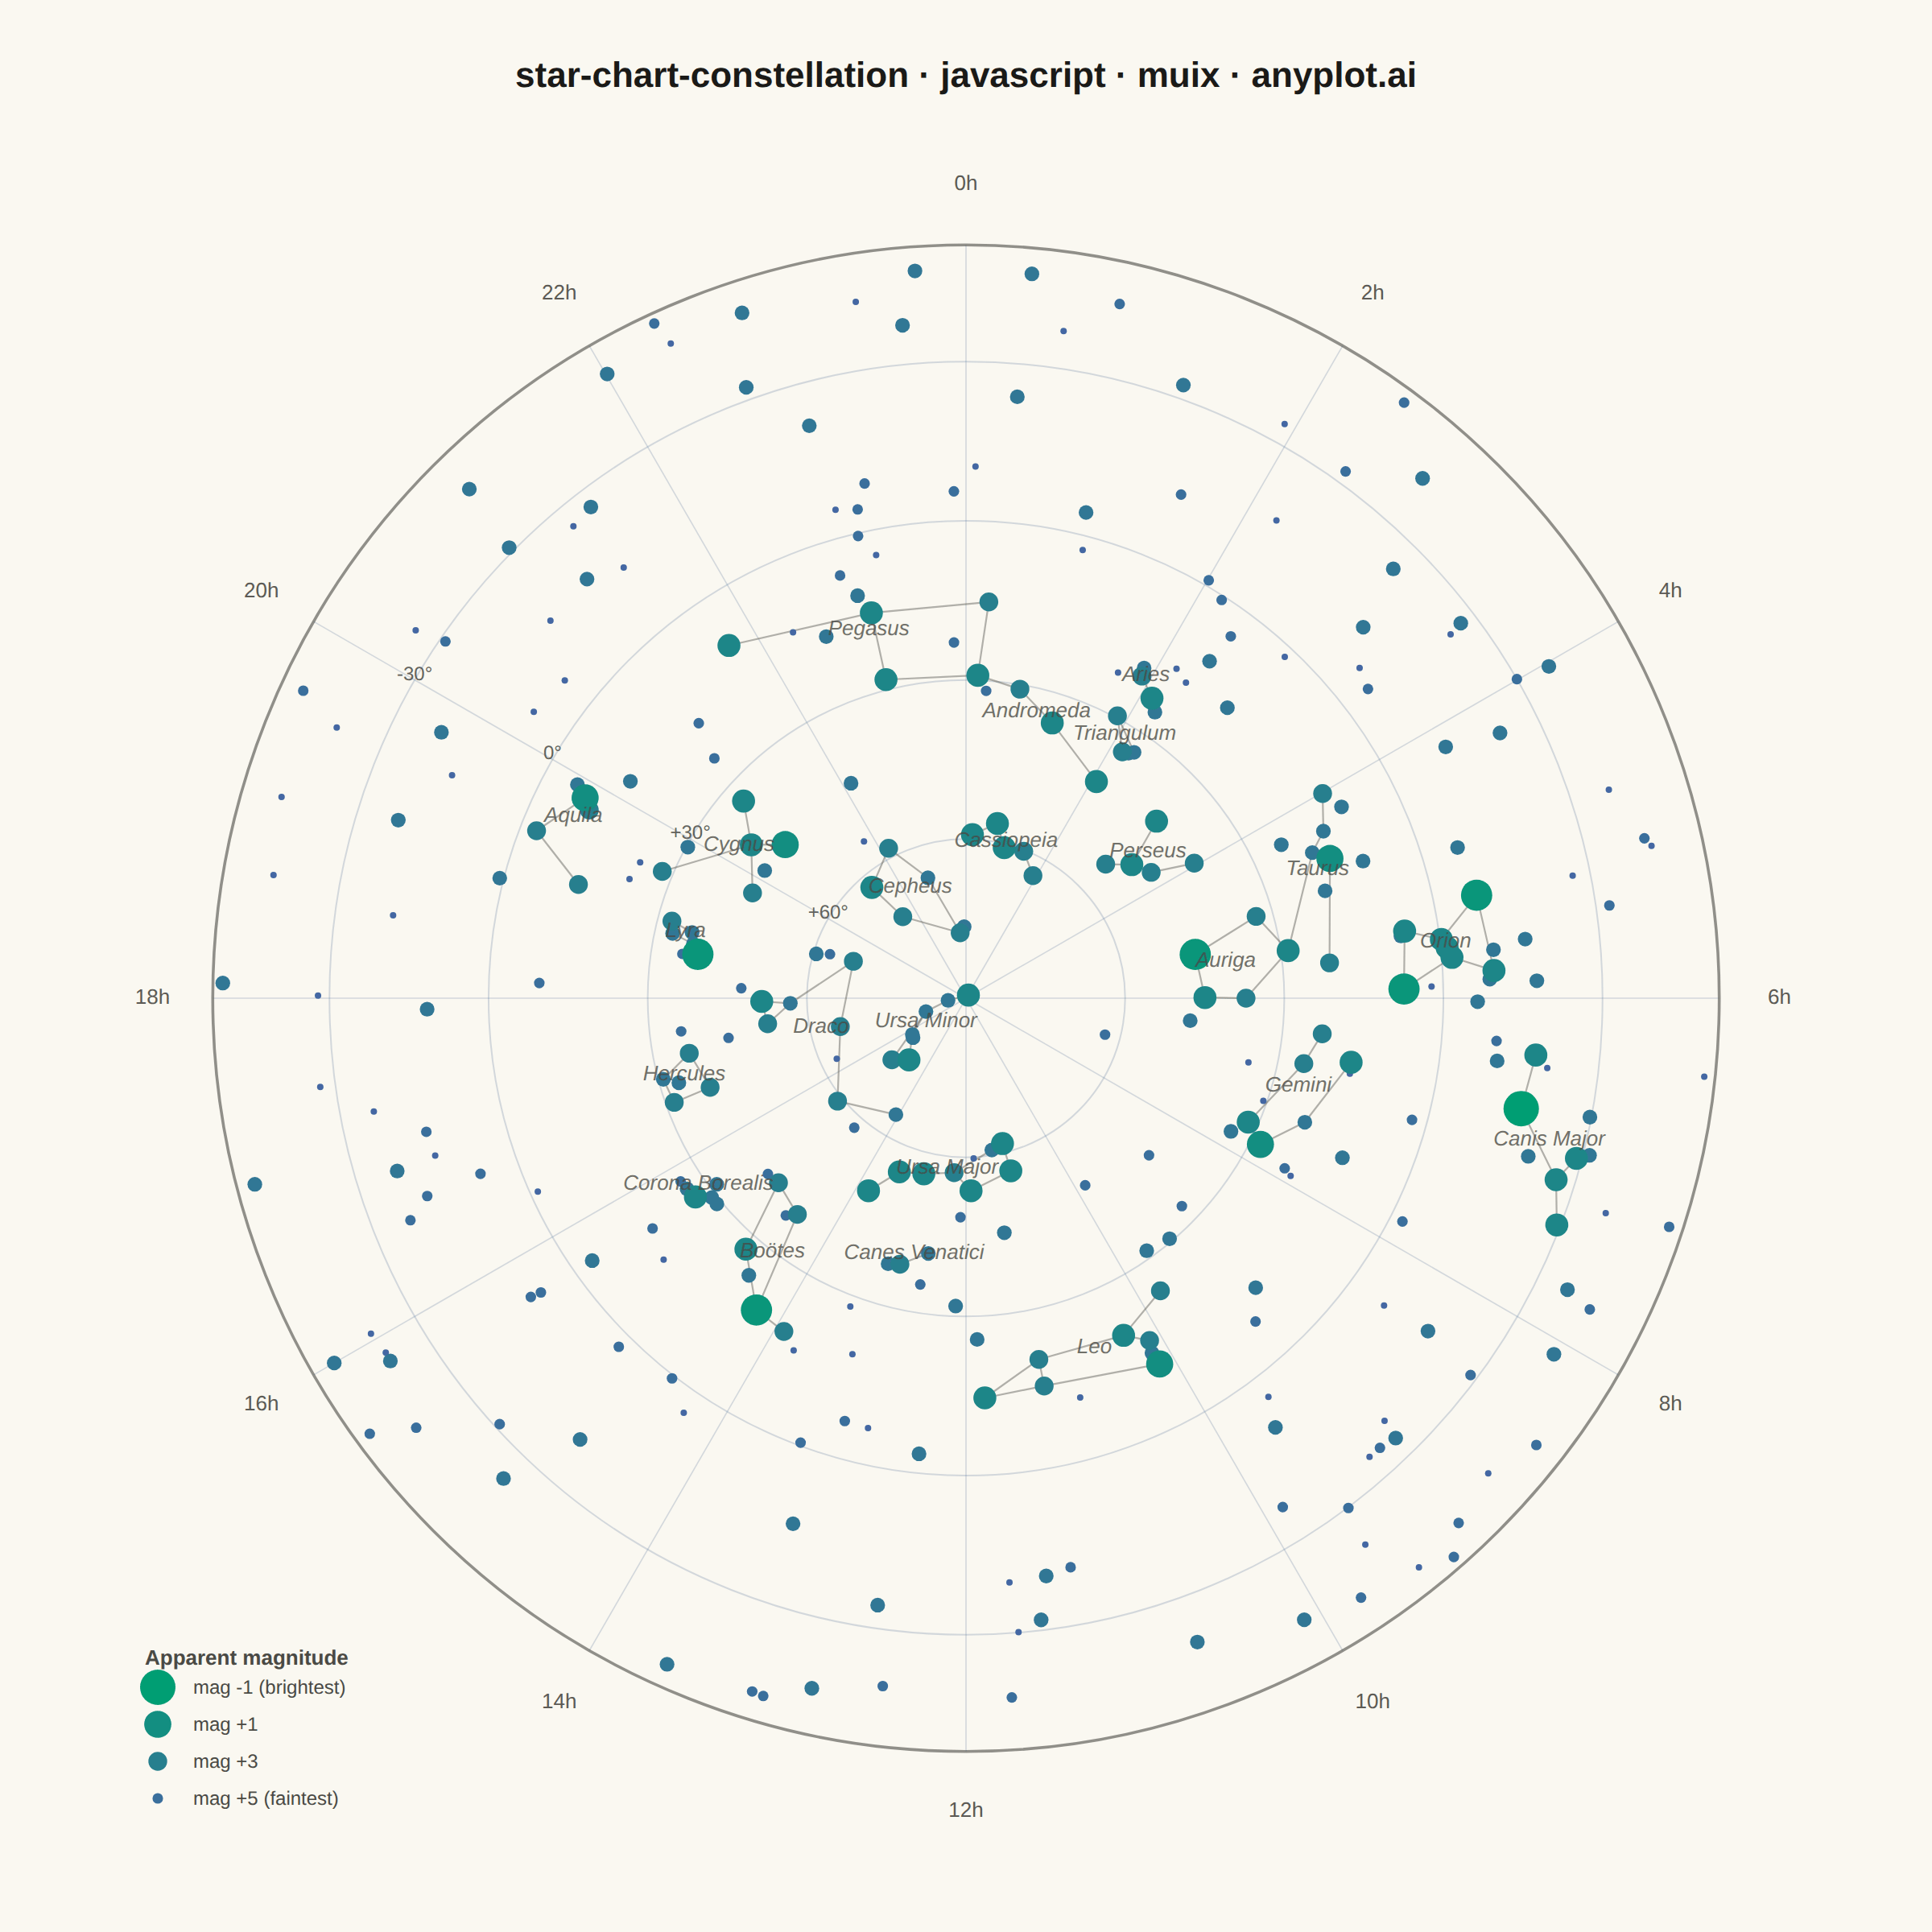
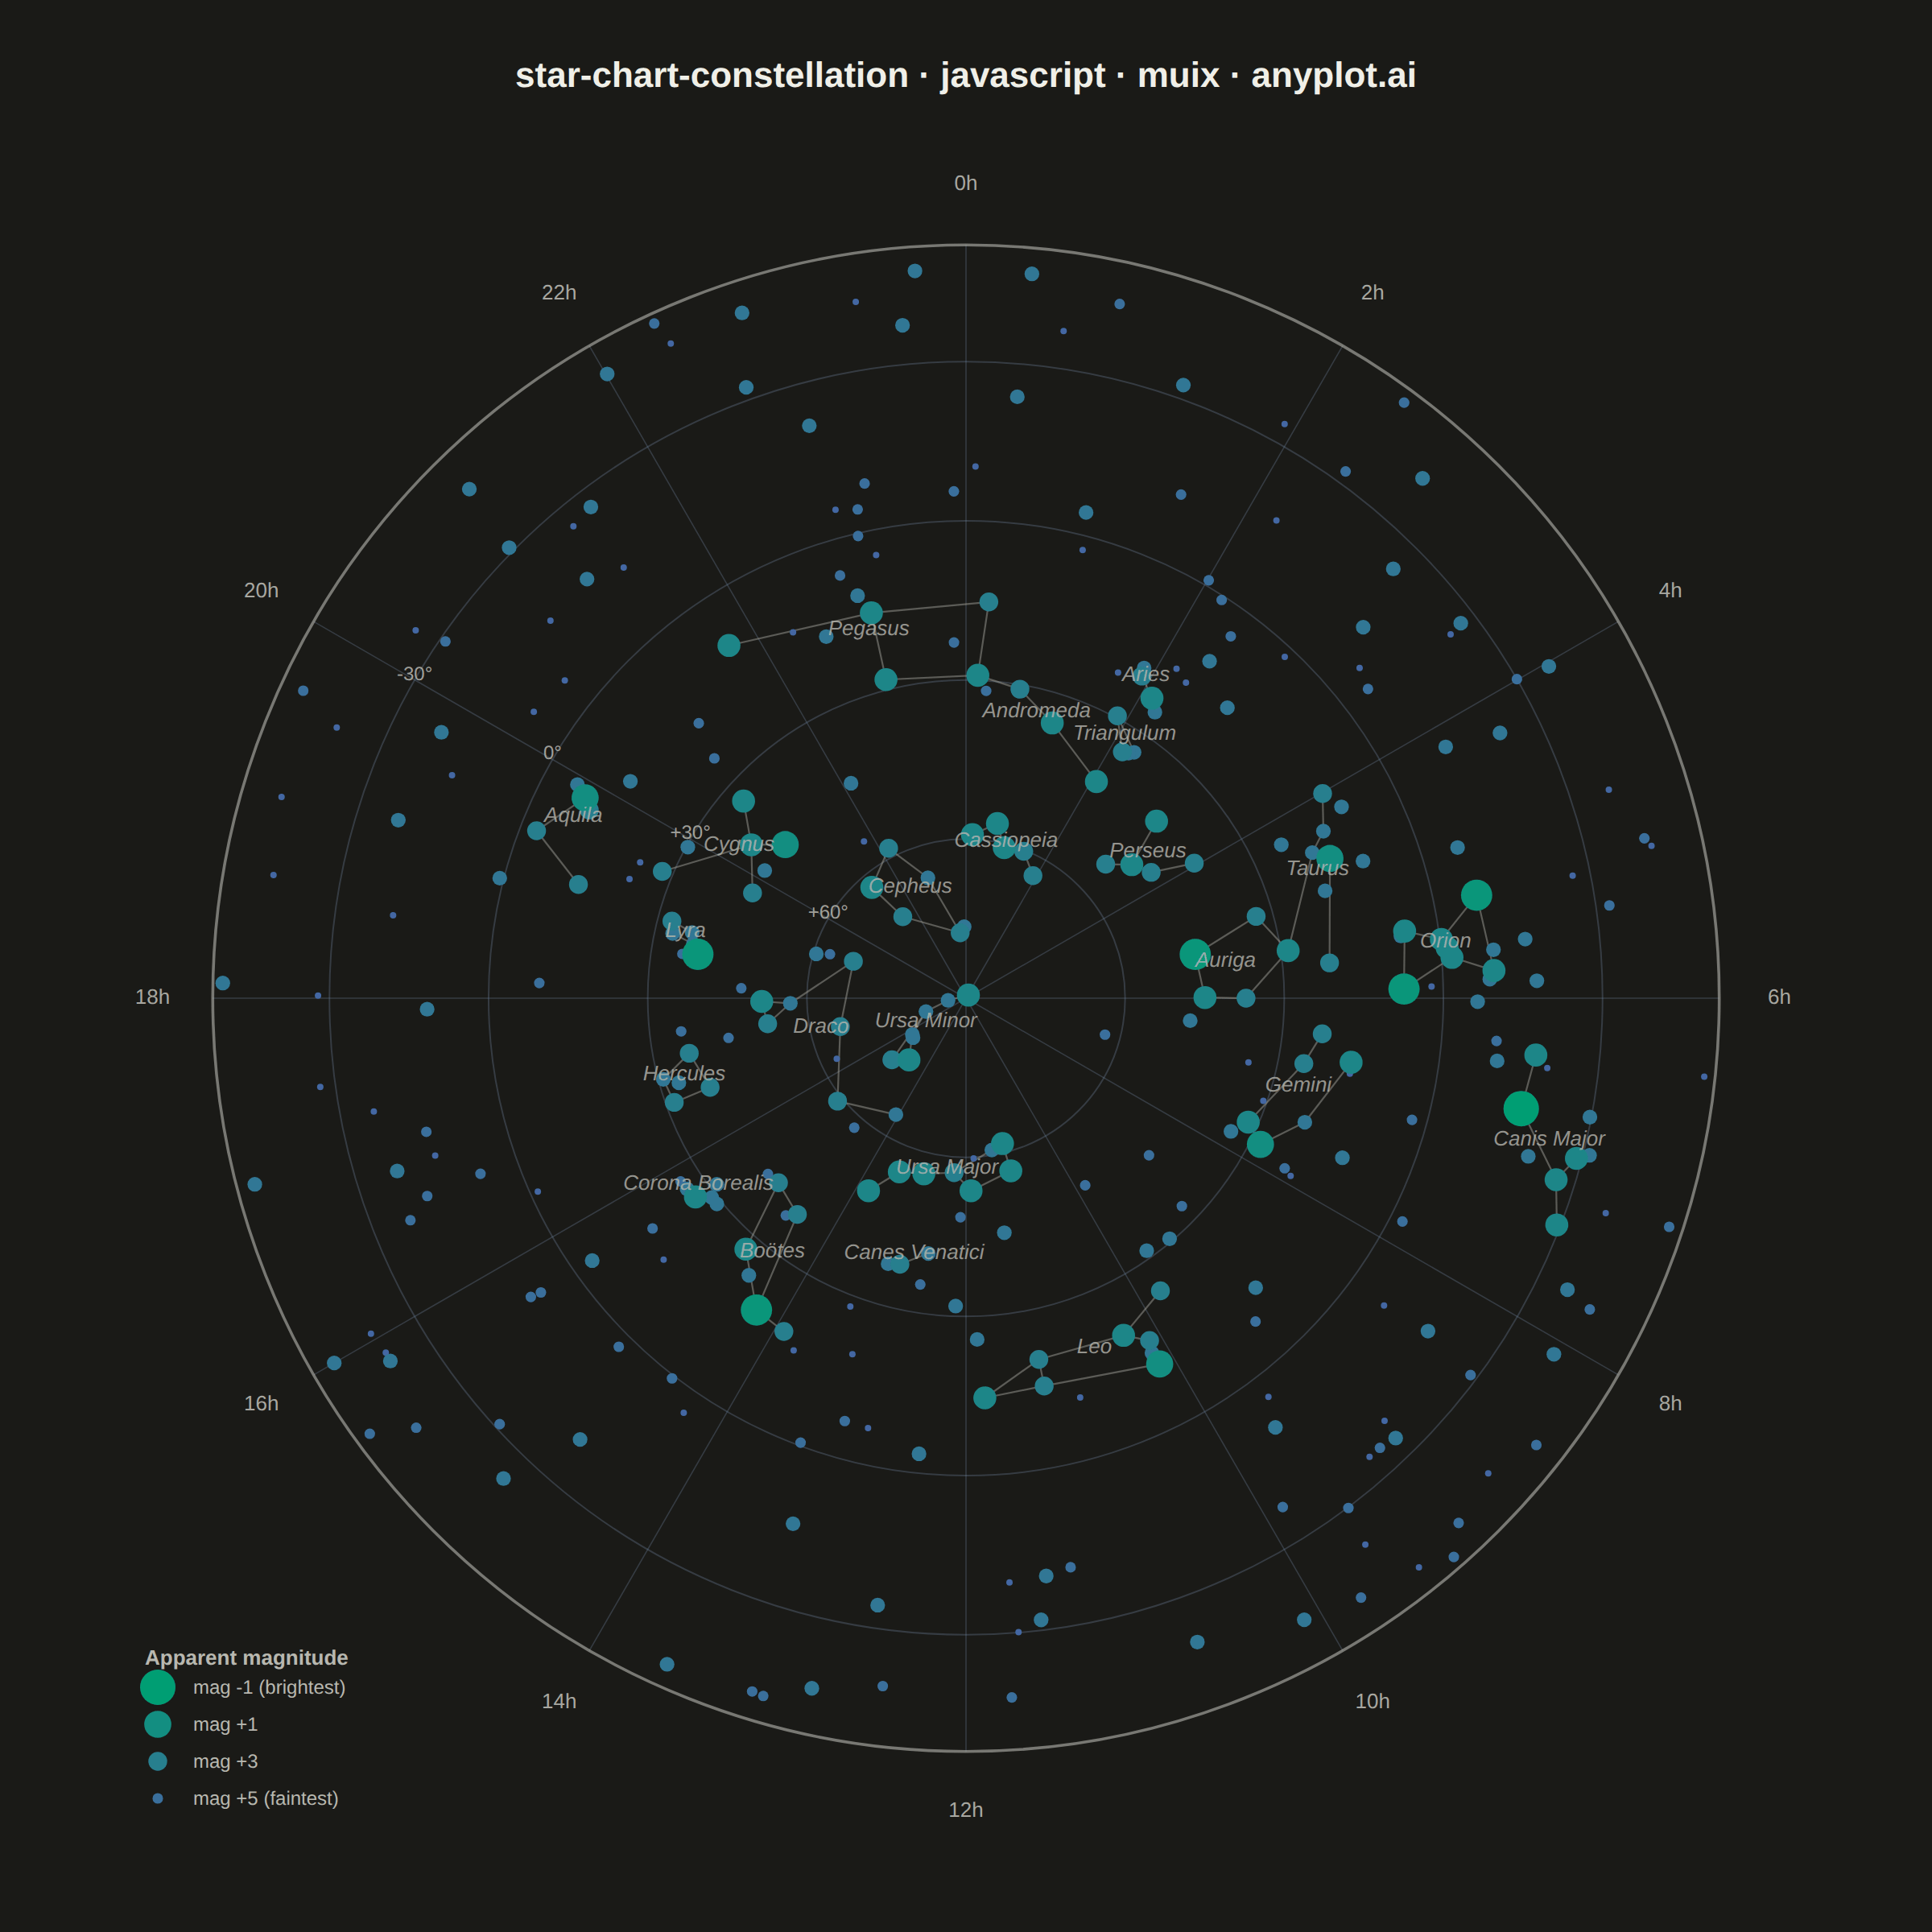
A celestial map that plots stars on a sky projection (stereographic or azimuthal equidistant) with constellation stick-figure lines connecting notable stars. Star apparent magnitudes are represented by point size (brighter stars appear larger), and a coordinate grid overlays the chart for orientation. In the dark theme, a dark background mimics a night sky, making this an intuitive tool for identifying constellations and planning observations.
Preview render from the MUI X Charts implementation.