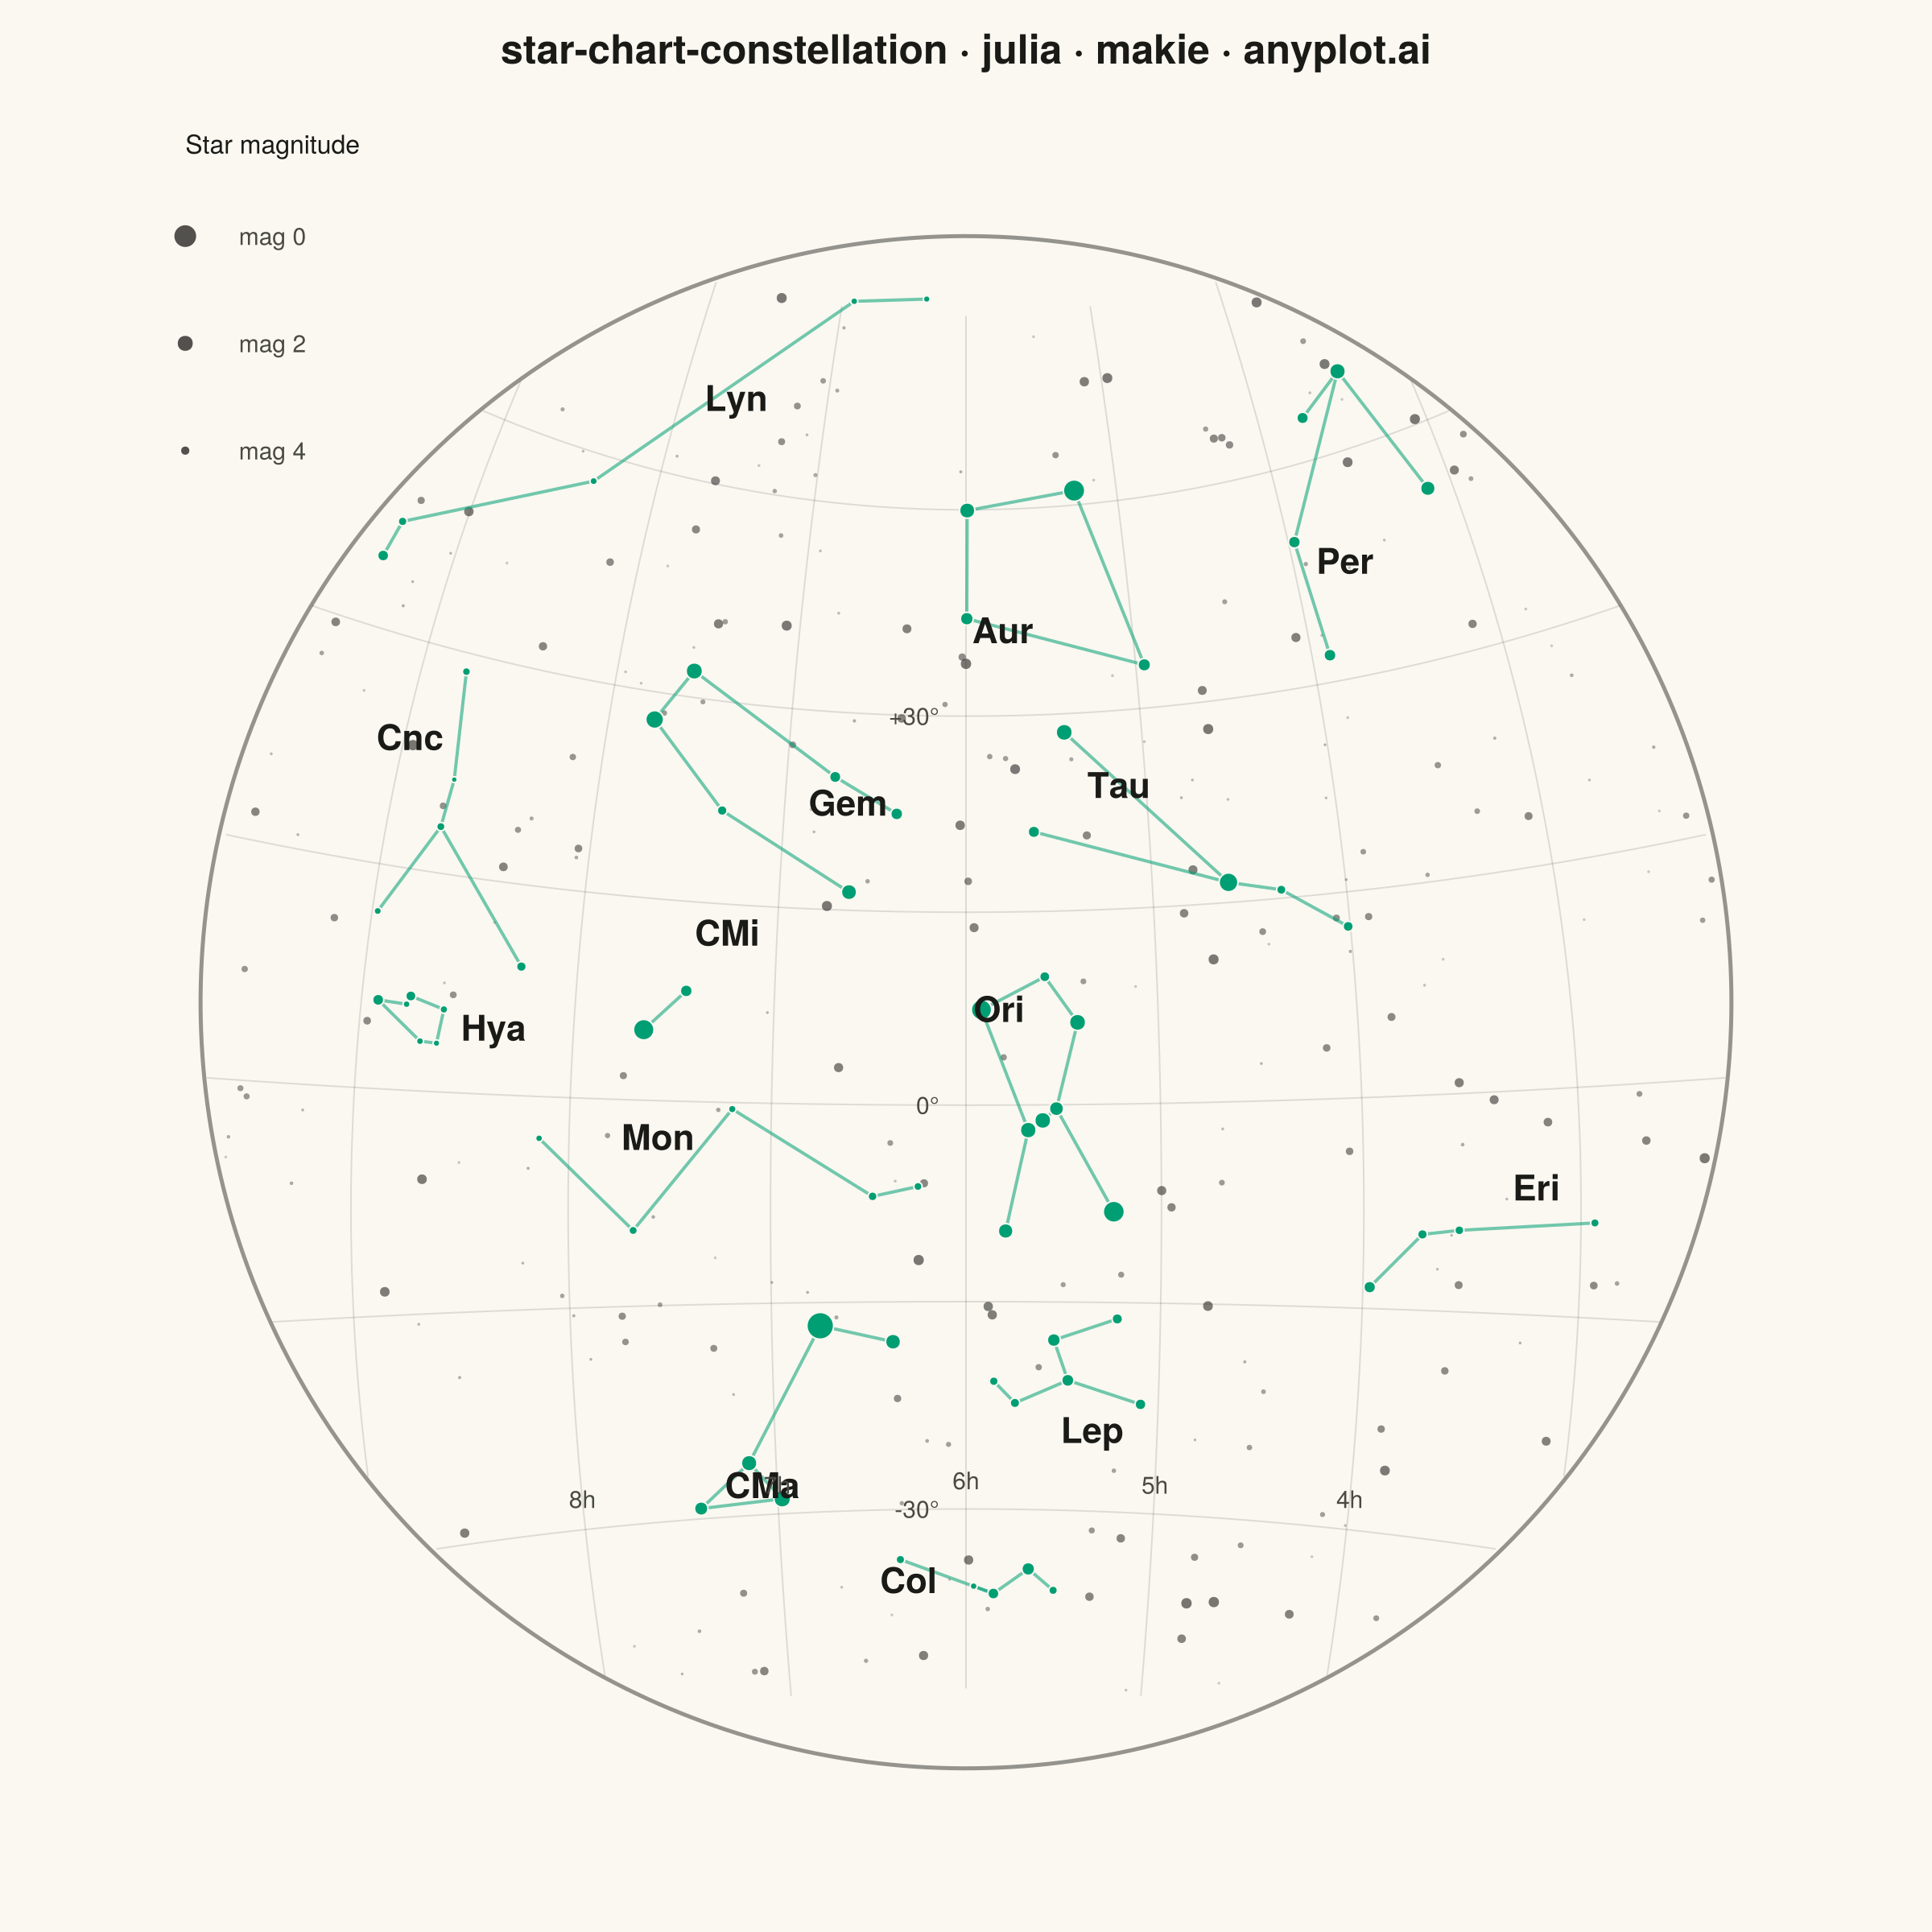
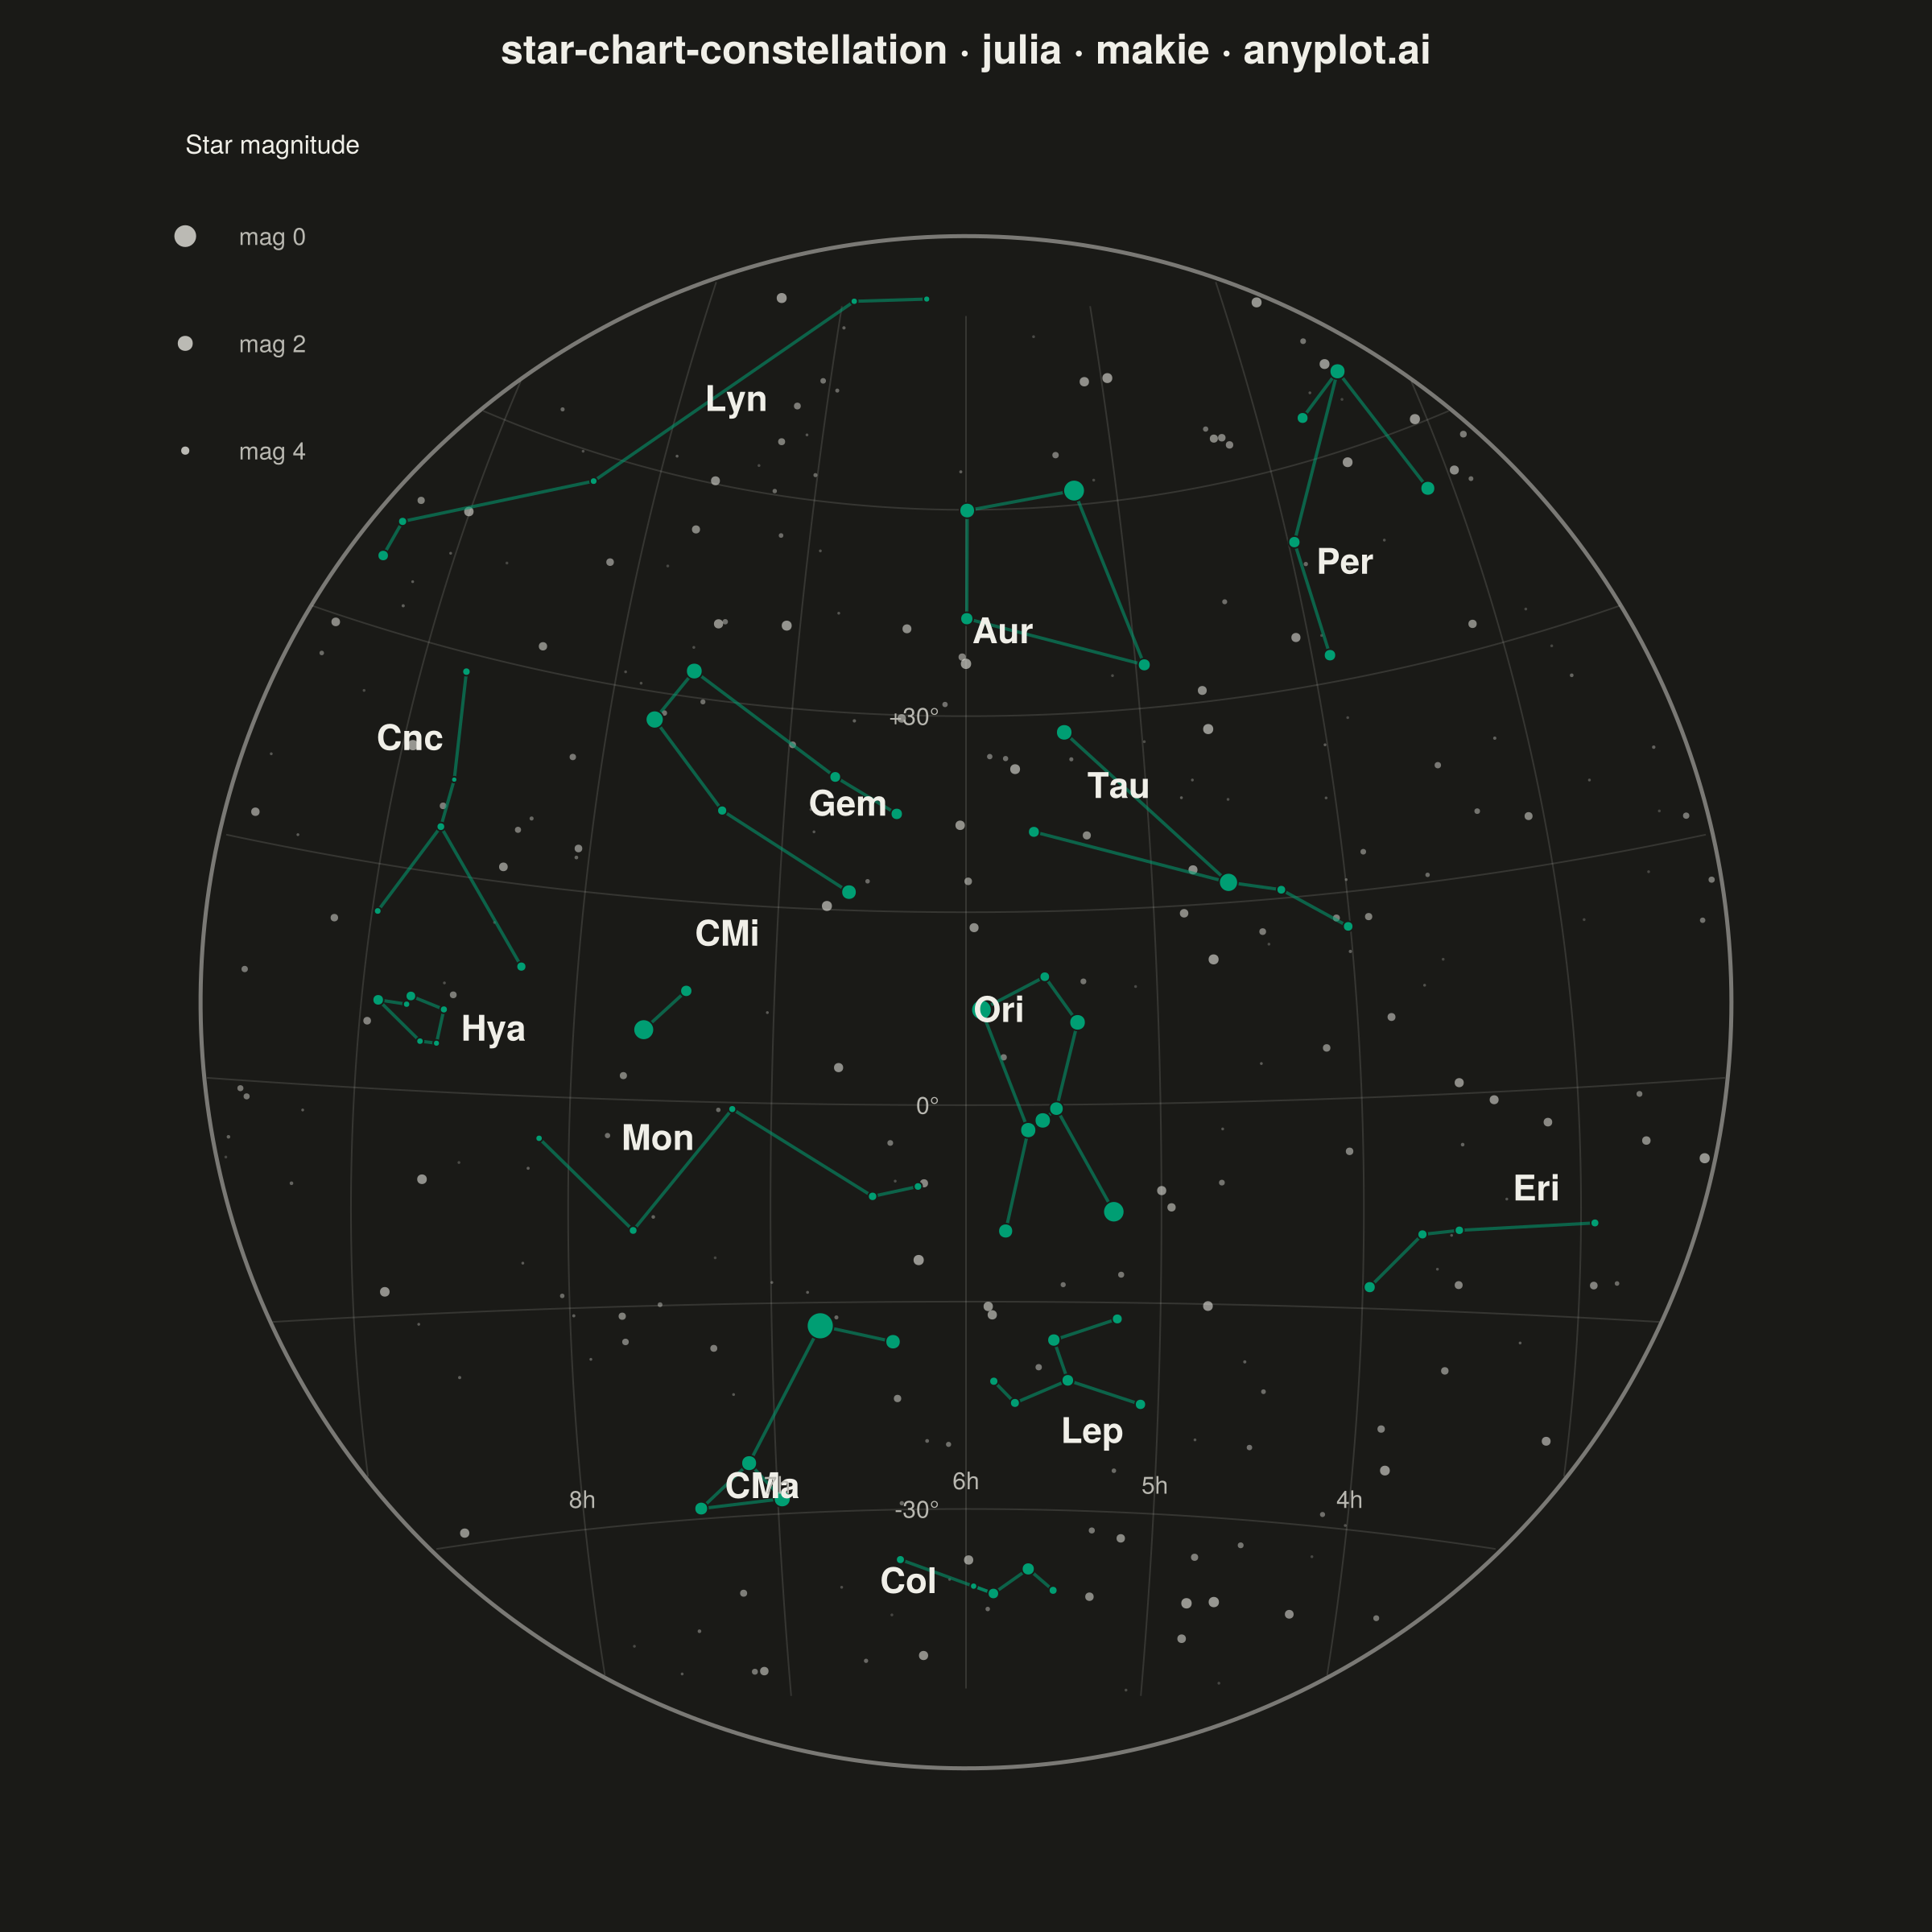
A celestial map that plots stars on a sky projection (stereographic or azimuthal equidistant) with constellation stick-figure lines connecting notable stars. Star apparent magnitudes are represented by point size (brighter stars appear larger), and a coordinate grid overlays the chart for orientation. The dark background mimics a night sky, making this an intuitive tool for identifying constellations and planning observations.
# anyplot.ai
# star-chart-constellation: Star Chart with Constellations
# Library: makie 0.22.10 | Julia 1.11.9
# Quality: 89/100 | Created: 2026-06-17

using CairoMakie
using Colors
using Random
using Statistics

Random.seed!(42)

# --- Theme tokens -----------------------------------------------------------
const THEME    = get(ENV, "ANYPLOT_THEME", "light")
const PAGE_BG  = THEME == "light" ? colorant"#FAF8F1" : colorant"#1A1A17"
const INK      = THEME == "light" ? colorant"#1A1A17" : colorant"#F0EFE8"
const INK_SOFT = THEME == "light" ? colorant"#4A4A44" : colorant"#B8B7B0"
const BRAND    = colorant"#009E73"   # Imprint palette position 1 — constellation accent

# --- Sky window: a stereographic projection centred on the winter sky -------
const RA0  = 6.0     # central Right Ascension (hours)
const DEC0 = 8.0     # central Declination (degrees)
const CMAX = 55.0    # angular radius of the circular sky window (degrees)
const RBND = 2 * tand(CMAX / 2)   # projected radius of the sky boundary circle

# Stereographic projection: (RA hours, Dec degrees) -> planar (x, y).
# x is negated so the chart reads like a view of the sky (RA increases left).
project(ra_h, dec_d) = begin
    ra  = deg2rad(ra_h * 15);  dec  = deg2rad(dec_d)
    ra0 = deg2rad(RA0 * 15);   dec0 = deg2rad(DEC0)
    k = 2 / (1 + sin(dec0) * sin(dec) + cos(dec0) * cos(dec) * cos(ra - ra0))
    (-k * cos(dec) * sin(ra - ra0),
      k * (cos(dec0) * sin(dec) - sin(dec0) * cos(dec) * cos(ra - ra0)))
end

# Angular distance (degrees) of a sky point from the projection centre.
angdist(ra_h, dec_d) = acosd(clamp(
    sind(DEC0) * sind(dec_d) + cosd(DEC0) * cosd(dec_d) * cosd(15 * (ra_h - RA0)),
    -1, 1))

# Apparent magnitude -> marker size: brighter stars (lower mag) render larger.
magsize(m) = clamp((6.4 - m) * 3.0, 2.5, 34.0)

# --- Constellation catalog (bright stars: RA hours, Dec deg, magnitude) -----
const CONSTELLATIONS = [
    (abbr = "Ori",
     stars = [(5.919, 7.407, 0.42), (5.242, -8.202, 0.18), (5.418, 6.350, 1.64),
              (5.796, -9.670, 2.07), (5.679, -1.943, 1.74), (5.604, -1.202, 1.69),
              (5.533, -0.299, 2.23), (5.585, 9.934, 3.39)],
     edges = [(1, 5), (3, 7), (5, 6), (6, 7), (5, 4), (7, 2), (1, 8), (3, 8)]),
    (abbr = "Tau",
     stars = [(4.599, 16.509, 0.85), (5.438, 28.608, 1.65), (5.627, 21.142, 3.00),
              (4.330, 15.628, 3.65), (4.011, 12.490, 3.40)],
     edges = [(5, 4), (4, 1), (1, 2), (1, 3)]),
    (abbr = "Gem",
     stars = [(7.755, 28.026, 1.14), (7.577, 31.888, 1.58), (6.629, 16.399, 1.93),
              (7.335, 21.982, 3.53), (6.732, 25.131, 3.06), (6.383, 22.514, 2.87)],
     edges = [(2, 1), (1, 4), (4, 3), (2, 5), (5, 6)]),
    (abbr = "CMa",
     stars = [(6.752, -16.716, -1.46), (6.378, -17.956, 1.98), (7.140, -26.393, 1.83),
              (6.977, -28.972, 1.50), (7.402, -29.303, 2.45)],
     edges = [(1, 2), (1, 3), (3, 4), (4, 5), (3, 5)]),
    (abbr = "CMi",
     stars = [(7.655, 5.225, 0.34), (7.452, 8.289, 2.89)],
     edges = [(1, 2)]),
    (abbr = "Aur",
     stars = [(5.278, 45.998, 0.08), (5.992, 44.947, 1.90),
              (5.995, 37.213, 2.62), (4.950, 33.166, 2.69)],
     edges = [(1, 2), (2, 3), (3, 4), (4, 1)]),
    (abbr = "Per",
     stars = [(3.405, 49.861, 1.79), (3.136, 40.956, 2.12), (3.902, 31.884, 2.85),
              (3.964, 40.010, 2.89), (3.715, 47.788, 3.01)],
     edges = [(5, 1), (1, 4), (4, 3), (1, 2)]),
    (abbr = "Eri",
     stars = [(2.939, -8.898, 3.89), (3.549, -9.458, 3.73),
              (3.721, -9.764, 3.54), (3.967, -13.509, 2.95)],
     edges = [(1, 2), (2, 3), (3, 4)]),
    (abbr = "Lep",
     stars = [(5.545, -17.822, 2.58), (5.470, -20.759, 2.81), (5.091, -22.371, 3.19),
              (5.220, -16.205, 3.31), (5.744, -22.448, 3.59), (5.855, -20.879, 3.81)],
     edges = [(3, 2), (2, 1), (1, 4), (2, 5), (5, 6)]),
    (abbr = "Col",
     stars = [(5.660, -34.074, 2.65), (5.849, -35.768, 3.12), (5.958, -35.283, 4.36),
              (5.521, -35.470, 3.87), (6.357, -33.437, 3.85)],
     edges = [(4, 1), (1, 2), (2, 5), (2, 3)]),
    (abbr = "Mon",
     stars = [(6.480, -7.033, 3.74), (7.685, -9.551, 3.93), (6.247, -6.275, 3.98),
              (7.198, -0.493, 4.15), (8.143, -2.983, 4.34)],
     edges = [(3, 1), (1, 4), (4, 2), (2, 5)]),
    (abbr = "Cnc",
     stars = [(8.275, 9.186, 3.53), (8.745, 18.154, 3.94), (8.778, 28.760, 4.02),
              (8.975, 11.858, 4.26), (8.722, 21.469, 4.66)],
     edges = [(3, 5), (5, 2), (2, 4), (2, 1)]),
    (abbr = "Lyn",
     stars = [(9.351, 34.392, 3.14), (9.318, 36.803, 3.82), (8.382, 43.188, 4.25),
              (6.908, 58.421, 4.35), (6.323, 59.011, 4.44)],
     edges = [(1, 2), (2, 3), (3, 4), (4, 5)]),
    (abbr = "Hya",
     stars = [(8.925, 5.946, 3.11), (8.779, 6.419, 3.38), (8.622, 5.704, 4.14),
              (8.644, 3.341, 4.45), (8.720, 3.399, 4.30), (8.795, 5.835, 4.35)],
     edges = [(1, 6), (6, 2), (2, 3), (3, 4), (4, 5), (5, 1)]),
]

# --- Build plotting arrays from the catalog ---------------------------------
star_x = Float64[]; star_y = Float64[]; star_ms = Float64[]
edge_x = Float64[]; edge_y = Float64[]
label_x = Float64[]; label_y = Float64[]; label_t = String[]
for c in CONSTELLATIONS
    for s in c.stars
        x, y = project(s[1], s[2])
        push!(star_x, x); push!(star_y, y); push!(star_ms, magsize(s[3]))
    end
    for (i, j) in c.edges
        x1, y1 = project(c.stars[i][1], c.stars[i][2])
        x2, y2 = project(c.stars[j][1], c.stars[j][2])
        append!(edge_x, (x1, x2, NaN)); append!(edge_y, (y1, y2, NaN))
    end
    cra = mean(s[1] for s in c.stars); cdec = mean(s[2] for s in c.stars)
    lx, ly = project(cra, cdec)
    # Offset the label away from the brightest (lowest-magnitude) star so it
    # never crowds the most prominent marker of the group.
    bs = c.stars[argmin(s[3] for s in c.stars)]
    bx, by = project(bs[1], bs[2])
    dx = lx - bx; dy = ly - by; nrm = hypot(dx, dy)
    off = 0.11 * RBND
    if nrm < 1e-6
        push!(label_x, lx); push!(label_y, ly + off)
    else
        push!(label_x, lx + off * dx / nrm); push!(label_y, ly + off * dy / nrm)
    end
    push!(label_t, c.abbr)
end

# --- Background star field (faint stars filling the sky window) --------------
n_cand = 1100
cand_ra  = 2.0 .+ 8.0 .* rand(n_cand)
cand_dec = -42.0 .+ 100.0 .* rand(n_cand)
cand_mag = 3.3 .+ 3.2 .* rand(n_cand)
keep = [angdist(cand_ra[i], cand_dec[i]) <= CMAX * 0.992 for i in 1:n_cand]
field_ra = cand_ra[keep]; field_dec = cand_dec[keep]; field_mag = cand_mag[keep]
n_field = min(250, length(field_ra))
field_x = Float64[]; field_y = Float64[]
for i in 1:n_field
    x, y = project(field_ra[i], field_dec[i])
    push!(field_x, x); push!(field_y, y)
end
field_ms = magsize.(field_mag[1:n_field])
field_color = [RGBAf(INK.r, INK.g, INK.b, clamp(0.22 + (6.4 - m) * 0.12, 0.2, 0.85))
               for m in field_mag[1:n_field]]

# --- Coordinate grid + circular sky boundary --------------------------------
θ = range(0, 2π, length = 400)
boundary_x = RBND .* cos.(θ); boundary_y = RBND .* sin.(θ)

grid_x = Float64[]; grid_y = Float64[]
for d in (-30, -15, 0, 15, 30, 45)                     # parallels (constant Dec)
    for ra in range(2.0, 10.0, length = 260)
        if angdist(ra, d) <= CMAX
            x, y = project(ra, d); push!(grid_x, x); push!(grid_y, y)
        else
            push!(grid_x, NaN); push!(grid_y, NaN)
        end
    end
    push!(grid_x, NaN); push!(grid_y, NaN)
end
for r in (3, 4, 5, 6, 7, 8, 9)                          # meridians (constant RA)
    for dec in range(-42, 58, length = 260)
        if angdist(r, dec) <= CMAX
            x, y = project(r, dec); push!(grid_x, x); push!(grid_y, y)
        else
            push!(grid_x, NaN); push!(grid_y, NaN)
        end
    end
    push!(grid_x, NaN); push!(grid_y, NaN)
end

# Grid tick labels: Dec along the central meridian, RA along a lower parallel.
dec_tx = Float64[]; dec_ty = Float64[]; dec_tt = String[]
for d in (-30, 0, 30)
    x, y = project(RA0, d)
    push!(dec_tx, x - 0.035 * RBND); push!(dec_ty, y)
    push!(dec_tt, (d > 0 ? "+" : "") * string(d) * "°")
end
ra_tx = Float64[]; ra_ty = Float64[]; ra_tt = String[]
for r in (4, 5, 6, 7, 8)
    x, y = project(r, -28)
    push!(ra_tx, x); push!(ra_ty, y); push!(ra_tt, string(r) * "h")
end

# Magnitude legend, parked in the empty corner outside the circular window.
leg_x    = -1.02 * RBND
leg_ys   = collect((1.00, 0.86, 0.72) .* RBND)
leg_mags = (0.0, 2.0, 4.0)

# --- Plot -------------------------------------------------------------------
fig = Figure(size = (1200, 1200), fontsize = 16, backgroundcolor = PAGE_BG)
ax = Axis(fig[1, 1];
    title = "star-chart-constellation · julia · makie · anyplot.ai",
    titlesize = 25, titlecolor = INK, titlegap = 16,
    backgroundcolor = PAGE_BG, aspect = DataAspect())
hidedecorations!(ax)
hidespines!(ax)
limits!(ax, -1.18 * RBND, 1.18 * RBND, -1.18 * RBND, 1.18 * RBND)

# coordinate grid + sky boundary
lines!(ax, grid_x, grid_y; color = RGBAf(INK.r, INK.g, INK.b, 0.13), linewidth = 1.0)
lines!(ax, boundary_x, boundary_y; color = RGBAf(INK.r, INK.g, INK.b, 0.45), linewidth = 2.5)

# background star field
scatter!(ax, field_x, field_y; markersize = field_ms, color = field_color, strokewidth = 0)

# constellation stick figures
lines!(ax, edge_x, edge_y; color = RGBAf(BRAND.r, BRAND.g, BRAND.b, 0.55), linewidth = 2.0)

# constellation bright stars
scatter!(ax, star_x, star_y; markersize = star_ms, color = BRAND,
    strokecolor = PAGE_BG, strokewidth = 1.0)

# constellation name labels
text!(ax, label_x, label_y; text = label_t, align = (:center, :bottom),
    color = INK, fontsize = 22, font = :bold)

# coordinate tick labels
text!(ax, dec_tx, dec_ty; text = dec_tt, align = (:right, :center),
    color = INK_SOFT, fontsize = 15)
text!(ax, ra_tx, ra_ty; text = ra_tt, align = (:center, :center),
    color = INK_SOFT, fontsize = 15)

# magnitude legend
scatter!(ax, fill(leg_x, 3), leg_ys; markersize = collect(magsize.(leg_mags)),
    color = RGBAf(INK.r, INK.g, INK.b, 0.75), strokewidth = 0)
text!(ax, fill(leg_x + 0.07 * RBND, 3), leg_ys;
    text = ["mag $(Int(m))" for m in leg_mags], align = (:left, :center),
    color = INK_SOFT, fontsize = 15)
text!(ax, leg_x, 1.12 * RBND; text = "Star magnitude", align = (:left, :center),
    color = INK, fontsize = 16)

# --- Save -------------------------------------------------------------------
save("plot-$(THEME).png", fig; px_per_unit = 2)
Runnable source as JSON, for any HTTP client: https://api.anyplot.ai/specs/star-chart-constellation/makie/code. Any spec id and library id listed in llms-full.txt fit the same URL shape; every URL below is complete and callable.
{
  "spec_id": "star-chart-constellation",
  "language": "julia",
  "library": "makie",
  "page": "https://anyplot.ai/star-chart-constellation/julia/makie",
  "hub": "https://anyplot.ai/star-chart-constellation",
  "code_json": "https://api.anyplot.ai/specs/star-chart-constellation/makie/code",
  "spec_json": "https://api.anyplot.ai/specs/star-chart-constellation",
  "render_light_png": "https://storage.googleapis.com/anyplot-images/plots/star-chart-constellation/julia/makie/plot-light.png",
  "render_dark_png": "https://storage.googleapis.com/anyplot-images/plots/star-chart-constellation/julia/makie/plot-dark.png",
  "quality_score": 89.0,
  "license": "MIT",
  "guide": "https://anyplot.ai/llms.txt"
}
Part of Star Chart with Constellations on anyplot.ai.