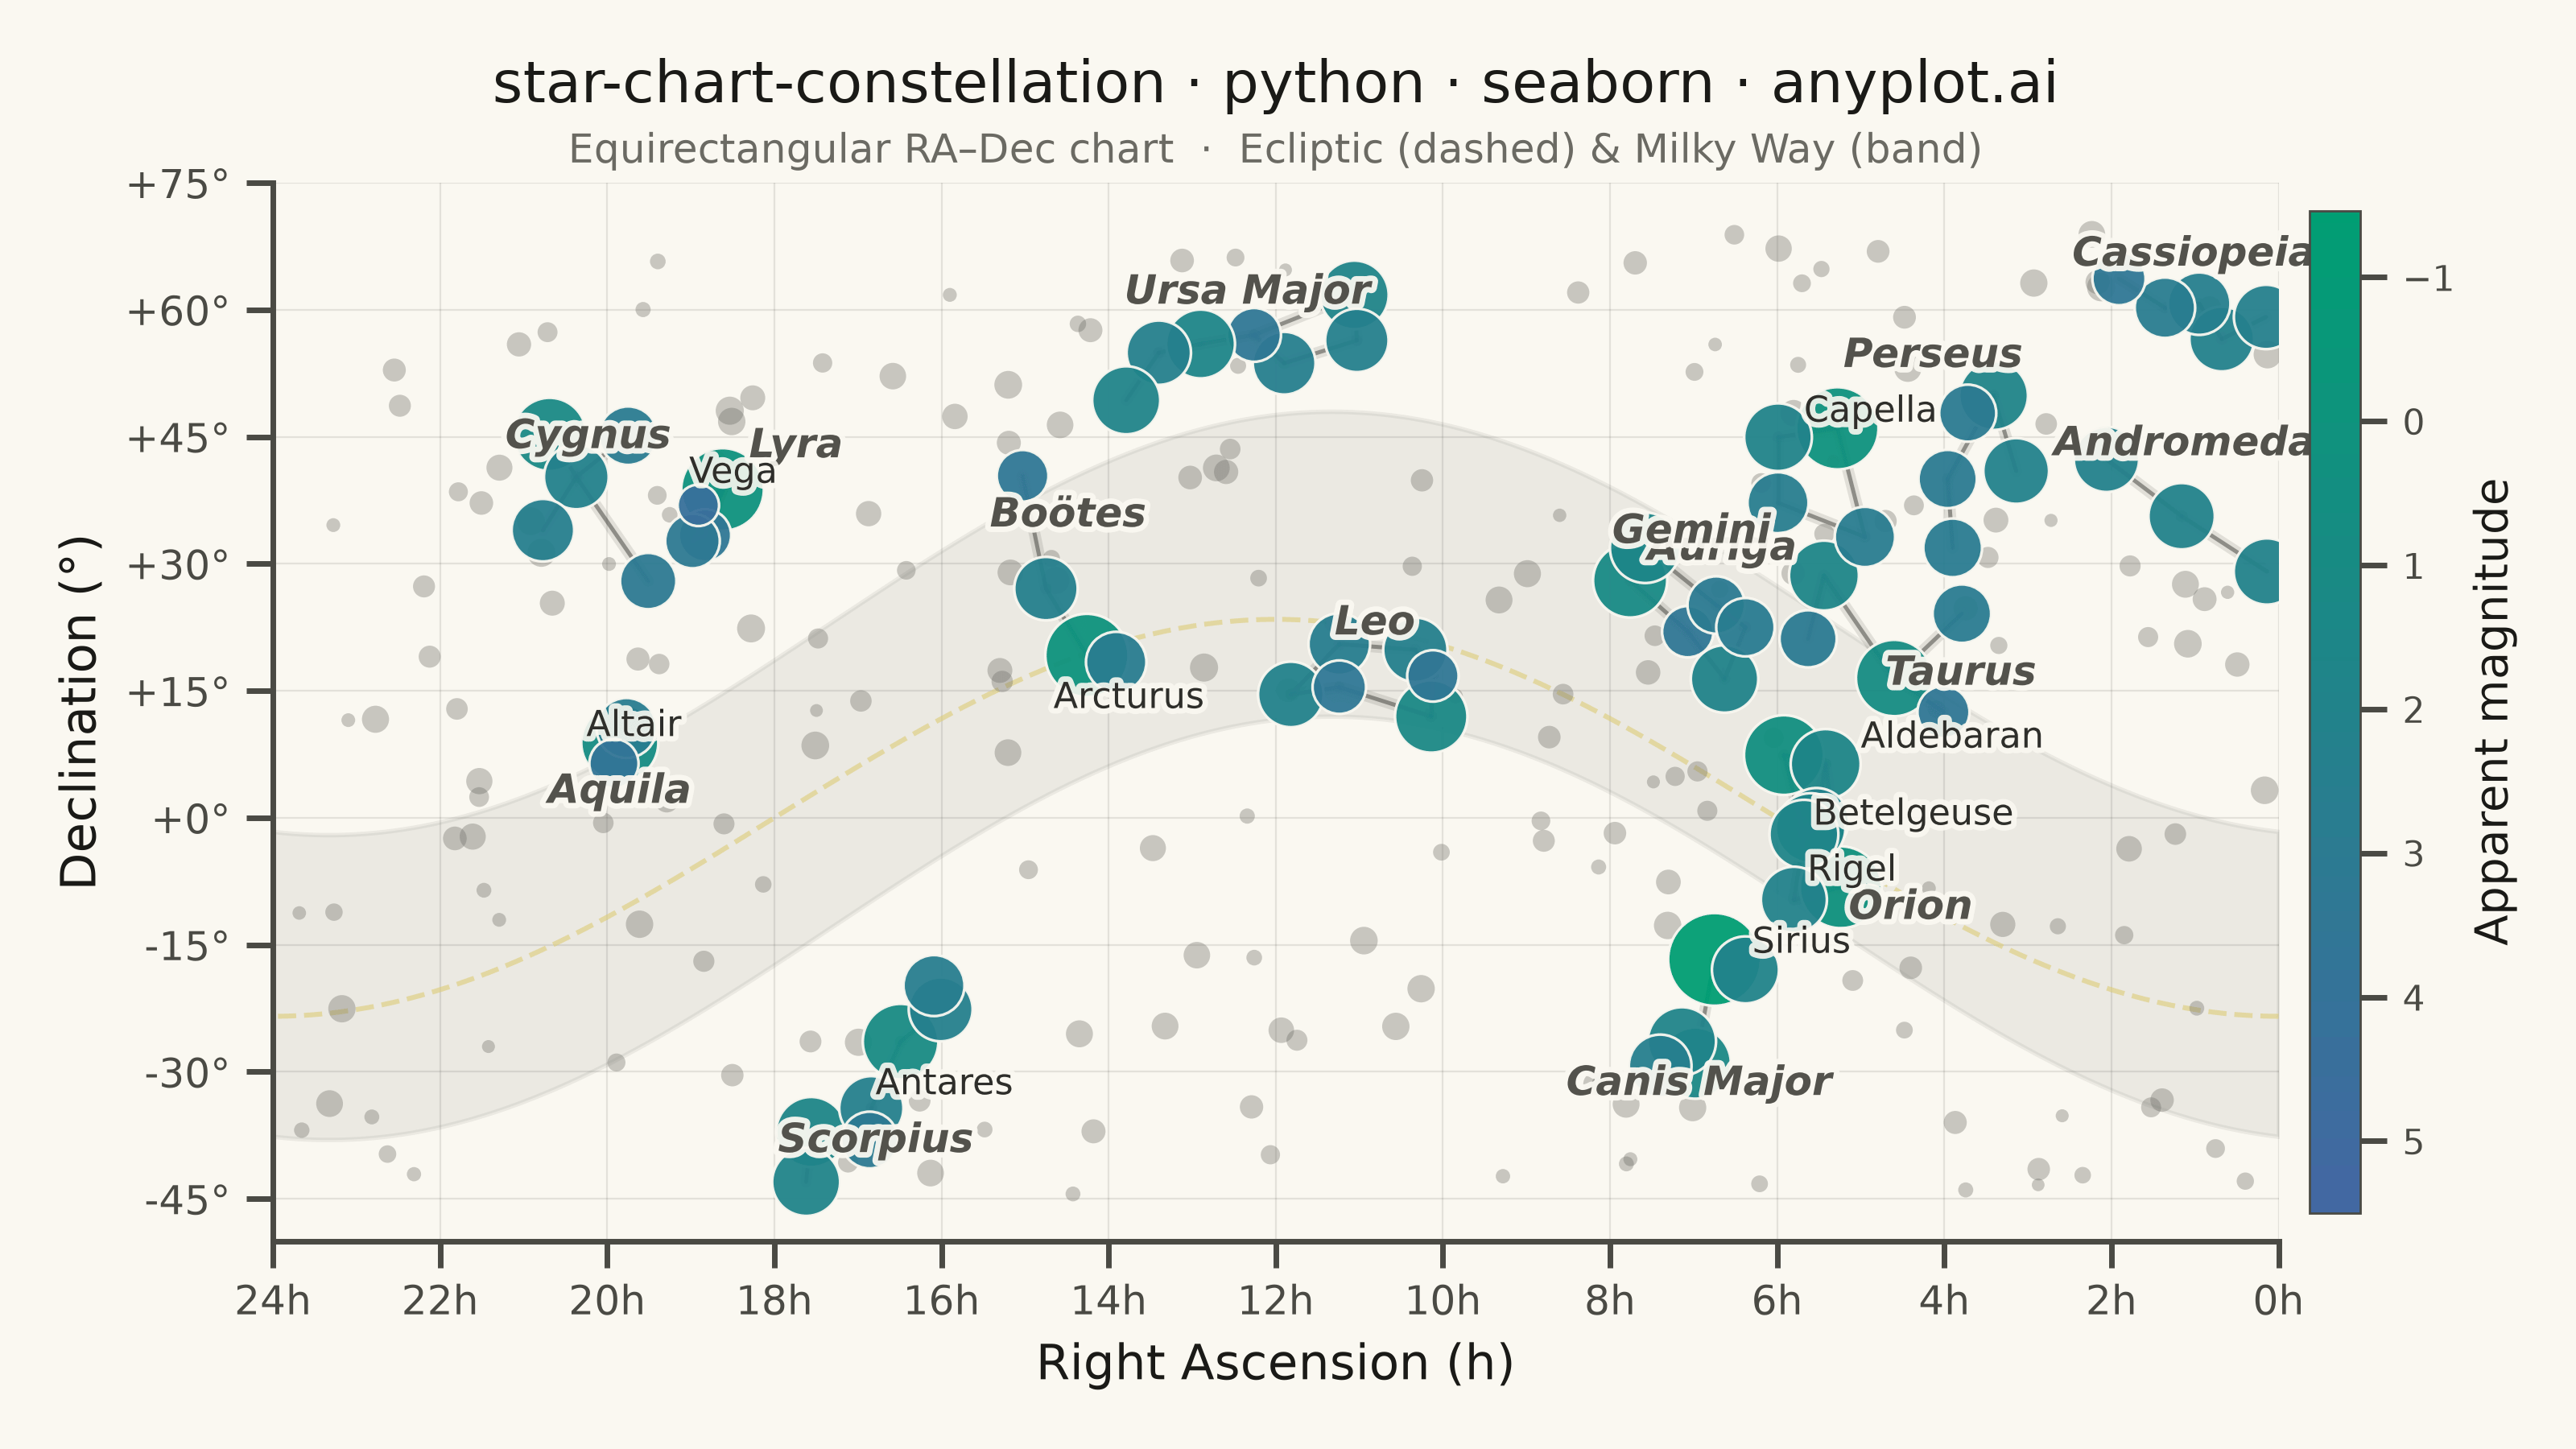
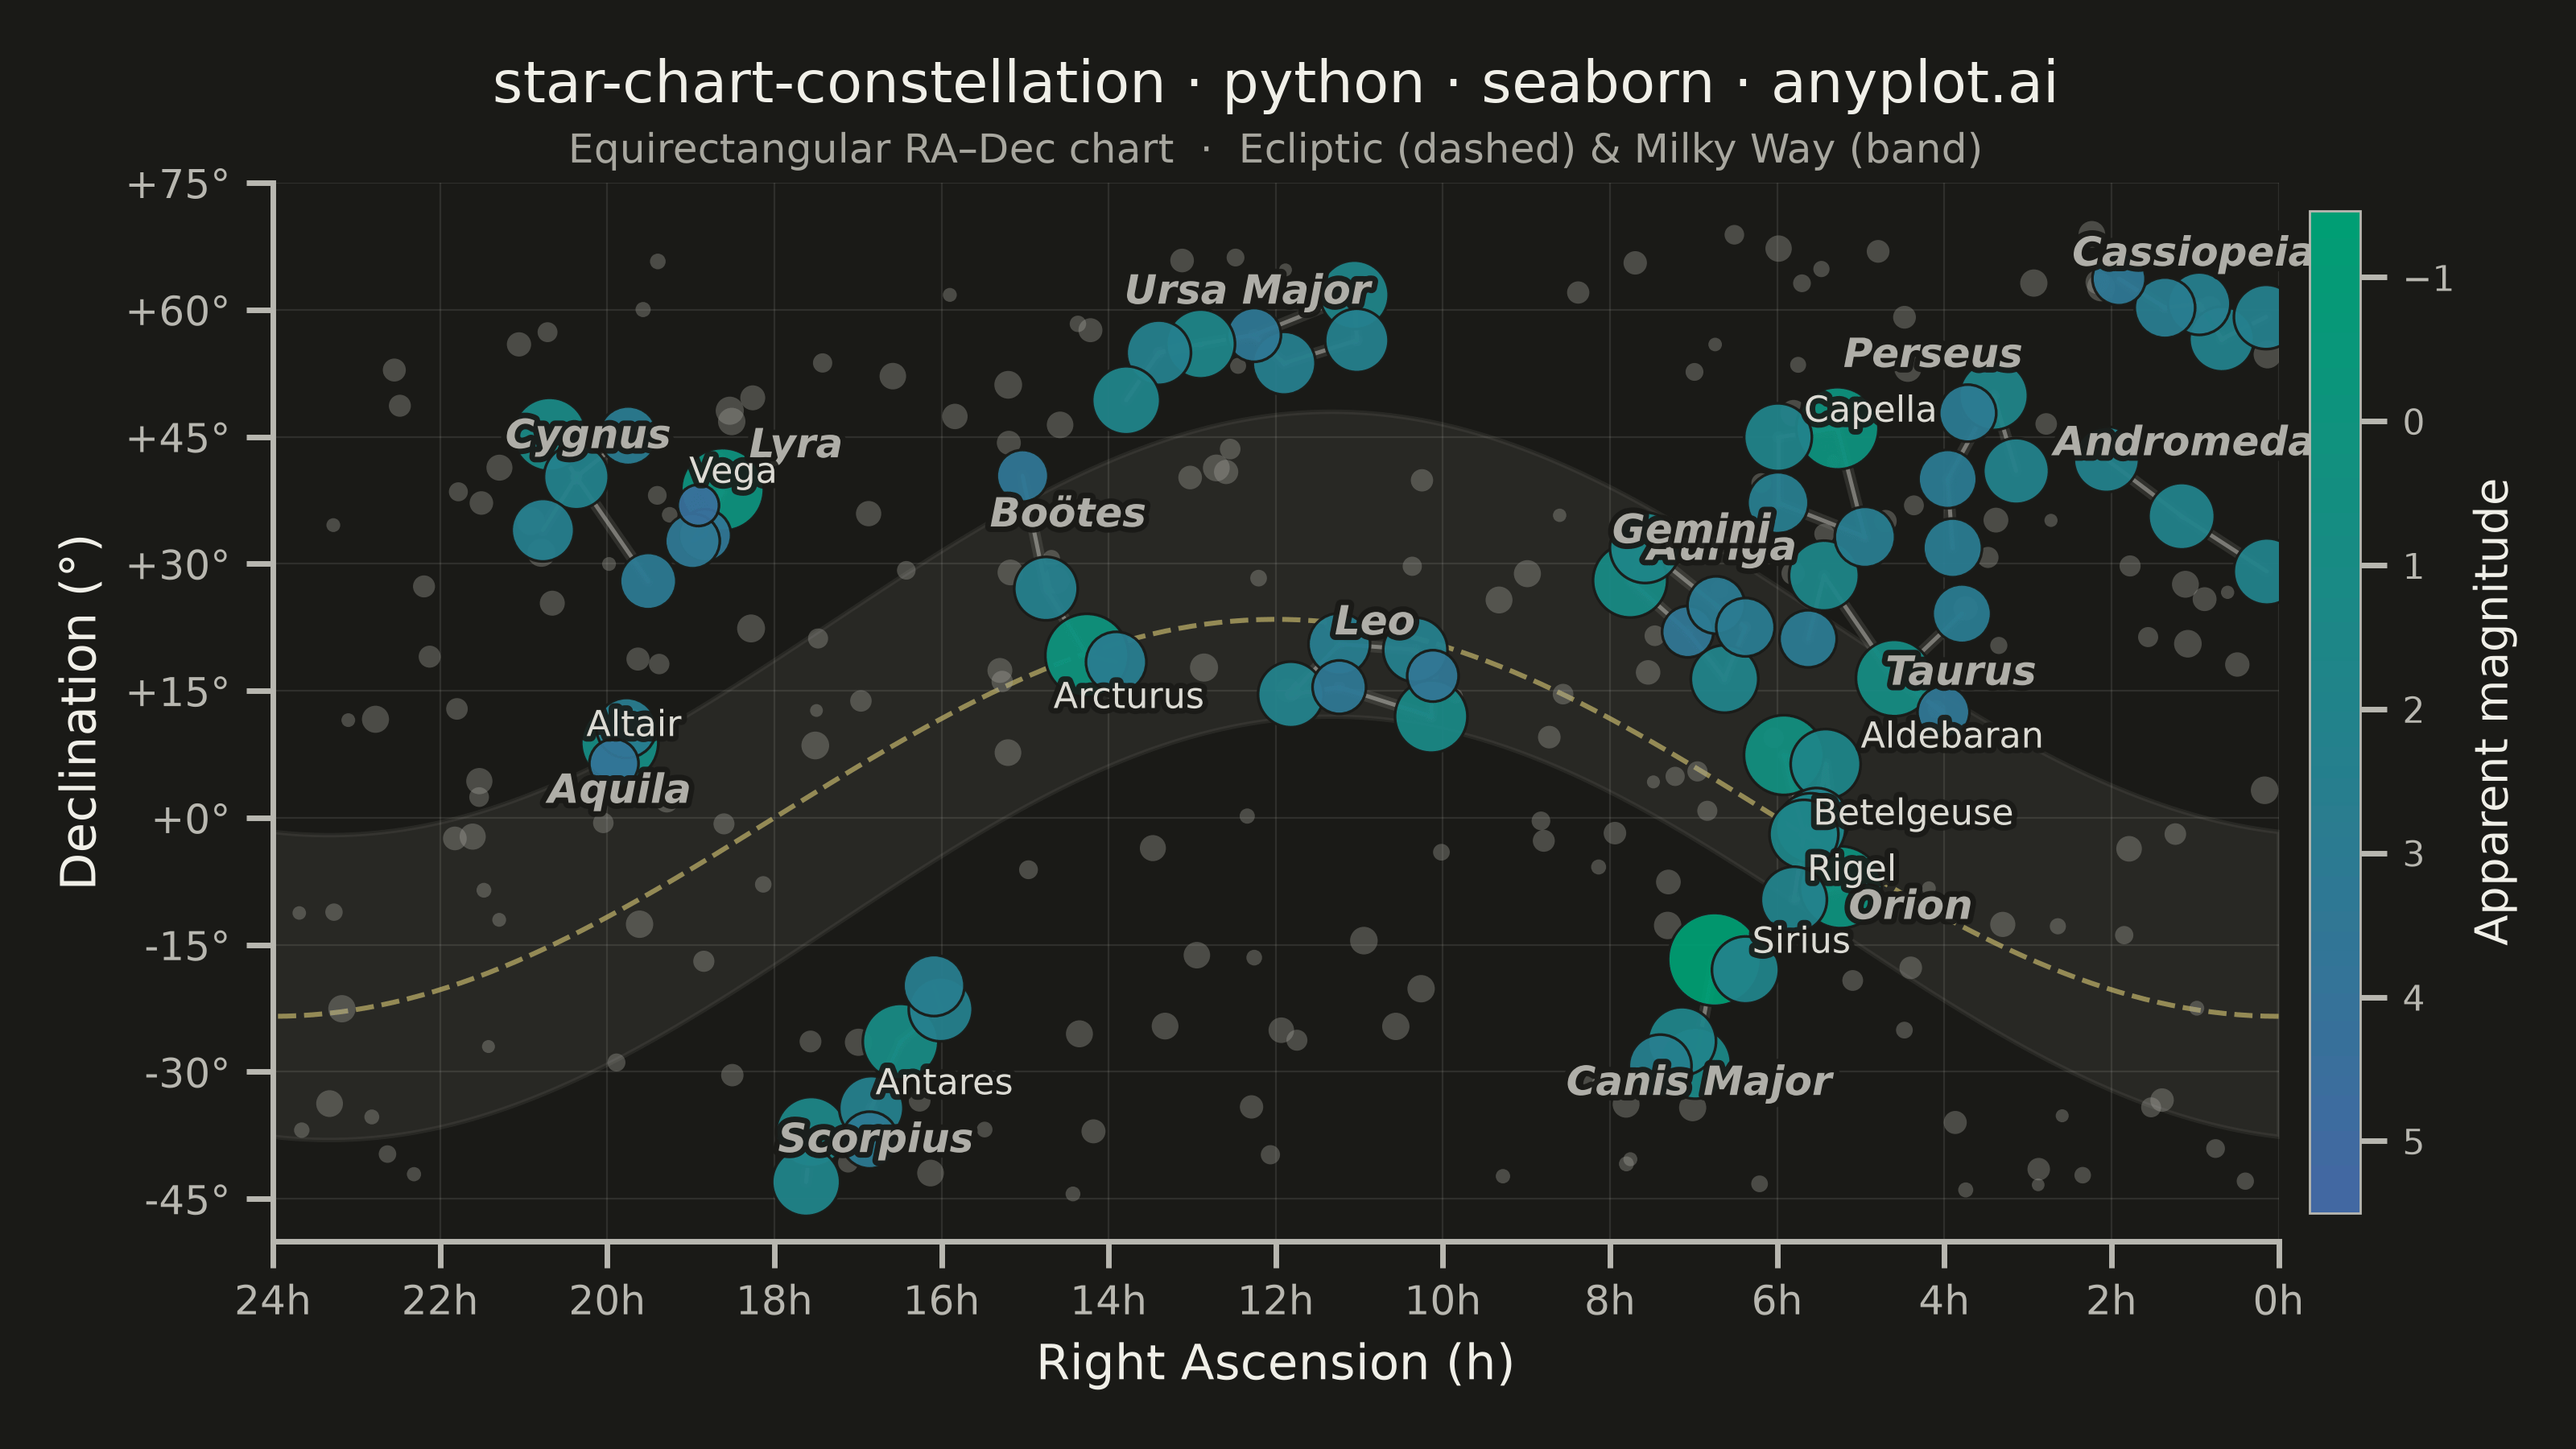
A celestial map that plots stars on a sky projection (stereographic or azimuthal equidistant) with constellation stick-figure lines connecting notable stars. Star apparent magnitudes are represented by point size (brighter stars appear larger), and a coordinate grid overlays the chart for orientation. The dark background mimics a night sky, making this an intuitive tool for identifying constellations and planning observations.
""" anyplot.ai
star-chart-constellation: Star Chart with Constellations
Library: seaborn 0.13.2 | Python 3.13.13
Quality: 90/100 | Updated: 2026-06-17
"""

import os

import matplotlib.patheffects as pe
import matplotlib.pyplot as plt
import numpy as np
import pandas as pd
import seaborn as sns
from matplotlib.cm import ScalarMappable
from matplotlib.colors import LinearSegmentedColormap, Normalize


# Theme tokens (see prompts/default-style-guide.md "Theme-adaptive Chrome")
THEME = os.getenv("ANYPLOT_THEME", "light")
PAGE_BG = "#FAF8F1" if THEME == "light" else "#1A1A17"
ELEVATED_BG = "#FFFDF6" if THEME == "light" else "#242420"
INK = "#1A1A17" if THEME == "light" else "#F0EFE8"
INK_SOFT = "#4A4A44" if THEME == "light" else "#B8B7B0"
INK_MUTED = "#6B6A63" if THEME == "light" else "#A8A79F"
ANYPLOT_AMBER = "#DDCC77"  # warning/caution anchor — reused here for the Sun's ecliptic path

# Imprint sequential cmap (single-polarity continuous: brand green -> blue) for magnitude
imprint_seq = LinearSegmentedColormap.from_list("imprint_seq", ["#009E73", "#4467A3"])

# Data - Major stars with RA (hours), Dec (degrees), apparent magnitude, IAU constellation
np.random.seed(42)

stars = {
    # Orion
    "Betelgeuse": (5.92, 7.41, 0.42, "Ori"),
    "Rigel": (5.24, -8.20, 0.13, "Ori"),
    "Bellatrix": (5.42, 6.35, 1.64, "Ori"),
    "Mintaka": (5.53, -0.30, 2.23, "Ori"),
    "Alnilam": (5.60, -1.20, 1.69, "Ori"),
    "Alnitak": (5.68, -1.94, 1.77, "Ori"),
    "Saiph": (5.80, -9.67, 2.09, "Ori"),
    # Ursa Major (Big Dipper)
    "Dubhe": (11.06, 61.75, 1.79, "UMa"),
    "Merak": (11.03, 56.38, 2.37, "UMa"),
    "Phecda": (11.90, 53.69, 2.44, "UMa"),
    "Megrez": (12.26, 57.03, 3.31, "UMa"),
    "Alioth": (12.90, 55.96, 1.77, "UMa"),
    "Mizar": (13.40, 54.93, 2.27, "UMa"),
    "Alkaid": (13.79, 49.31, 1.86, "UMa"),
    # Cassiopeia
    "Schedar": (0.68, 56.54, 2.23, "Cas"),
    "Caph": (0.15, 59.15, 2.27, "Cas"),
    "Gamma Cas": (0.95, 60.72, 2.47, "Cas"),
    "Ruchbah": (1.36, 60.24, 2.68, "Cas"),
    "Segin": (1.91, 63.67, 3.37, "Cas"),
    # Leo
    "Regulus": (10.14, 11.97, 1.35, "Leo"),
    "Denebola": (11.82, 14.57, 2.14, "Leo"),
    "Algieba": (10.33, 19.84, 2.28, "Leo"),
    "Zosma": (11.24, 20.52, 2.56, "Leo"),
    "Chertan": (11.24, 15.43, 3.34, "Leo"),
    "Eta Leo": (10.12, 16.76, 3.52, "Leo"),
    # Cygnus
    "Deneb": (20.69, 45.28, 1.25, "Cyg"),
    "Sadr": (20.37, 40.26, 2.23, "Cyg"),
    "Gienah Cyg": (20.77, 33.97, 2.46, "Cyg"),
    "Delta Cyg": (19.75, 45.13, 2.87, "Cyg"),
    "Albireo": (19.51, 27.96, 3.08, "Cyg"),
    # Gemini
    "Pollux": (7.76, 28.03, 1.14, "Gem"),
    "Castor": (7.58, 31.89, 1.58, "Gem"),
    "Alhena": (6.63, 16.40, 1.93, "Gem"),
    "Wasat": (7.07, 21.98, 3.53, "Gem"),
    "Mebsuta": (6.73, 25.13, 2.98, "Gem"),
    "Tejat": (6.38, 22.51, 2.88, "Gem"),
    # Taurus
    "Aldebaran": (4.60, 16.51, 0.85, "Tau"),
    "Elnath": (5.44, 28.61, 1.65, "Tau"),
    "Alcyone": (3.79, 24.11, 2.87, "Tau"),
    "Tianguan": (5.63, 21.14, 3.00, "Tau"),
    "Lambda Tau": (4.01, 12.49, 3.47, "Tau"),
    # Lyra
    "Vega": (18.62, 38.78, 0.03, "Lyr"),
    "Sheliak": (18.83, 33.36, 3.45, "Lyr"),
    "Sulafat": (18.98, 32.69, 3.24, "Lyr"),
    "Delta2 Lyr": (18.91, 36.90, 4.30, "Lyr"),
    # Aquila
    "Altair": (19.85, 8.87, 0.77, "Aql"),
    "Tarazed": (19.77, 10.61, 2.72, "Aql"),
    "Alshain": (19.92, 6.41, 3.71, "Aql"),
    # Scorpius
    "Antares": (16.49, -26.43, 0.96, "Sco"),
    "Shaula": (17.56, -37.10, 1.63, "Sco"),
    "Sargas": (17.62, -43.00, 1.87, "Sco"),
    "Dschubba": (16.01, -22.62, 2.32, "Sco"),
    "Graffias": (16.09, -19.81, 2.62, "Sco"),
    "Epsilon Sco": (16.84, -34.29, 2.29, "Sco"),
    "Mu1 Sco": (16.86, -38.05, 3.04, "Sco"),
    # Bootes
    "Arcturus": (14.26, 19.18, -0.05, "Boo"),
    "Izar": (14.75, 27.07, 2.37, "Boo"),
    "Muphrid": (13.91, 18.40, 2.68, "Boo"),
    "Nekkar": (15.03, 40.39, 3.50, "Boo"),
    # Perseus
    "Mirfak": (3.41, 49.86, 1.79, "Per"),
    "Algol": (3.14, 40.96, 2.12, "Per"),
    "Zeta Per": (3.90, 31.88, 2.85, "Per"),
    "Epsilon Per": (3.96, 40.01, 2.89, "Per"),
    "Delta Per": (3.72, 47.79, 3.01, "Per"),
    # Auriga
    "Capella": (5.28, 46.00, 0.08, "Aur"),
    "Menkalinan": (5.99, 44.95, 1.90, "Aur"),
    "Theta Aur": (5.99, 37.21, 2.62, "Aur"),
    "Iota Aur": (4.95, 33.17, 2.69, "Aur"),
    # Canis Major
    "Sirius": (6.75, -16.72, -1.46, "CMa"),
    "Adhara": (6.98, -28.97, 1.50, "CMa"),
    "Wezen": (7.14, -26.39, 1.84, "CMa"),
    "Mirzam": (6.38, -17.96, 1.98, "CMa"),
    "Aludra": (7.40, -29.30, 2.45, "CMa"),
    # Andromeda
    "Alpheratz": (0.14, 29.09, 2.06, "And"),
    "Mirach": (1.16, 35.62, 2.05, "And"),
    "Almach": (2.06, 42.33, 2.17, "And"),
}

star_names = list(stars.keys())
df = pd.DataFrame(
    {
        "name": star_names,
        "ra": [stars[s][0] for s in star_names],
        "dec": [stars[s][1] for s in star_names],
        "mag": [stars[s][2] for s in star_names],
        "constellation": [stars[s][3] for s in star_names],
    }
)

# Add ~200 fainter background stars (mag <= 5.5 keeps the chart uncluttered)
n_bg = 200
bg_df = pd.DataFrame(
    {
        "name": [f"BG{i}" for i in range(n_bg)],
        "ra": np.random.uniform(0, 24, n_bg),
        "dec": np.random.uniform(-45, 70, n_bg),
        "mag": np.random.uniform(3.5, 5.5, n_bg),
        "constellation": "---",
    }
)
df = pd.concat([df, bg_df], ignore_index=True)

# Constellation stick-figure edges (pairs of star names)
edges = [
    ("Betelgeuse", "Bellatrix"),
    ("Bellatrix", "Mintaka"),
    ("Mintaka", "Alnilam"),
    ("Alnilam", "Alnitak"),
    ("Betelgeuse", "Alnitak"),
    ("Bellatrix", "Rigel"),
    ("Alnitak", "Saiph"),
    ("Saiph", "Rigel"),
    ("Dubhe", "Merak"),
    ("Merak", "Phecda"),
    ("Phecda", "Megrez"),
    ("Megrez", "Alioth"),
    ("Alioth", "Mizar"),
    ("Mizar", "Alkaid"),
    ("Megrez", "Dubhe"),
    ("Caph", "Schedar"),
    ("Schedar", "Gamma Cas"),
    ("Gamma Cas", "Ruchbah"),
    ("Ruchbah", "Segin"),
    ("Regulus", "Eta Leo"),
    ("Eta Leo", "Algieba"),
    ("Algieba", "Zosma"),
    ("Zosma", "Denebola"),
    ("Regulus", "Chertan"),
    ("Chertan", "Denebola"),
    ("Deneb", "Sadr"),
    ("Sadr", "Gienah Cyg"),
    ("Sadr", "Delta Cyg"),
    ("Sadr", "Albireo"),
    ("Castor", "Pollux"),
    ("Castor", "Mebsuta"),
    ("Mebsuta", "Tejat"),
    ("Pollux", "Wasat"),
    ("Wasat", "Alhena"),
    ("Tejat", "Alhena"),
    ("Aldebaran", "Lambda Tau"),
    ("Aldebaran", "Elnath"),
    ("Aldebaran", "Alcyone"),
    ("Elnath", "Tianguan"),
    ("Vega", "Sheliak"),
    ("Vega", "Sulafat"),
    ("Sheliak", "Sulafat"),
    ("Vega", "Delta2 Lyr"),
    ("Altair", "Tarazed"),
    ("Altair", "Alshain"),
    ("Graffias", "Dschubba"),
    ("Dschubba", "Antares"),
    ("Antares", "Epsilon Sco"),
    ("Epsilon Sco", "Mu1 Sco"),
    ("Mu1 Sco", "Shaula"),
    ("Shaula", "Sargas"),
    ("Arcturus", "Izar"),
    ("Arcturus", "Muphrid"),
    ("Izar", "Nekkar"),
    ("Mirfak", "Delta Per"),
    ("Mirfak", "Epsilon Per"),
    ("Epsilon Per", "Zeta Per"),
    ("Mirfak", "Algol"),
    ("Capella", "Menkalinan"),
    ("Menkalinan", "Theta Aur"),
    ("Theta Aur", "Iota Aur"),
    ("Iota Aur", "Capella"),
    ("Sirius", "Mirzam"),
    ("Sirius", "Adhara"),
    ("Adhara", "Wezen"),
    ("Wezen", "Aludra"),
    ("Alpheratz", "Mirach"),
    ("Mirach", "Almach"),
]

# Invert magnitude for sizing: brighter stars (lower mag) -> larger markers.
# Named stars use the full size range; faint background stars stay small and subtle.
named_mask = df["constellation"] != "---"
mag_min, mag_max = df["mag"].min(), df["mag"].max()
df["size"] = np.interp(df["mag"], [mag_min, mag_max], [430, 14])
df.loc[~named_mask, "size"] = np.interp(df.loc[~named_mask, "mag"], [3.5, 5.5], [40, 8])

# Star lookup for edges, in RA-hour / Dec-degree space
star_lookup = df[named_mask].set_index("name")[["ra", "dec"]].to_dict("index")

# Constellation label positions (centroid of each constellation's stars)
constellation_names = {
    "Ori": "Orion",
    "UMa": "Ursa Major",
    "Cas": "Cassiopeia",
    "Leo": "Leo",
    "Cyg": "Cygnus",
    "Gem": "Gemini",
    "Tau": "Taurus",
    "Lyr": "Lyra",
    "Aql": "Aquila",
    "Sco": "Scorpius",
    "Boo": "Boötes",
    "Per": "Perseus",
    "Aur": "Auriga",
    "CMa": "Canis Major",
    "And": "Andromeda",
}
centroids = df[named_mask].groupby("constellation")[["ra", "dec"]].mean()

# Plot - seaborn handles the theming and the magnitude-mapped star field
sns.set_theme(
    style="ticks",
    context="notebook",
    rc={
        "figure.facecolor": PAGE_BG,
        "axes.facecolor": PAGE_BG,
        "axes.edgecolor": INK_SOFT,
        "axes.labelcolor": INK,
        "text.color": INK,
        "xtick.color": INK_SOFT,
        "ytick.color": INK_SOFT,
        "font.family": "sans-serif",
    },
)

fig, ax = plt.subplots(figsize=(8, 4.5), dpi=400)

# Milky Way band as a faint filled region (approximate galactic plane)
mw_ra = np.linspace(0, 24, 200)
mw_center_dec = 25 * np.sin(np.radians(mw_ra * 15 - 80)) + 5
mw_width = 18
ax.fill_between(mw_ra, mw_center_dec - mw_width, mw_center_dec + mw_width, color=INK_MUTED, alpha=0.10, zorder=0)

# Ecliptic (the Sun's apparent path) as a dashed amber curve
ecl_ra = np.linspace(0, 24, 300)
ecl_dec = 23.44 * np.sin(np.radians(ecl_ra * 15 - 90))
ax.plot(ecl_ra, ecl_dec, color=ANYPLOT_AMBER, linewidth=1.1, linestyle="--", alpha=0.6, zorder=1)

# Subtle RA/Dec coordinate grid
for ra_line in range(0, 25, 2):
    ax.axvline(x=ra_line, color=INK, linewidth=0.4, alpha=0.10, zorder=0)
for dec_line in range(-45, 76, 15):
    ax.axhline(y=dec_line, color=INK, linewidth=0.4, alpha=0.10, zorder=0)

# Constellation stick-figure lines (thin, semi-transparent) with a soft glow
for s1, s2 in edges:
    if s1 in star_lookup and s2 in star_lookup:
        x1, y1 = star_lookup[s1]["ra"], star_lookup[s1]["dec"]
        x2, y2 = star_lookup[s2]["ra"], star_lookup[s2]["dec"]
        ax.plot([x1, x2], [y1, y2], color=INK_SOFT, linewidth=2.6, alpha=0.14, zorder=1)
        ax.plot([x1, x2], [y1, y2], color=INK_SOFT, linewidth=0.9, alpha=0.55, zorder=1)

# Background field stars via seaborn
sns.scatterplot(
    data=df[~named_mask],
    x="ra",
    y="dec",
    s=df.loc[~named_mask, "size"],
    color=INK_MUTED,
    alpha=0.35,
    edgecolor="none",
    legend=False,
    ax=ax,
    zorder=2,
)

# Named constellation stars via seaborn — colour encodes apparent magnitude (Imprint sequential)
sns.scatterplot(
    data=df[named_mask],
    x="ra",
    y="dec",
    hue="mag",
    palette=imprint_seq,
    hue_norm=(mag_min, mag_max),
    s=df.loc[named_mask, "size"],
    edgecolor=PAGE_BG,
    linewidth=0.6,
    alpha=0.95,
    legend=False,
    ax=ax,
    zorder=3,
)

# Magnitude colourbar (brighter stars sit at the top)
norm = Normalize(vmin=mag_min, vmax=mag_max)
sm = ScalarMappable(cmap=imprint_seq, norm=norm)
cbar = fig.colorbar(sm, ax=ax, fraction=0.024, pad=0.015)
cbar.set_label("Apparent magnitude", fontsize=10, color=INK)
cbar.ax.invert_yaxis()
cbar.ax.tick_params(labelsize=8, color=INK_SOFT, labelcolor=INK_SOFT)
cbar.outline.set_edgecolor(INK_SOFT)
cbar.outline.set_linewidth(0.5)

# Constellation name labels near each centroid
text_stroke = [pe.withStroke(linewidth=2.5, foreground=PAGE_BG)]
label_offsets = {
    "CMa": (0, -10),
    "Lyr": (-1.1, 6),
    "Aql": (0, -8),
    "Sco": (0, -9),
    "Aur": (1.1, -11),
    "Per": (0.5, 10),
    "Ori": (-1.2, -12),
    "Tau": (-0.9, -6),
    "Gem": (0, 7),
    "And": (0, 6),
    "Boo": (0, 7),
}
for abbr, row in centroids.iterrows():
    dx, dy = label_offsets.get(abbr, (0, 4))
    ax.text(
        row["ra"] + dx,
        row["dec"] + dy,
        constellation_names.get(abbr, abbr),
        fontsize=9,
        color=INK_SOFT,
        alpha=0.95,
        ha="center",
        va="bottom",
        fontweight="bold",
        fontstyle="italic",
        path_effects=text_stroke,
        zorder=4,
    )

# Label the brightest stars (mag < 1.0)
brightest = df[(df["mag"] < 1.0) & named_mask]
star_label_offsets = {
    "Sirius": (-0.45, 4),
    "Vega": (0.4, 4),
    "Capella": (0.4, 4),
    "Arcturus": (0.4, -3),
    "Altair": (0.4, 4),
    "Aldebaran": (0.4, -5),
    "Rigel": (0.4, 4),
    "Betelgeuse": (-0.35, -5),
}
for _, star in brightest.iterrows():
    dx, dy = star_label_offsets.get(star["name"], (0.3, -3))
    ax.text(
        star["ra"] + dx,
        star["dec"] + dy,
        star["name"],
        fontsize=8,
        color=INK,
        alpha=0.9,
        ha="left",
        va="top",
        fontweight="medium",
        path_effects=text_stroke,
        zorder=4,
    )

# Style — RA shown in hours (matches the hour-labelled ticks), Dec in degrees
ax.set_xlim(24, 0)
ax.set_ylim(-50, 72)
ax.set_xlabel("Right Ascension (h)", fontsize=11, color=INK)
ax.set_ylabel("Declination (°)", fontsize=11, color=INK)
ax.set_title(
    "star-chart-constellation · python · seaborn · anyplot.ai", fontsize=13, fontweight="medium", color=INK, pad=18
)
ax.text(
    0.5,
    1.01,
    "Equirectangular RA–Dec chart  ·  Ecliptic (dashed) & Milky Way (band)",
    transform=ax.transAxes,
    fontsize=9,
    color=INK_MUTED,
    ha="center",
    va="bottom",
)

ax.set_xticks(np.arange(0, 25, 2))
ax.set_xticklabels([f"{h}h" for h in range(0, 25, 2)])
ax.set_yticks(np.arange(-45, 76, 15))
ax.set_yticklabels([f"{d:+d}°" for d in range(-45, 76, 15)])
ax.tick_params(axis="both", labelsize=9)

sns.despine(ax=ax)

plt.tight_layout()
plt.savefig(f"plot-{THEME}.png", dpi=400, facecolor=PAGE_BG)
Runnable source as JSON, for any HTTP client: https://api.anyplot.ai/specs/star-chart-constellation/seaborn/code. Any spec id and library id listed in llms-full.txt fit the same URL shape; every URL below is complete and callable.
{
  "spec_id": "star-chart-constellation",
  "language": "python",
  "library": "seaborn",
  "page": "https://anyplot.ai/star-chart-constellation/python/seaborn",
  "hub": "https://anyplot.ai/star-chart-constellation",
  "code_json": "https://api.anyplot.ai/specs/star-chart-constellation/seaborn/code",
  "spec_json": "https://api.anyplot.ai/specs/star-chart-constellation",
  "render_light_png": "https://storage.googleapis.com/anyplot-images/plots/star-chart-constellation/python/seaborn/plot-light.png",
  "render_dark_png": "https://storage.googleapis.com/anyplot-images/plots/star-chart-constellation/python/seaborn/plot-dark.png",
  "quality_score": 90.0,
  "license": "MIT",
  "guide": "https://anyplot.ai/llms.txt"
}
Part of Star Chart with Constellations on anyplot.ai.