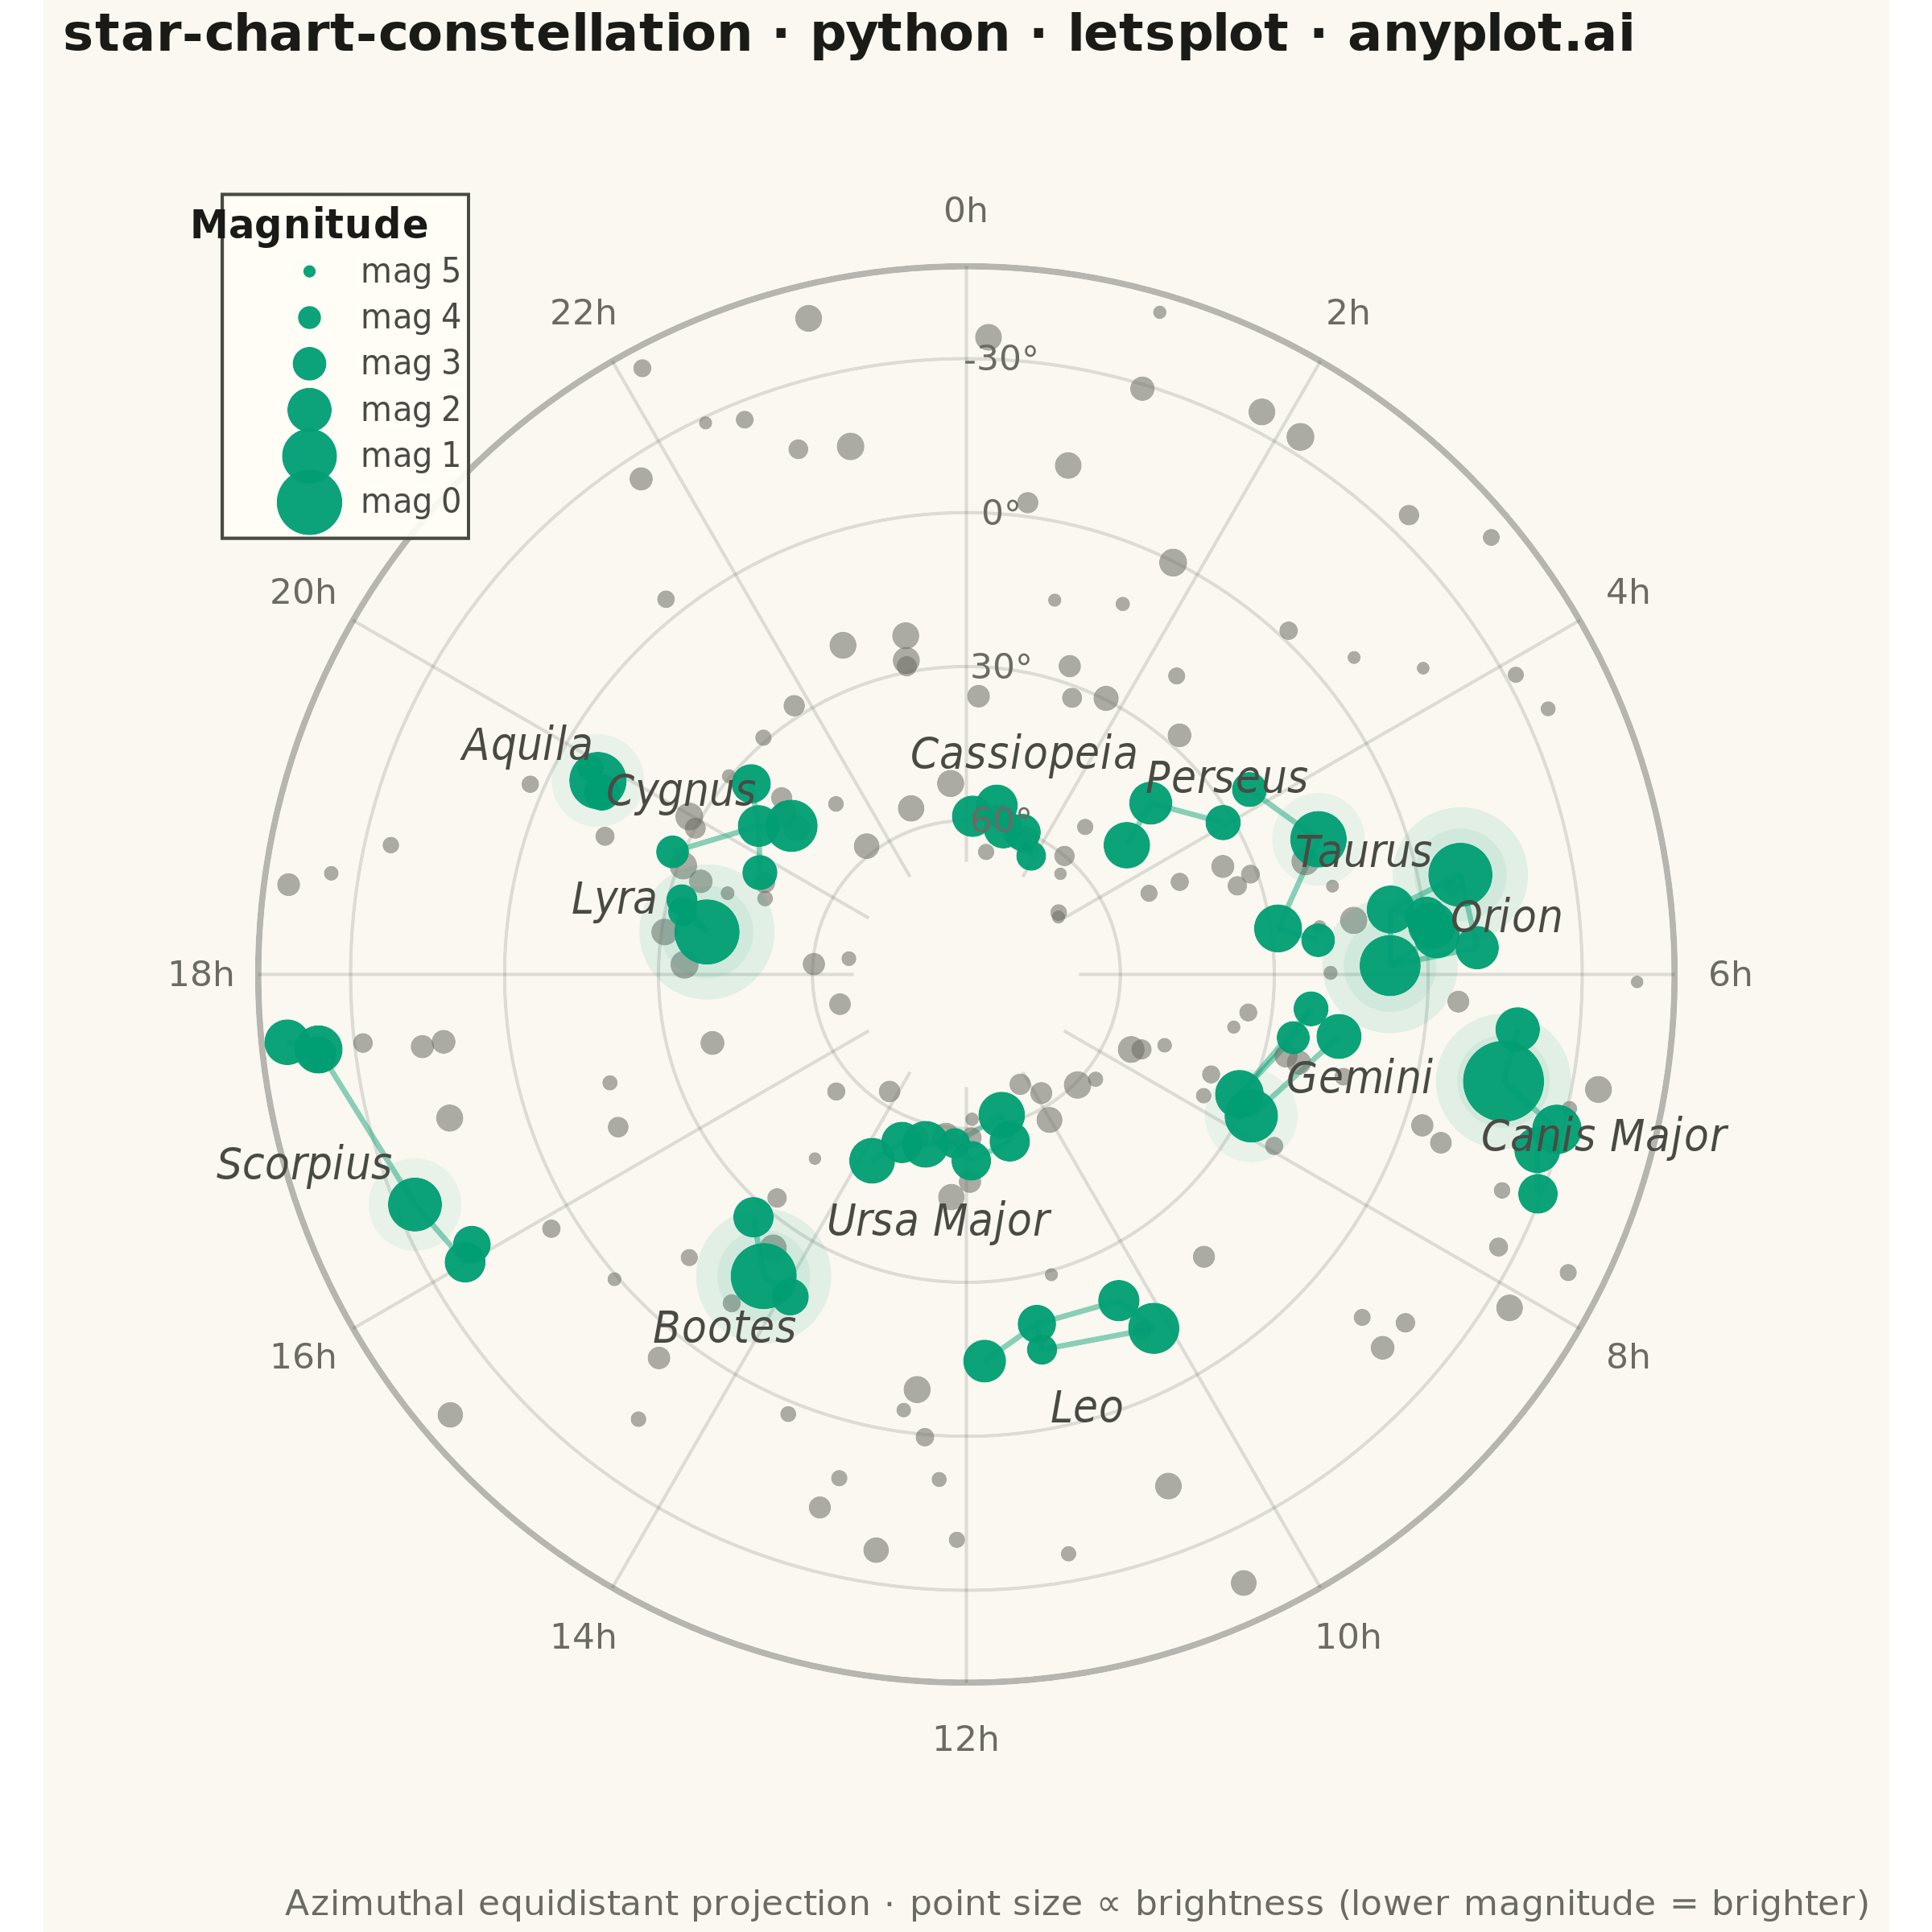
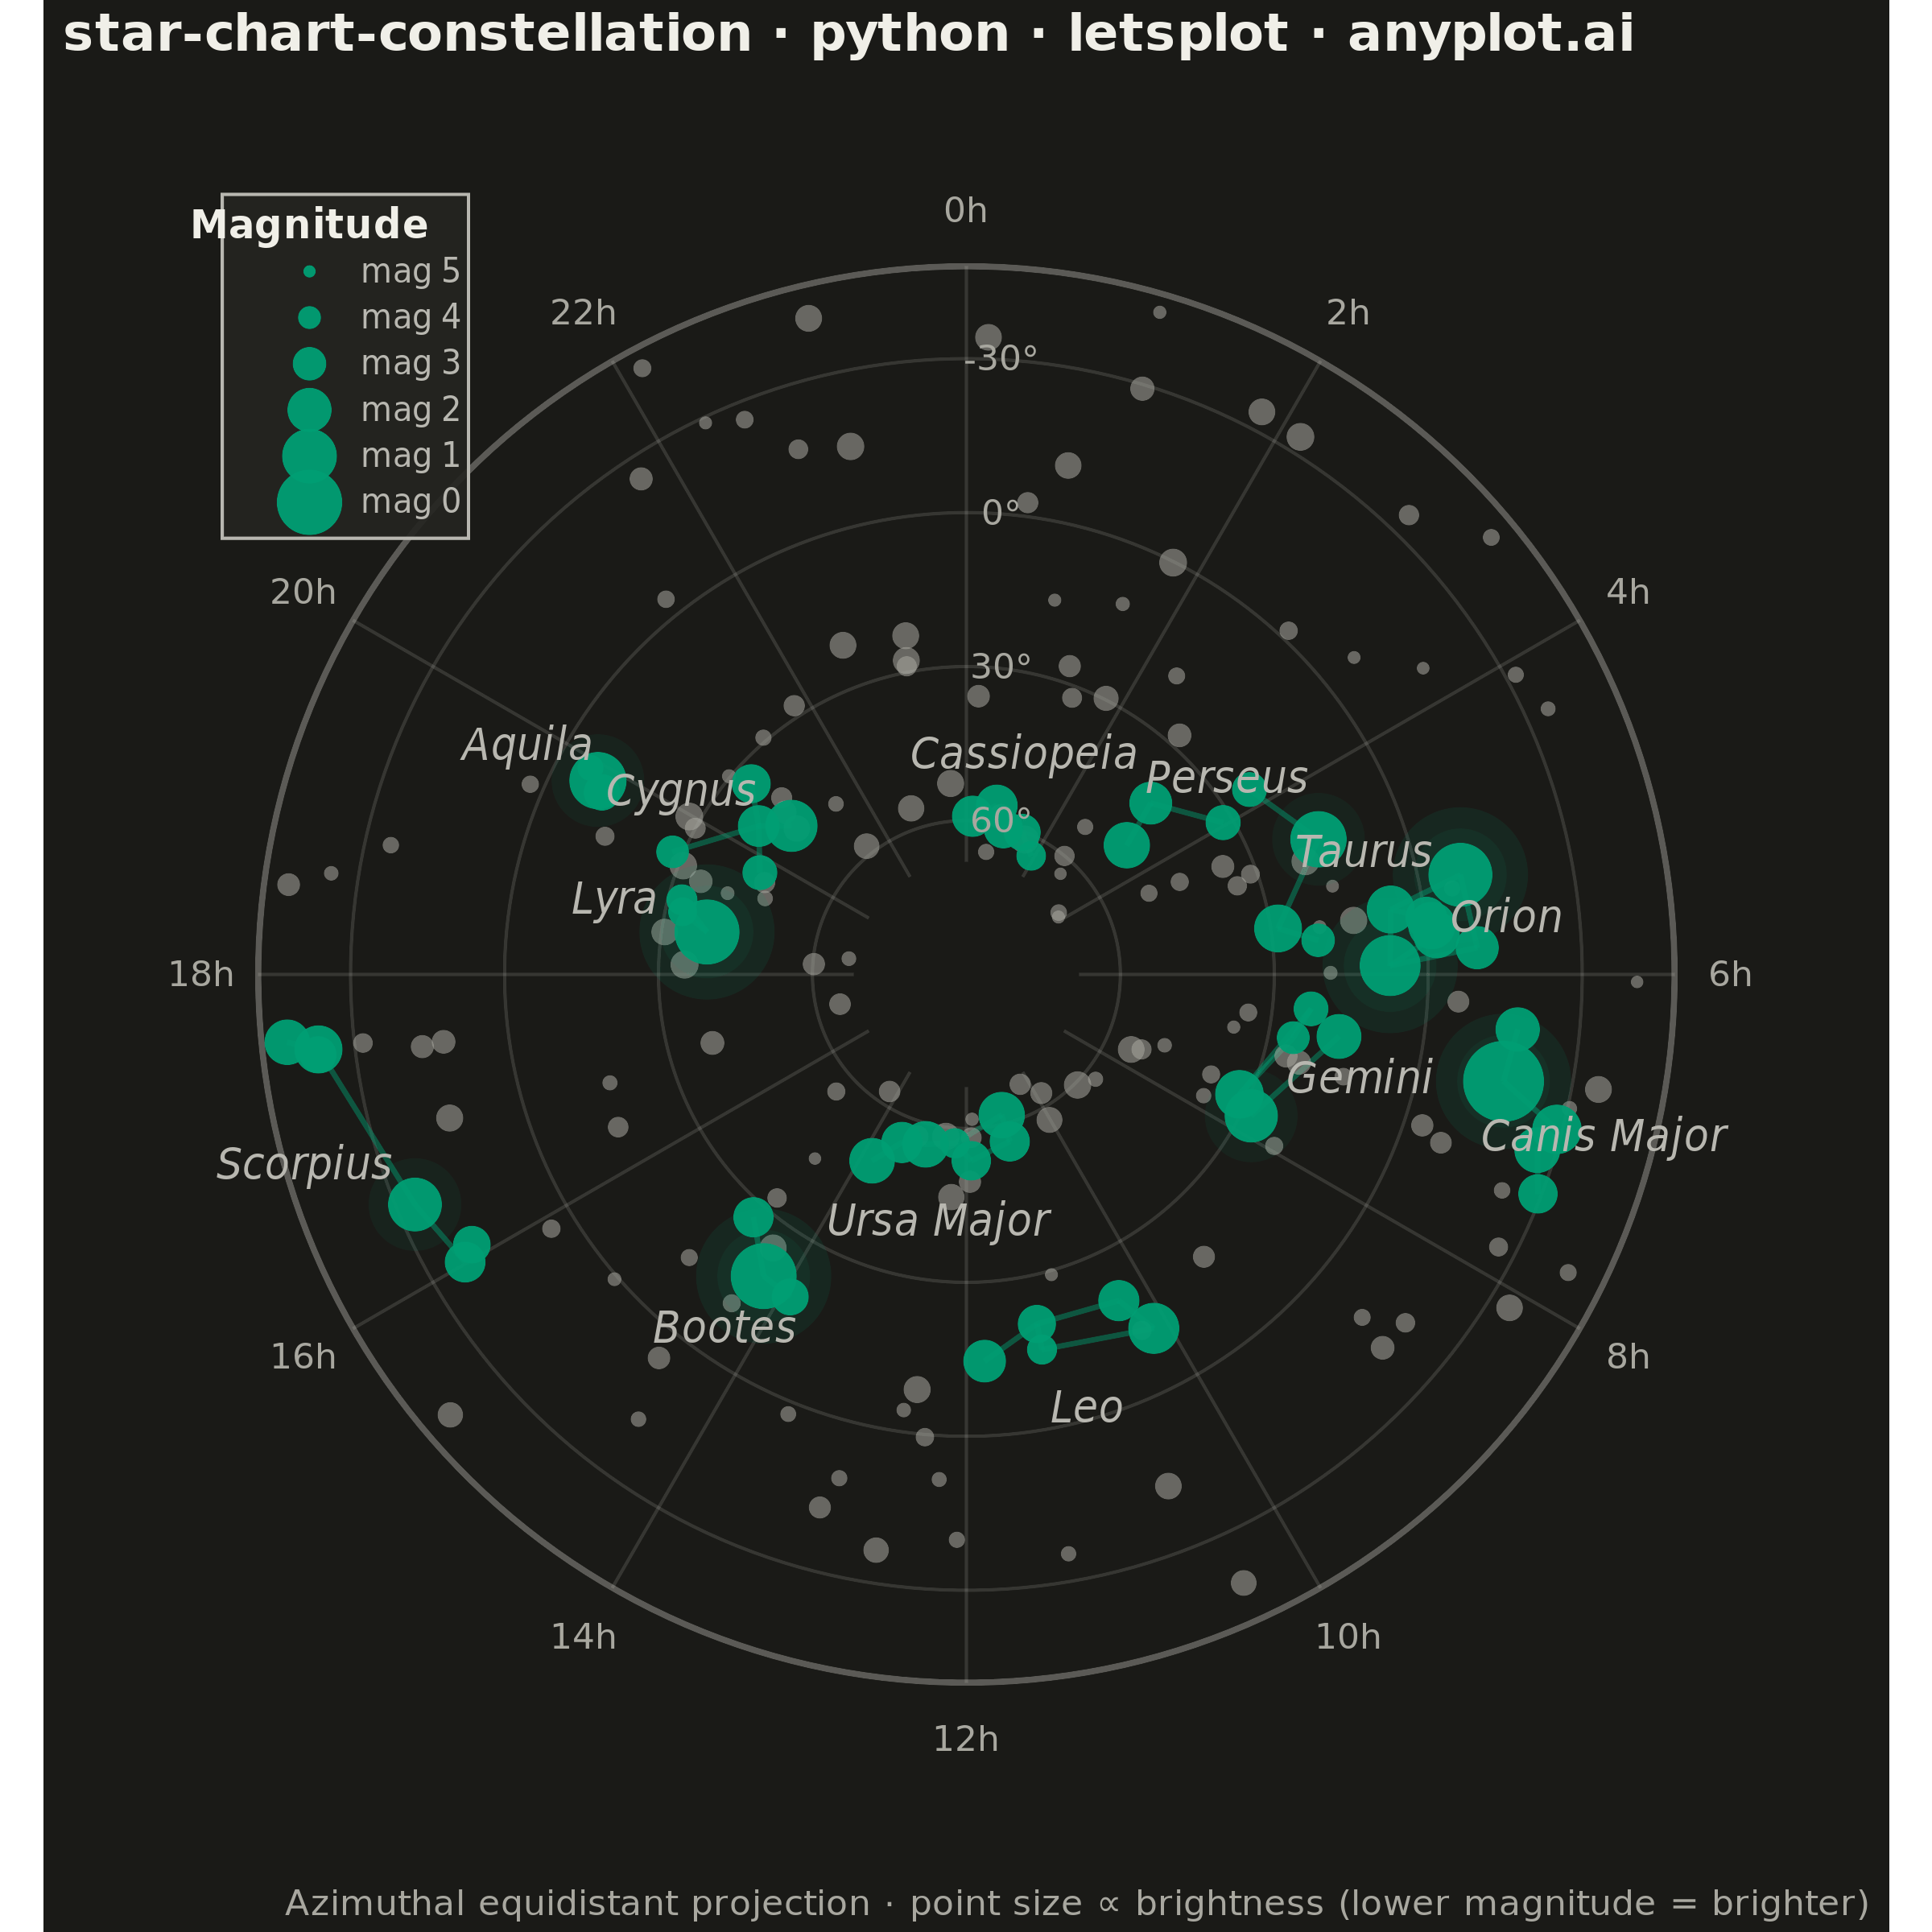
A celestial map that plots stars on a sky projection (stereographic or azimuthal equidistant) with constellation stick-figure lines connecting notable stars. Star apparent magnitudes are represented by point size (brighter stars appear larger), and a coordinate grid overlays the chart for orientation. The dark background mimics a night sky, making this an intuitive tool for identifying constellations and planning observations.
""" anyplot.ai
star-chart-constellation: Star Chart with Constellations
Library: letsplot 4.10.1 | Python 3.13.13
Quality: 92/100 | Updated: 2026-06-17
"""

import os

import numpy as np
import pandas as pd
from lets_plot import *


LetsPlot.setup_html()

# Theme tokens (see prompts/default-style-guide.md "Theme-adaptive Chrome")
THEME = os.getenv("ANYPLOT_THEME", "light")
PAGE_BG = "#FAF8F1" if THEME == "light" else "#1A1A17"
ELEVATED_BG = "#FFFDF6" if THEME == "light" else "#242420"
INK = "#1A1A17" if THEME == "light" else "#F0EFE8"
INK_SOFT = "#4A4A44" if THEME == "light" else "#B8B7B0"
INK_MUTED = "#6B6A63" if THEME == "light" else "#A8A79F"
GRID = INK  # used with low alpha for the RA/Dec coordinate grid

# Imprint palette position 1 — brand green, the single primary star series.
# A constant green reads on both the cream and near-black surfaces, unlike the
# pale-yellow of a literal night sky which would vanish on the light theme.
BRAND = "#009E73"

# Data — notable stars with real approximate coordinates (RA in hours, Dec in degrees)
np.random.seed(42)

stars_data = [
    # Orion
    ("Betelgeuse", 5.92, 7.41, 0.42, "Ori"),
    ("Rigel", 5.24, -8.20, 0.13, "Ori"),
    ("Bellatrix", 5.42, 6.35, 1.64, "Ori"),
    ("Mintaka", 5.53, -0.30, 2.23, "Ori"),
    ("Alnilam", 5.60, -1.20, 1.69, "Ori"),
    ("Alnitak", 5.68, -1.94, 1.77, "Ori"),
    ("Saiph", 5.80, -9.67, 2.09, "Ori"),
    # Ursa Major (Big Dipper)
    ("Dubhe", 11.06, 61.75, 1.79, "UMa"),
    ("Merak", 11.03, 56.38, 2.37, "UMa"),
    ("Phecda", 11.90, 53.69, 2.44, "UMa"),
    ("Megrez", 12.26, 57.03, 3.31, "UMa"),
    ("Alioth", 12.90, 55.96, 1.77, "UMa"),
    ("Mizar", 13.40, 54.93, 2.27, "UMa"),
    ("Alkaid", 13.79, 49.31, 1.86, "UMa"),
    # Cassiopeia
    ("Schedar", 0.68, 56.54, 2.23, "Cas"),
    ("Caph", 0.15, 59.15, 2.27, "Cas"),
    ("Gamma Cas", 0.95, 60.72, 2.47, "Cas"),
    ("Ruchbah", 1.43, 60.24, 2.68, "Cas"),
    ("Segin", 1.91, 63.67, 3.37, "Cas"),
    # Leo
    ("Regulus", 10.14, 11.97, 1.35, "Leo"),
    ("Denebola", 11.82, 14.57, 2.14, "Leo"),
    ("Algieba", 10.33, 19.84, 2.28, "Leo"),
    ("Zosma", 11.24, 20.52, 2.56, "Leo"),
    ("Chertan", 11.24, 15.43, 3.33, "Leo"),
    # Cygnus
    ("Deneb", 20.69, 45.28, 1.25, "Cyg"),
    ("Sadr", 20.37, 40.26, 2.23, "Cyg"),
    ("Gienah Cyg", 20.77, 33.97, 2.48, "Cyg"),
    ("Albireo", 19.51, 27.96, 3.08, "Cyg"),
    ("Fawaris", 19.75, 45.13, 2.87, "Cyg"),
    # Scorpius
    ("Antares", 16.49, -26.43, 1.09, "Sco"),
    ("Shaula", 17.56, -37.10, 1.63, "Sco"),
    ("Sargas", 17.62, -42.99, 1.87, "Sco"),
    ("Dschubba", 16.01, -22.62, 2.32, "Sco"),
    ("Graffias", 16.09, -19.81, 2.62, "Sco"),
    ("Lesath", 17.53, -37.29, 2.69, "Sco"),
    # Gemini
    ("Pollux", 7.76, 28.03, 1.14, "Gem"),
    ("Castor", 7.58, 31.89, 1.58, "Gem"),
    ("Alhena", 6.63, 16.40, 1.93, "Gem"),
    ("Tejat", 6.38, 22.51, 2.88, "Gem"),
    ("Mebsuta", 6.73, 25.13, 3.06, "Gem"),
    # Lyra
    ("Vega", 18.62, 38.78, 0.03, "Lyr"),
    ("Sheliak", 18.83, 33.36, 3.45, "Lyr"),
    ("Sulafat", 18.98, 32.69, 3.24, "Lyr"),
    # Aquila
    ("Altair", 19.85, 8.87, 0.77, "Aql"),
    ("Tarazed", 19.77, 10.61, 2.72, "Aql"),
    ("Alshain", 19.92, 6.41, 3.71, "Aql"),
    # Canis Major
    ("Sirius", 6.75, -16.72, -1.46, "CMa"),
    ("Adhara", 6.98, -28.97, 1.50, "CMa"),
    ("Wezen", 7.14, -26.39, 1.84, "CMa"),
    ("Mirzam", 6.38, -17.96, 1.98, "CMa"),
    ("Aludra", 7.40, -29.30, 2.45, "CMa"),
    # Taurus
    ("Aldebaran", 4.60, 16.51, 0.85, "Tau"),
    ("Elnath", 5.44, 28.61, 1.65, "Tau"),
    ("Alcyone", 3.79, 24.11, 2.87, "Tau"),
    ("Tianguan", 5.63, 21.14, 3.00, "Tau"),
    # Bootes
    ("Arcturus", 14.26, 19.18, -0.05, "Boo"),
    ("Izar", 14.75, 27.07, 2.37, "Boo"),
    ("Muphrid", 13.91, 18.40, 2.68, "Boo"),
    # Perseus
    ("Mirfak", 3.41, 49.86, 1.79, "Per"),
    ("Algol", 3.14, 40.96, 2.12, "Per"),
    ("Atik", 3.96, 31.88, 2.85, "Per"),
]

# Fainter background stars to fill out the sky (mag <= 5.0 threshold per spec)
n_bg = 150
bg_ra = np.random.uniform(0, 24, n_bg)
bg_dec = np.random.uniform(-45, 70, n_bg)
bg_mag = np.random.uniform(3.5, 5.0, n_bg)

star_id = [s[0] for s in stars_data] + [f"BG{i}" for i in range(n_bg)]
ra_hours = np.array([s[1] for s in stars_data] + list(bg_ra))
dec = np.array([s[2] for s in stars_data] + list(bg_dec))
magnitude = np.array([s[3] for s in stars_data] + list(bg_mag))
constellation = [s[4] for s in stars_data] + ["" for _ in range(n_bg)]

# Azimuthal equidistant projection centred on the North Celestial Pole:
# angular distance from the pole becomes the radius, RA becomes the bearing.
# RA meridians map to straight radials, Dec parallels to concentric circles —
# the natural circular sky boundary the spec asks for.
rho = 90.0 - dec
phi = np.radians(ra_hours * 15.0)
x = rho * np.sin(phi)
y = rho * np.cos(phi)

# Invert magnitude for point sizing: brighter (lower magnitude) = larger
max_mag = 5.5
size = (max_mag - magnitude + 0.6) * 1.5

df = pd.DataFrame(
    {
        "star_id": star_id,
        "x": x,
        "y": y,
        "ra_h": ra_hours,
        "dec": dec,
        "magnitude": magnitude,
        "constellation": constellation,
        "size": size,
    }
)

named = df[df["constellation"] != ""]
background = df[df["constellation"] == ""]
bright_1 = named[named["magnitude"] < 0.6]
bright_2 = named[named["magnitude"] < 1.2]

# Constellation stick-figure edges (pairs of star names)
edges = [
    ("Betelgeuse", "Bellatrix"),
    ("Bellatrix", "Mintaka"),
    ("Mintaka", "Alnilam"),
    ("Alnilam", "Alnitak"),
    ("Betelgeuse", "Alnitak"),
    ("Bellatrix", "Rigel"),
    ("Betelgeuse", "Saiph"),
    ("Rigel", "Saiph"),
    ("Dubhe", "Merak"),
    ("Merak", "Phecda"),
    ("Phecda", "Megrez"),
    ("Megrez", "Alioth"),
    ("Alioth", "Mizar"),
    ("Mizar", "Alkaid"),
    ("Megrez", "Dubhe"),
    ("Caph", "Schedar"),
    ("Schedar", "Gamma Cas"),
    ("Gamma Cas", "Ruchbah"),
    ("Ruchbah", "Segin"),
    ("Regulus", "Chertan"),
    ("Chertan", "Zosma"),
    ("Zosma", "Denebola"),
    ("Regulus", "Algieba"),
    ("Algieba", "Zosma"),
    ("Deneb", "Sadr"),
    ("Sadr", "Albireo"),
    ("Sadr", "Gienah Cyg"),
    ("Sadr", "Fawaris"),
    ("Graffias", "Dschubba"),
    ("Dschubba", "Antares"),
    ("Antares", "Shaula"),
    ("Shaula", "Lesath"),
    ("Shaula", "Sargas"),
    ("Castor", "Pollux"),
    ("Castor", "Tejat"),
    ("Pollux", "Alhena"),
    ("Tejat", "Mebsuta"),
    ("Mebsuta", "Castor"),
    ("Vega", "Sheliak"),
    ("Sheliak", "Sulafat"),
    ("Sulafat", "Vega"),
    ("Altair", "Tarazed"),
    ("Altair", "Alshain"),
    ("Sirius", "Mirzam"),
    ("Sirius", "Adhara"),
    ("Adhara", "Wezen"),
    ("Wezen", "Aludra"),
    ("Aldebaran", "Elnath"),
    ("Aldebaran", "Alcyone"),
    ("Elnath", "Tianguan"),
    ("Arcturus", "Izar"),
    ("Arcturus", "Muphrid"),
    ("Mirfak", "Algol"),
    ("Algol", "Atik"),
]

pos = {row.star_id: (row.x, row.y) for row in df.itertuples()}
df_edges = pd.DataFrame(
    [{"x": pos[a][0], "y": pos[a][1], "xend": pos[b][0], "yend": pos[b][1]} for a, b in edges if a in pos and b in pos]
)

# RA/Dec coordinate grid — concentric Dec circles + radial RA meridians
angle = np.linspace(0, 2 * np.pi, 240)
circle_rows = []
for dec_ring in (60, 30, 0, -30):
    r = 90.0 - dec_ring
    for a in angle:
        circle_rows.append({"x": r * np.sin(a), "y": r * np.cos(a), "ring": f"d{dec_ring}"})
df_circles = pd.DataFrame(circle_rows)

r_bound = 138.0
df_boundary = pd.DataFrame({"x": r_bound * np.sin(angle), "y": r_bound * np.cos(angle)})

merid_rows = []
for h in range(0, 24, 2):
    p = np.radians(h * 15.0)
    merid_rows.append(
        {"x": 22 * np.sin(p), "y": 22 * np.cos(p), "xend": r_bound * np.sin(p), "yend": r_bound * np.cos(p)}
    )
df_merid = pd.DataFrame(merid_rows)

# Grid tick labels: Dec rings along the RA=0 meridian, RA hours around the rim
df_declab = pd.DataFrame(
    {"x": [7] * 4, "y": [90.0 - d for d in (60, 30, 0, -30)], "label": [f"{d}°" for d in (60, 30, 0, -30)]}
)
ra_label_rows = []
for h in range(0, 24, 2):
    p = np.radians(h * 15.0)
    ra_label_rows.append({"x": 149 * np.sin(p), "y": 149 * np.cos(p), "label": f"{h}h"})
df_ralab = pd.DataFrame(ra_label_rows)

# Constellation labels — projected centroid pushed radially outward to clear stars
centroids = named.groupby("constellation")[["x", "y"]].mean().reset_index()
norm = np.hypot(centroids["x"], centroids["y"]).replace(0, 1)
centroids["x"] = centroids["x"] + centroids["x"] / norm * 15.0
centroids["y"] = centroids["y"] + centroids["y"] / norm * 15.0
const_full_names = {
    "Ori": "Orion",
    "UMa": "Ursa Major",
    "Cas": "Cassiopeia",
    "Leo": "Leo",
    "Cyg": "Cygnus",
    "Sco": "Scorpius",
    "Gem": "Gemini",
    "Lyr": "Lyra",
    "Aql": "Aquila",
    "CMa": "Canis Major",
    "Tau": "Taurus",
    "Boo": "Bootes",
    "Per": "Perseus",
}
centroids["name"] = centroids["constellation"].map(const_full_names)

# Magnitude legend — compact panel tucked into the empty top-left corner (outside the sky disc)
legend_mags = [0, 1, 2, 3, 4, 5]
legend_x = -128
df_legend = pd.DataFrame(
    {
        "x": [legend_x] * len(legend_mags),
        "y": [92 + i * 9 for i in range(len(legend_mags))],
        "size": [(max_mag - m + 0.6) * 1.5 for m in legend_mags],
        "label": [f"mag {m}" for m in legend_mags],
    }
)
df_legend_title = pd.DataFrame({"x": [legend_x], "y": [92 + len(legend_mags) * 9]})
df_legend_bg = pd.DataFrame({"xmin": [-145], "xmax": [-97], "ymin": [85], "ymax": [152]})

# Plot
plot = (
    ggplot()
    # Coordinate grid
    + geom_path(aes(x="x", y="y", group="ring"), data=df_circles, color=GRID, size=0.4, alpha=0.13)
    + geom_segment(aes(x="x", y="y", xend="xend", yend="yend"), data=df_merid, color=GRID, size=0.4, alpha=0.13)
    + geom_path(aes(x="x", y="y"), data=df_boundary, color=GRID, size=0.8, alpha=0.30)
    # Constellation stick-figure lines
    + geom_segment(aes(x="x", y="y", xend="xend", yend="yend"), data=df_edges, color=BRAND, size=0.7, alpha=0.45)
    # Faint background stars
    + geom_point(aes(x="x", y="y", size="size"), data=background, color=INK_MUTED, alpha=0.55, shape=16)
    # Glow halo beneath the brightest stars
    + geom_point(aes(x="x", y="y"), data=bright_2, color=BRAND, alpha=0.07, size=13, shape=16)
    + geom_point(aes(x="x", y="y"), data=bright_1, color=BRAND, alpha=0.10, size=19, shape=16)
    # Named constellation stars (with interactive tooltips — a lets-plot feature)
    + geom_point(
        aes(x="x", y="y", size="size"),
        data=named,
        color=BRAND,
        alpha=0.95,
        shape=16,
        tooltips=layer_tooltips()
        .title("@star_id")
        .line("Constellation|@constellation")
        .line("Magnitude|@magnitude")
        .line("RA|@{ra_h}h")
        .line("Dec|@{dec}°")
        .format("@magnitude", ".2f")
        .format("@ra_h", ".2f")
        .format("@dec", ".1f"),
    )
    + scale_size_identity()
    # Constellation name labels
    + geom_text(aes(x="x", y="y", label="name"), data=centroids, color=INK_SOFT, size=7, fontface="italic")
    # Grid tick labels
    + geom_text(aes(x="x", y="y", label="label"), data=df_declab, color=INK_MUTED, size=5.5)
    + geom_text(aes(x="x", y="y", label="label"), data=df_ralab, color=INK_MUTED, size=5.5)
    # Magnitude legend panel
    + geom_rect(
        aes(xmin="xmin", xmax="xmax", ymin="ymin", ymax="ymax"),
        data=df_legend_bg,
        fill=ELEVATED_BG,
        color=INK_SOFT,
        alpha=0.9,
        size=0.4,
    )
    + geom_point(aes(x="x", y="y", size="size"), data=df_legend, color=BRAND, alpha=0.95, shape=16)
    + geom_text(aes(x="x", y="y", label="label"), data=df_legend, color=INK_SOFT, size=5, nudge_x=10, hjust=0)
    + geom_text(aes(x="x", y="y"), data=df_legend_title, label="Magnitude", color=INK, size=6, fontface="bold")
    + labs(
        title="star-chart-constellation · python · letsplot · anyplot.ai",
        caption="Azimuthal equidistant projection · point size ∝ brightness (lower magnitude = brighter)",
    )
    + coord_fixed(ratio=1)
    + scale_x_continuous(limits=[-160, 160])
    + scale_y_continuous(limits=[-160, 160])
    + theme(
        plot_background=element_rect(fill=PAGE_BG, color=PAGE_BG),
        panel_background=element_rect(fill=PAGE_BG, color=PAGE_BG),
        panel_grid=element_blank(),
        axis_line=element_blank(),
        axis_ticks=element_blank(),
        axis_text=element_blank(),
        axis_title=element_blank(),
        plot_title=element_text(size=16, face="bold", color=INK),
        plot_caption=element_text(size=11, color=INK_MUTED),
        legend_position="none",
    )
    + ggsize(600, 600)
)

# Save (square → 2400 × 2400 px at scale 4)
ggsave(plot, f"plot-{THEME}.png", path=".", scale=4)
ggsave(plot, f"plot-{THEME}.html", path=".")
Runnable source as JSON, for any HTTP client: https://api.anyplot.ai/specs/star-chart-constellation/letsplot/code. Any spec id and library id listed in llms-full.txt fit the same URL shape; every URL below is complete and callable.
{
  "spec_id": "star-chart-constellation",
  "language": "python",
  "library": "letsplot",
  "page": "https://anyplot.ai/star-chart-constellation/python/letsplot",
  "hub": "https://anyplot.ai/star-chart-constellation",
  "code_json": "https://api.anyplot.ai/specs/star-chart-constellation/letsplot/code",
  "spec_json": "https://api.anyplot.ai/specs/star-chart-constellation",
  "render_light_png": "https://storage.googleapis.com/anyplot-images/plots/star-chart-constellation/python/letsplot/plot-light.png",
  "render_dark_png": "https://storage.googleapis.com/anyplot-images/plots/star-chart-constellation/python/letsplot/plot-dark.png",
  "interactive_light_html": "https://storage.googleapis.com/anyplot-images/plots/star-chart-constellation/python/letsplot/plot-light.html",
  "interactive_dark_html": "https://storage.googleapis.com/anyplot-images/plots/star-chart-constellation/python/letsplot/plot-dark.html",
  "quality_score": 92.0,
  "license": "MIT",
  "guide": "https://anyplot.ai/llms.txt"
}
Part of Star Chart with Constellations on anyplot.ai.