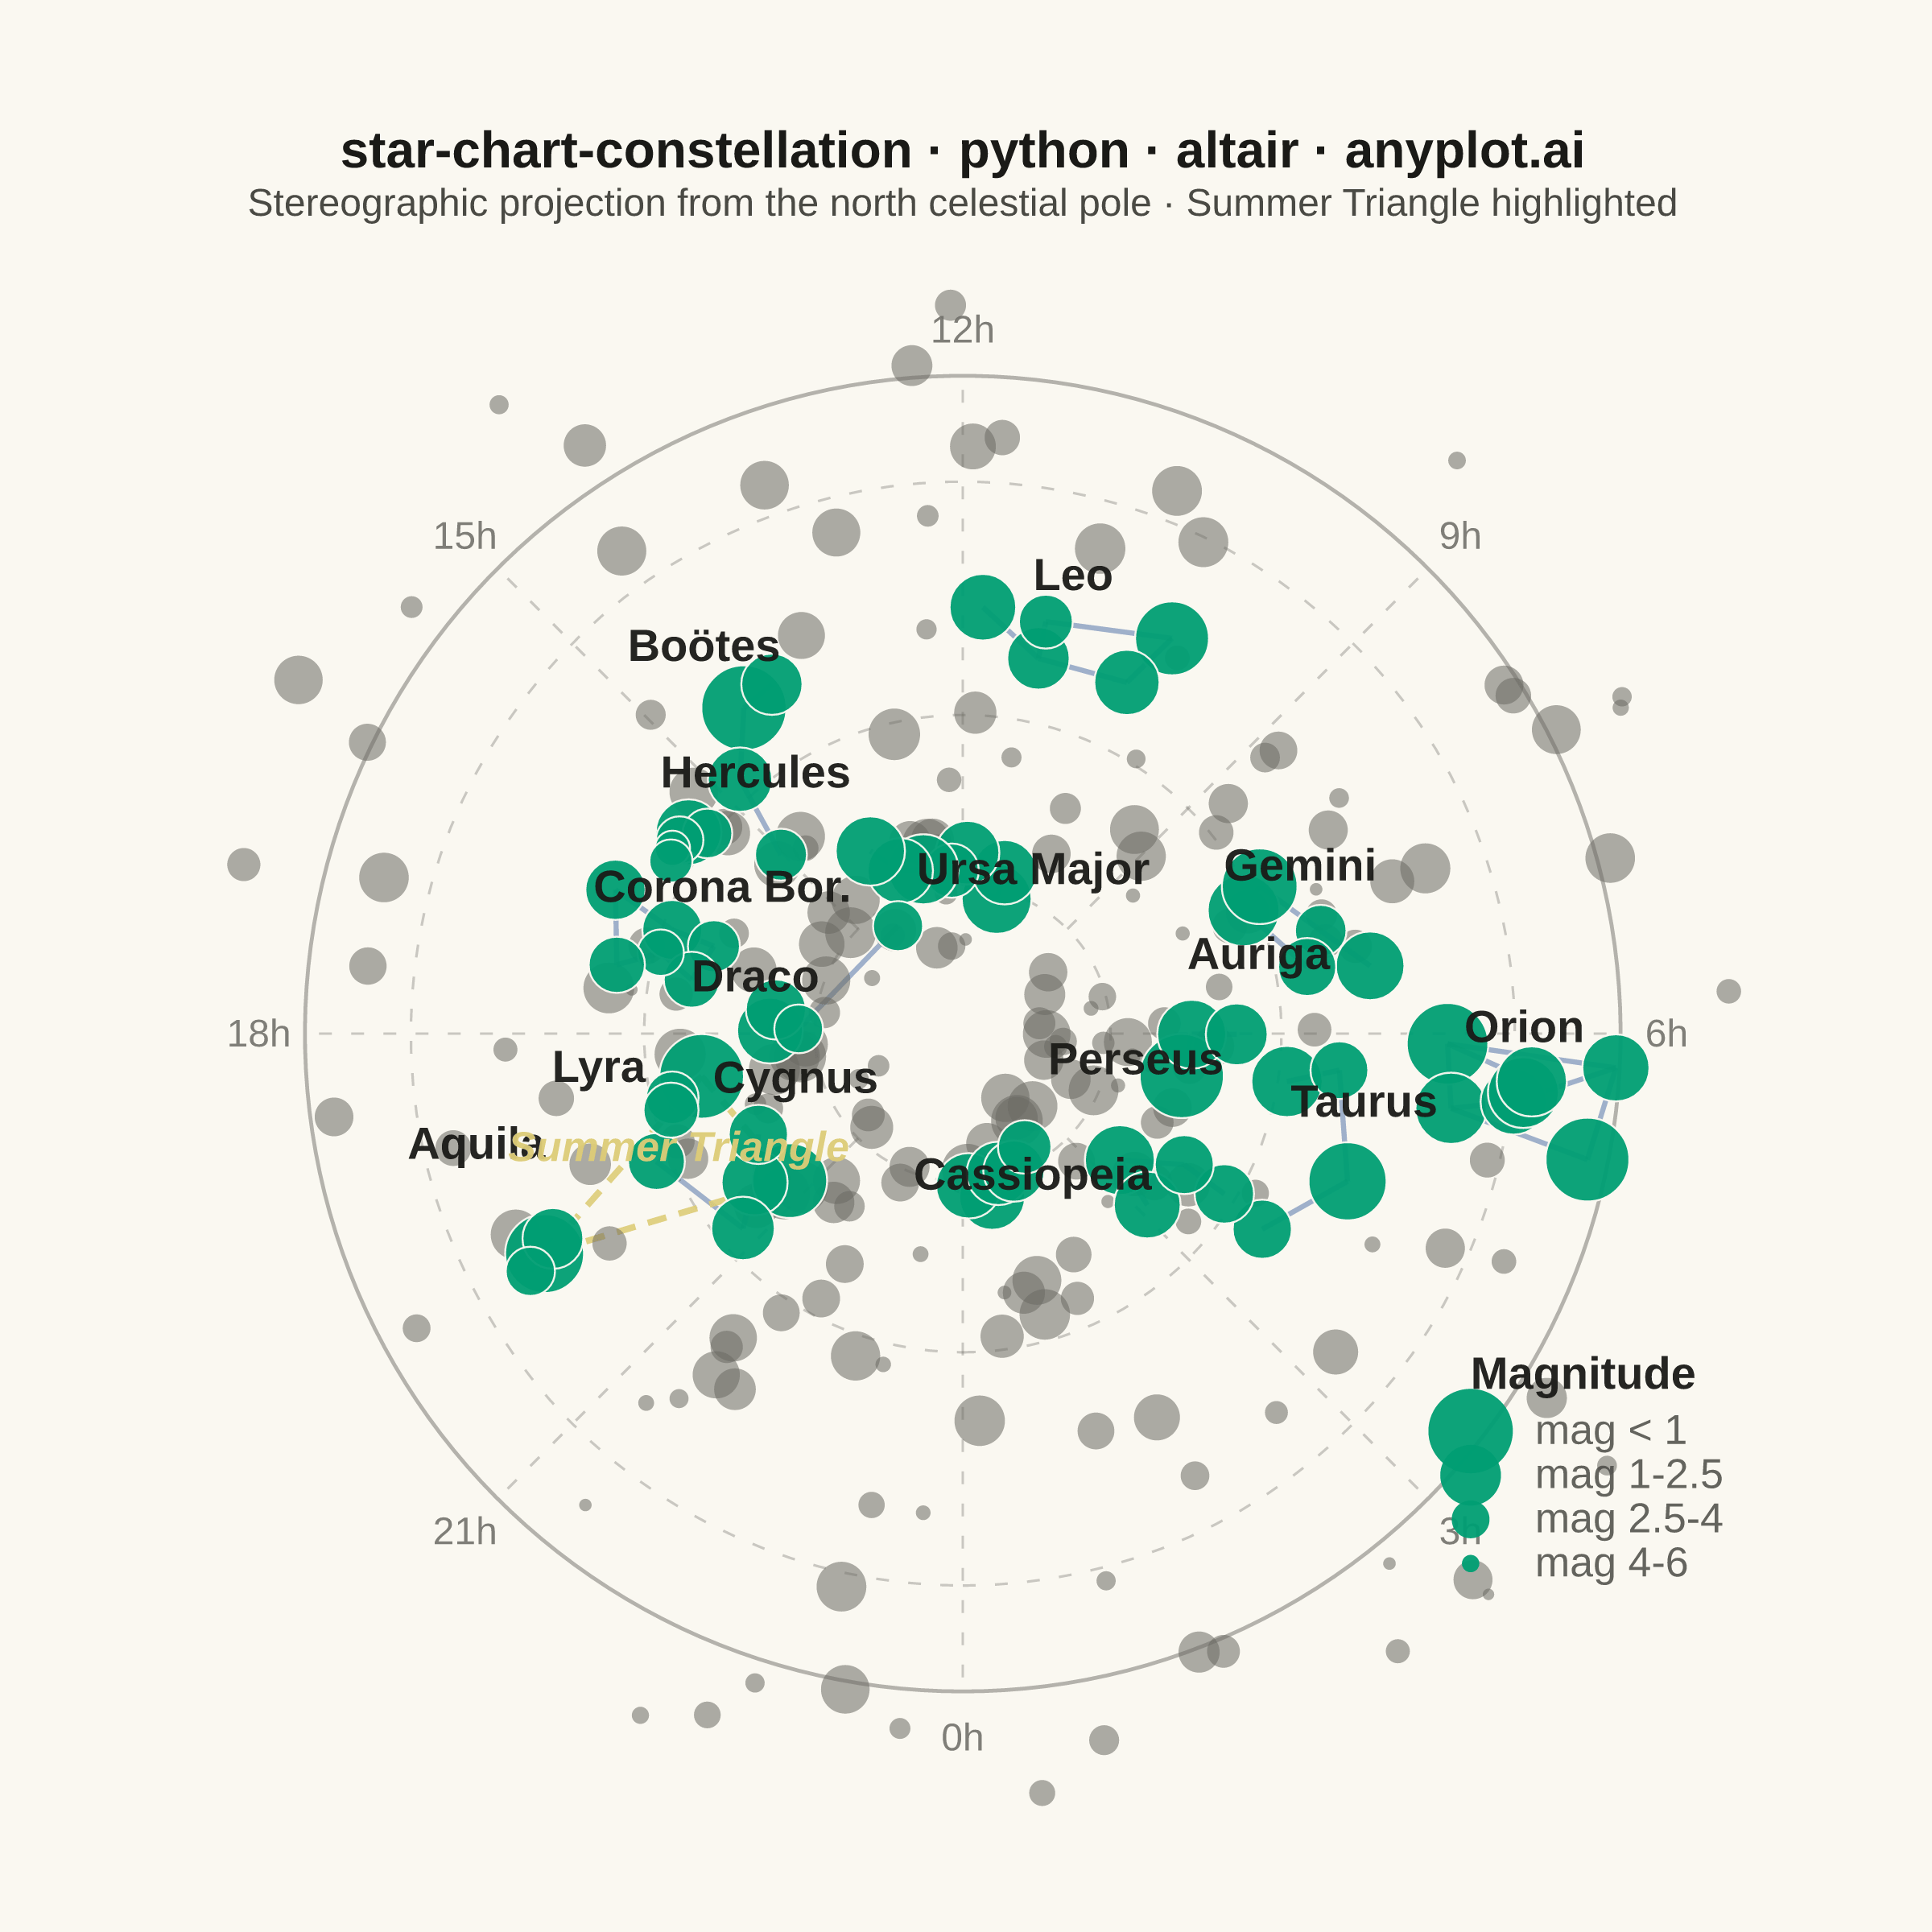
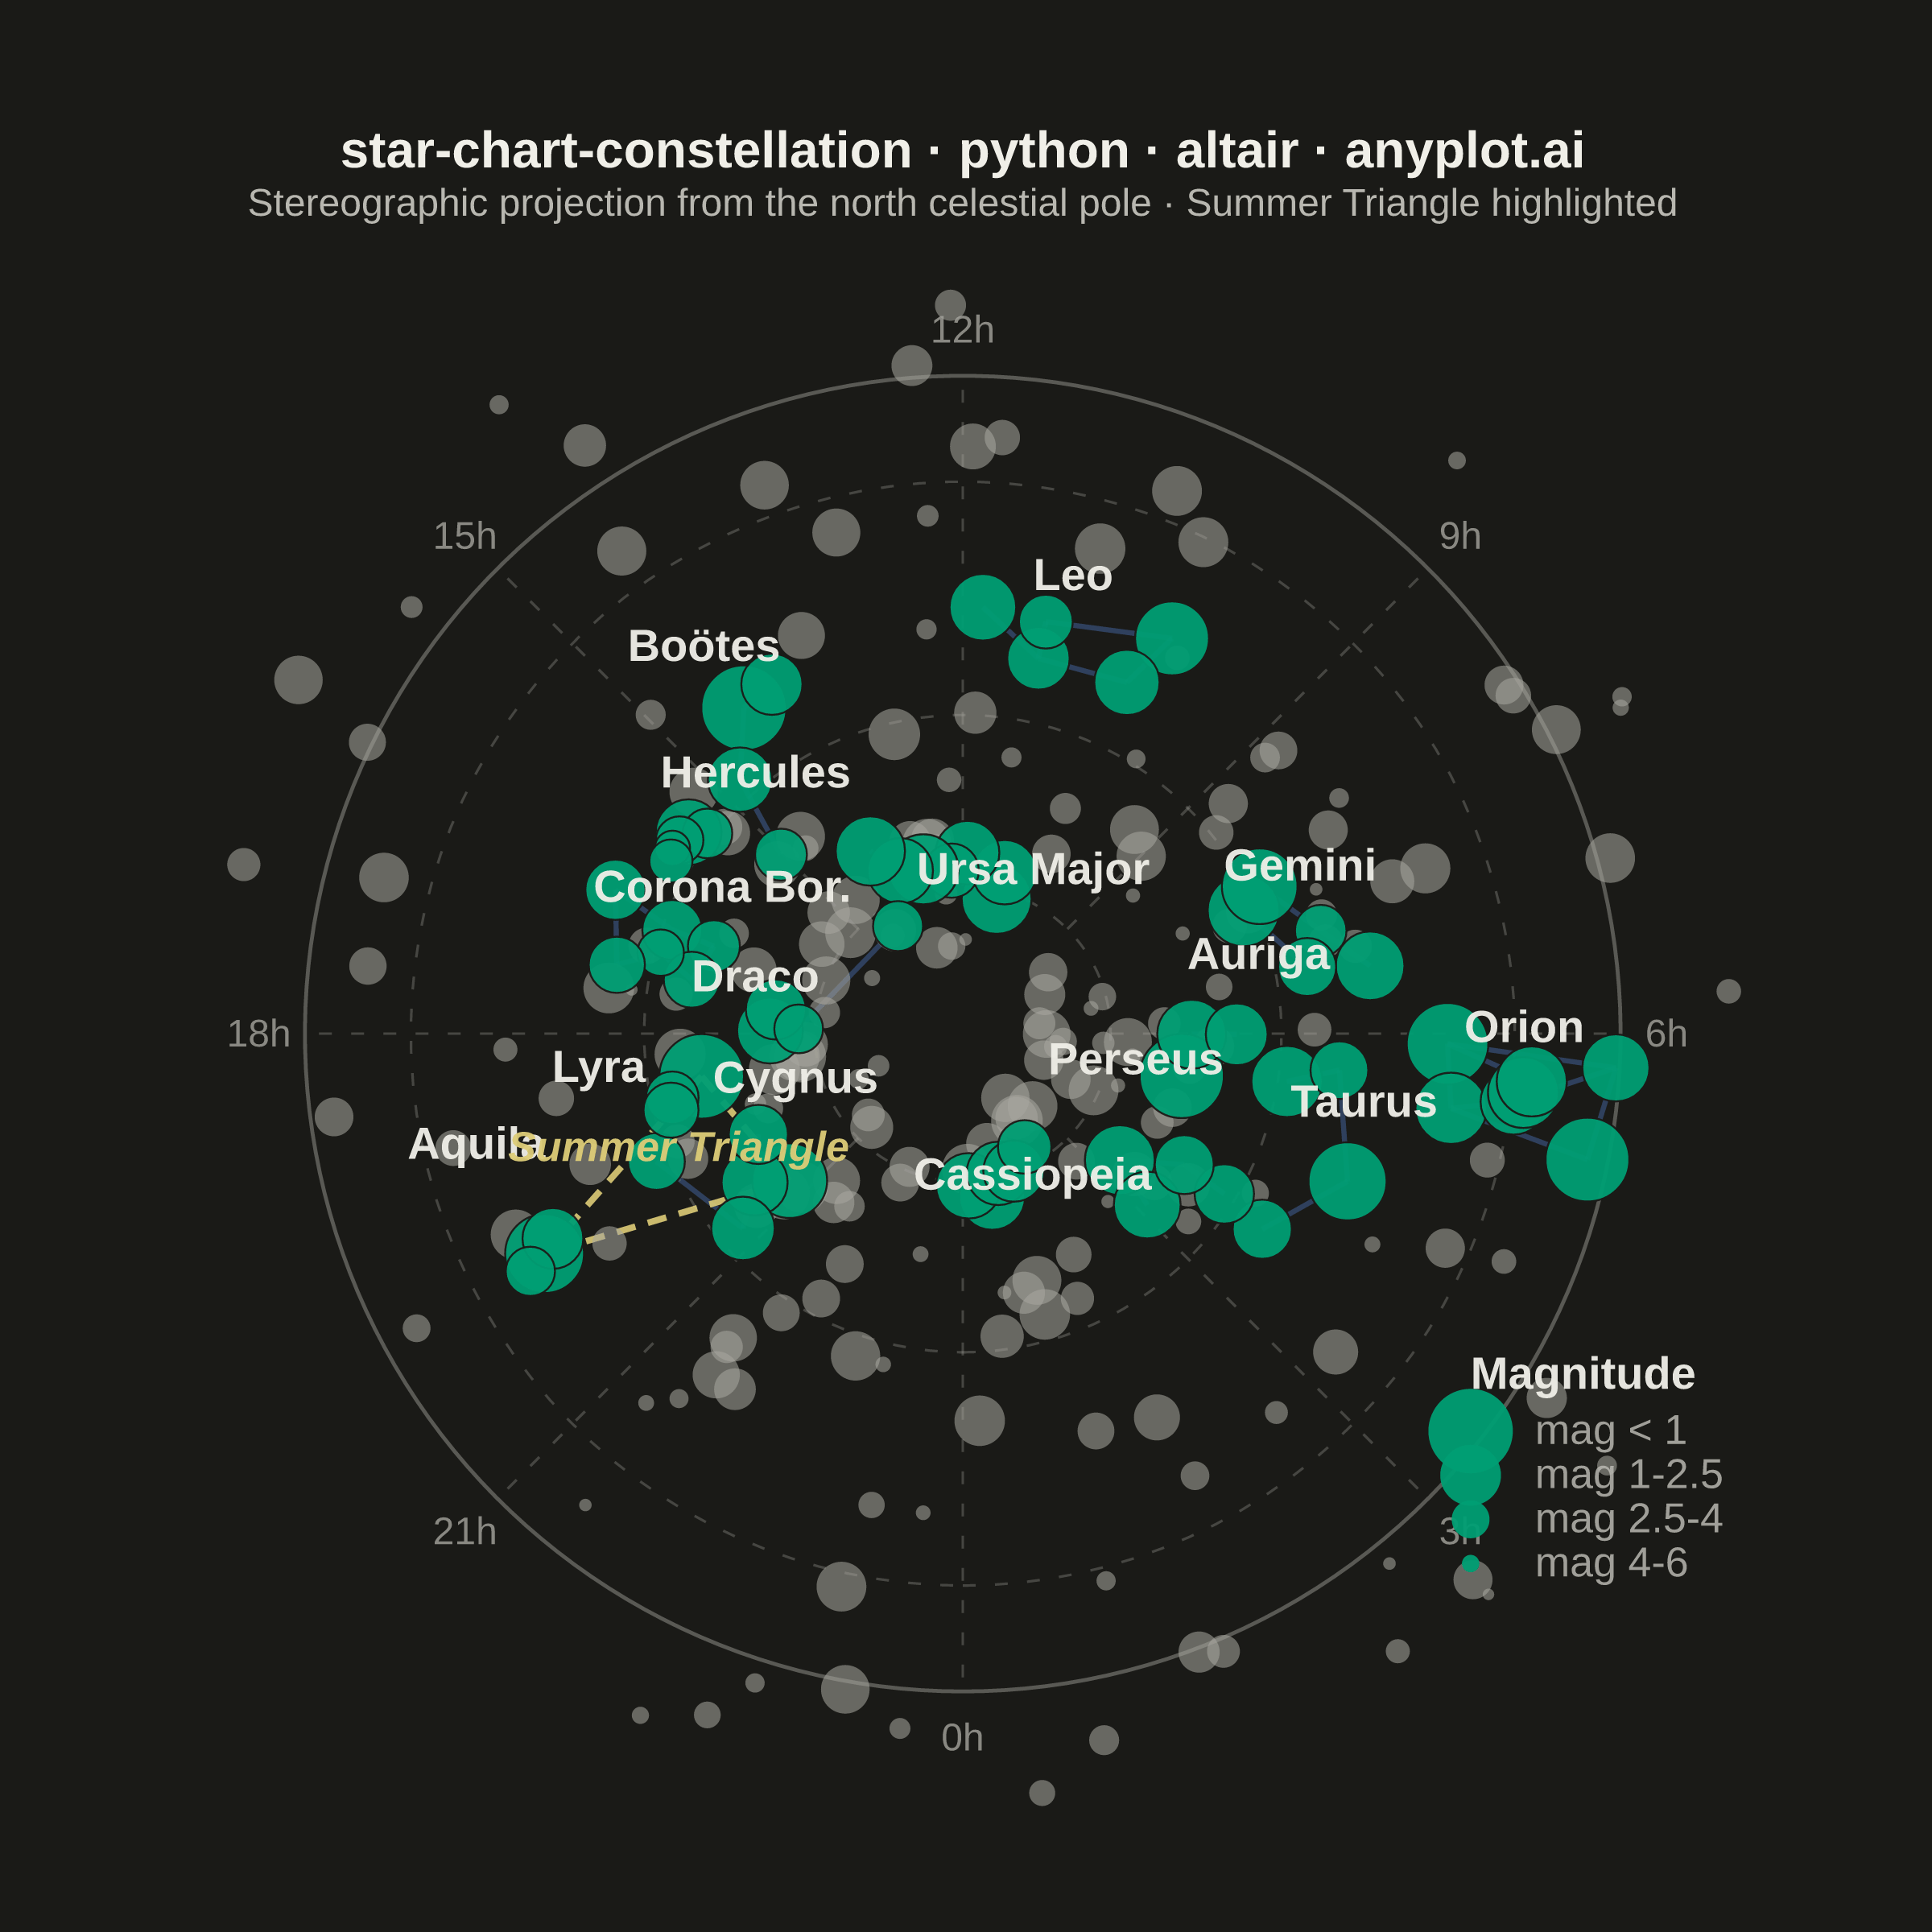
A celestial map that plots stars on a sky projection (stereographic or azimuthal equidistant) with constellation stick-figure lines connecting notable stars. Star apparent magnitudes are represented by point size (brighter stars appear larger), and a coordinate grid overlays the chart for orientation. The dark background mimics a night sky, making this an intuitive tool for identifying constellations and planning observations.
""" anyplot.ai
star-chart-constellation: Star Chart with Constellations
Library: altair 6.2.1 | Python 3.13.13
Quality: 90/100 | Updated: 2026-06-17
"""

import os

import altair as alt
import numpy as np
import pandas as pd
from PIL import Image


# Theme-adaptive chrome (Imprint palette)
THEME = os.getenv("ANYPLOT_THEME", "light")
PAGE_BG = "#FAF8F1" if THEME == "light" else "#1A1A17"
ELEVATED_BG = "#FFFDF6" if THEME == "light" else "#242420"
INK = "#1A1A17" if THEME == "light" else "#F0EFE8"
INK_SOFT = "#4A4A44" if THEME == "light" else "#B8B7B0"
INK_MUTED = "#6B6A63" if THEME == "light" else "#A8A79F"

# Imprint palette
BRAND = "#009E73"  # brand green — brightest stars / first series
BLUE = "#4467A3"  # dim stars / constellation lines
AMBER = "#DDCC77"  # warning/focal anchor — Summer Triangle highlight

# Data - Stars and constellations for a northern sky view
np.random.seed(42)

# Major constellation stars with RA (hours) and Dec (degrees)
stars_data = [
    # Orion
    ("Betelgeuse", 5.92, 7.41, 0.42, "Ori"),
    ("Rigel", 5.24, -8.20, 0.13, "Ori"),
    ("Bellatrix", 5.42, 6.35, 1.64, "Ori"),
    ("Mintaka", 5.53, -0.30, 2.23, "Ori"),
    ("Alnilam", 5.60, -1.20, 1.69, "Ori"),
    ("Alnitak", 5.68, -1.94, 1.77, "Ori"),
    ("Saiph", 5.80, -9.67, 2.09, "Ori"),
    # Ursa Major (Big Dipper)
    ("Dubhe", 11.06, 61.75, 1.79, "UMa"),
    ("Merak", 11.03, 56.38, 2.37, "UMa"),
    ("Phecda", 11.90, 53.69, 2.44, "UMa"),
    ("Megrez", 12.26, 57.03, 3.31, "UMa"),
    ("Alioth", 12.90, 55.96, 1.77, "UMa"),
    ("Mizar", 13.40, 54.93, 2.27, "UMa"),
    ("Alkaid", 13.79, 49.31, 1.86, "UMa"),
    # Cassiopeia
    ("Schedar", 0.68, 56.54, 2.23, "Cas"),
    ("Caph", 0.15, 59.15, 2.27, "Cas"),
    ("Gamma Cas", 0.95, 60.72, 2.47, "Cas"),
    ("Ruchbah", 1.36, 60.24, 2.68, "Cas"),
    ("Segin", 1.91, 63.67, 3.37, "Cas"),
    # Leo
    ("Regulus", 10.14, 11.97, 1.35, "Leo"),
    ("Denebola", 11.82, 14.57, 2.14, "Leo"),
    ("Algieba", 10.33, 19.84, 2.28, "Leo"),
    ("Zosma", 11.24, 20.52, 2.56, "Leo"),
    ("Chertan", 11.24, 15.43, 3.34, "Leo"),
    # Cygnus
    ("Deneb", 20.69, 45.28, 1.25, "Cyg"),
    ("Sadr", 20.37, 40.26, 2.20, "Cyg"),
    ("Gienah Cyg", 20.77, 33.97, 2.46, "Cyg"),
    ("Albireo", 19.51, 27.96, 3.08, "Cyg"),
    ("Delta Cyg", 19.75, 45.13, 2.87, "Cyg"),
    # Lyra
    ("Vega", 18.62, 38.78, 0.03, "Lyr"),
    ("Sheliak", 18.83, 33.36, 3.45, "Lyr"),
    ("Sulafat", 18.98, 32.69, 3.24, "Lyr"),
    # Gemini
    ("Castor", 7.58, 31.89, 1.58, "Gem"),
    ("Pollux", 7.76, 28.03, 1.14, "Gem"),
    ("Alhena", 6.63, 16.40, 1.93, "Gem"),
    ("Wasat", 7.07, 21.98, 3.53, "Gem"),
    ("Mebsuta", 6.73, 25.13, 2.98, "Gem"),
    # Taurus
    ("Aldebaran", 4.60, 16.51, 0.85, "Tau"),
    ("Elnath", 5.44, 28.61, 1.65, "Tau"),
    ("Alcyone", 3.79, 24.11, 2.87, "Tau"),
    ("Tianguan", 5.63, 21.14, 3.00, "Tau"),
    # Bootes
    ("Arcturus", 14.26, 19.18, -0.05, "Boo"),
    ("Izar", 14.75, 27.07, 2.37, "Boo"),
    ("Muphrid", 13.91, 18.40, 2.68, "Boo"),
    ("Nekkar", 15.03, 40.39, 3.50, "Boo"),
    # Aquila
    ("Altair", 19.85, 8.87, 0.76, "Aql"),
    ("Tarazed", 19.77, 10.61, 2.72, "Aql"),
    ("Alshain", 19.92, 6.41, 3.71, "Aql"),
    # Corona Borealis
    ("Alphecca", 15.58, 26.71, 2.23, "CrB"),
    ("Nusakan", 15.46, 29.11, 3.68, "CrB"),
    ("Gamma CrB", 15.71, 26.30, 3.84, "CrB"),
    ("Delta CrB", 15.83, 26.07, 4.63, "CrB"),
    ("Epsilon CrB", 15.96, 26.88, 4.15, "CrB"),
    # Hercules
    ("Kornephoros", 16.50, 21.49, 2.77, "Her"),
    ("Zeta Her", 16.69, 31.60, 2.81, "Her"),
    ("Eta Her", 16.71, 38.92, 3.49, "Her"),
    ("Pi Her", 17.25, 36.81, 3.16, "Her"),
    ("Epsilon Her", 17.00, 30.93, 3.92, "Her"),
    ("Delta Her", 17.25, 24.84, 3.14, "Her"),
    # Draco
    ("Eltanin", 17.94, 51.49, 2.23, "Dra"),
    ("Rastaban", 17.51, 52.30, 2.79, "Dra"),
    ("Grumium", 17.89, 56.87, 3.75, "Dra"),
    ("Thuban", 14.07, 64.38, 3.65, "Dra"),
    # Perseus
    ("Mirfak", 3.41, 49.86, 1.80, "Per"),
    ("Algol", 3.14, 40.96, 2.12, "Per"),
    ("Zeta Per", 3.90, 31.88, 2.85, "Per"),
    ("Epsilon Per", 3.96, 40.01, 2.89, "Per"),
    # Auriga
    ("Capella", 5.27, 46.00, 0.08, "Aur"),
    ("Menkalinan", 5.99, 44.95, 1.90, "Aur"),
    ("Theta Aur", 5.99, 37.21, 2.62, "Aur"),
]

# Background filler stars (dim field) — magnitude threshold keeps clutter down
n_filler = 200
filler_ra = np.random.uniform(0, 24, n_filler)
filler_dec = np.random.uniform(-20, 75, n_filler)
filler_mag = np.random.uniform(3.5, 5.5, n_filler)

stars = pd.DataFrame(stars_data, columns=["star_id", "ra", "dec", "magnitude", "constellation"])
filler = pd.DataFrame(
    {
        "star_id": [f"HIP{i}" for i in range(n_filler)],
        "ra": filler_ra,
        "dec": filler_dec,
        "magnitude": filler_mag,
        "constellation": "field",
    }
)
stars = pd.concat([stars, filler], ignore_index=True)

# Stereographic projection from north celestial pole (inline, no helper function)
ra_rad = np.radians(stars["ra"].values * 15.0)
dec_rad = np.radians(stars["dec"].values)
r = np.cos(dec_rad) / (1.0 + np.sin(dec_rad))
stars["proj_x"] = r * np.sin(ra_rad)
stars["proj_y"] = -r * np.cos(ra_rad)

# Invert magnitude for sizing: brighter stars (lower magnitude) get larger points
mag_min, mag_max = stars["magnitude"].min(), stars["magnitude"].max()
stars["size"] = ((mag_max - stars["magnitude"]) / (mag_max - mag_min)) * 600 + 30

named_stars = stars[stars["constellation"] != "field"].copy()
field_stars = stars[stars["constellation"] == "field"].copy()

# Constellation line edges (pairs of star_id)
edges_list = [
    # Orion
    ("Betelgeuse", "Bellatrix"),
    ("Bellatrix", "Mintaka"),
    ("Mintaka", "Alnilam"),
    ("Alnilam", "Alnitak"),
    ("Betelgeuse", "Alnitak"),
    ("Bellatrix", "Rigel"),
    ("Betelgeuse", "Saiph"),
    ("Rigel", "Saiph"),
    ("Mintaka", "Saiph"),
    # Ursa Major (Big Dipper)
    ("Dubhe", "Merak"),
    ("Merak", "Phecda"),
    ("Phecda", "Megrez"),
    ("Megrez", "Alioth"),
    ("Alioth", "Mizar"),
    ("Mizar", "Alkaid"),
    ("Megrez", "Dubhe"),
    # Cassiopeia
    ("Caph", "Schedar"),
    ("Schedar", "Gamma Cas"),
    ("Gamma Cas", "Ruchbah"),
    ("Ruchbah", "Segin"),
    # Leo
    ("Regulus", "Chertan"),
    ("Chertan", "Zosma"),
    ("Zosma", "Denebola"),
    ("Regulus", "Algieba"),
    ("Algieba", "Zosma"),
    # Cygnus (Northern Cross)
    ("Deneb", "Sadr"),
    ("Sadr", "Gienah Cyg"),
    ("Gienah Cyg", "Albireo"),
    ("Sadr", "Delta Cyg"),
    # Lyra
    ("Vega", "Sheliak"),
    ("Sheliak", "Sulafat"),
    ("Sulafat", "Vega"),
    # Gemini
    ("Castor", "Pollux"),
    ("Pollux", "Wasat"),
    ("Wasat", "Alhena"),
    ("Castor", "Mebsuta"),
    # Taurus
    ("Aldebaran", "Tianguan"),
    ("Tianguan", "Elnath"),
    ("Aldebaran", "Alcyone"),
    # Bootes
    ("Arcturus", "Izar"),
    ("Arcturus", "Muphrid"),
    ("Izar", "Nekkar"),
    # Aquila
    ("Altair", "Tarazed"),
    ("Altair", "Alshain"),
    # Corona Borealis
    ("Epsilon CrB", "Alphecca"),
    ("Alphecca", "Nusakan"),
    ("Alphecca", "Gamma CrB"),
    ("Gamma CrB", "Delta CrB"),
    ("Delta CrB", "Epsilon CrB"),
    # Hercules (keystone)
    ("Kornephoros", "Zeta Her"),
    ("Zeta Her", "Eta Her"),
    ("Eta Her", "Pi Her"),
    ("Pi Her", "Epsilon Her"),
    ("Epsilon Her", "Delta Her"),
    ("Delta Her", "Kornephoros"),
    # Draco
    ("Eltanin", "Rastaban"),
    ("Rastaban", "Grumium"),
    ("Grumium", "Thuban"),
    # Perseus
    ("Mirfak", "Algol"),
    ("Mirfak", "Epsilon Per"),
    ("Epsilon Per", "Zeta Per"),
    # Auriga
    ("Capella", "Menkalinan"),
    ("Menkalinan", "Theta Aur"),
]

# Build edge dataframe with projected coordinates
star_lookup = stars.set_index("star_id")[["proj_x", "proj_y"]].to_dict("index")
edge_rows = []
for s1, s2 in edges_list:
    if s1 in star_lookup and s2 in star_lookup:
        edge_rows.append(
            {
                "x": star_lookup[s1]["proj_x"],
                "y": star_lookup[s1]["proj_y"],
                "x2": star_lookup[s2]["proj_x"],
                "y2": star_lookup[s2]["proj_y"],
            }
        )
edges_df = pd.DataFrame(edge_rows)

# Constellation label positions (centroid of named stars in projected space)
label_df = named_stars.groupby("constellation").agg(proj_x=("proj_x", "mean"), proj_y=("proj_y", "mean")).reset_index()
constellation_names = {
    "Ori": "Orion",
    "UMa": "Ursa Major",
    "Cas": "Cassiopeia",
    "Leo": "Leo",
    "Cyg": "Cygnus",
    "Lyr": "Lyra",
    "Gem": "Gemini",
    "Tau": "Taurus",
    "Boo": "Boötes",
    "Aql": "Aquila",
    "CrB": "Corona Bor.",
    "Her": "Hercules",
    "Dra": "Draco",
    "Per": "Perseus",
    "Aur": "Auriga",
}
label_df["name"] = label_df["constellation"].map(constellation_names)

# Custom label offsets to eliminate overlap in crowded regions
# (Hercules / Corona Borealis pushed further apart vs. previous attempt)
label_offsets = {
    "Cas": (0.06, -0.12),
    "Per": (-0.06, 0.10),
    "UMa": (0.16, -0.12),
    "Lyr": (-0.15, -0.07),
    "Cyg": (0.10, 0.06),
    "Aur": (0.10, 0.05),
    "Aql": (-0.12, 0.08),
    "Her": (0.17, 0.19),
    "CrB": (0.07, -0.20),
    "Dra": (-0.10, -0.08),
    "Boo": (-0.10, 0.08),
    "Tau": (0.10, -0.05),
}
for abbr, (dx, dy) in label_offsets.items():
    mask = label_df["constellation"] == abbr
    label_df.loc[mask, "proj_x"] += dx
    label_df.loc[mask, "proj_y"] += dy

# Highlight the Summer Triangle asterism (Vega, Deneb, Altair) as a storytelling focal point
summer_triangle_stars = ["Vega", "Deneb", "Altair"]
st_lookup = {s: star_lookup[s] for s in summer_triangle_stars}
triangle_edges = pd.DataFrame(
    [
        {
            "x": st_lookup["Vega"]["proj_x"],
            "y": st_lookup["Vega"]["proj_y"],
            "x2": st_lookup["Deneb"]["proj_x"],
            "y2": st_lookup["Deneb"]["proj_y"],
        },
        {
            "x": st_lookup["Deneb"]["proj_x"],
            "y": st_lookup["Deneb"]["proj_y"],
            "x2": st_lookup["Altair"]["proj_x"],
            "y2": st_lookup["Altair"]["proj_y"],
        },
        {
            "x": st_lookup["Altair"]["proj_x"],
            "y": st_lookup["Altair"]["proj_y"],
            "x2": st_lookup["Vega"]["proj_x"],
            "y2": st_lookup["Vega"]["proj_y"],
        },
    ]
)
# Summer Triangle label at centroid
st_cx = np.mean([st_lookup[s]["proj_x"] for s in summer_triangle_stars])
st_cy = np.mean([st_lookup[s]["proj_y"] for s in summer_triangle_stars])
st_label_df = pd.DataFrame([{"proj_x": st_cx, "proj_y": st_cy + 0.04}])

# Declination circles for the grid (projected as circles on the stereographic plane)
dec_circles_data = []
for dec_val in [0, 30, 60]:
    theta = np.linspace(0, 2 * np.pi, 120)
    dec_r = np.radians(dec_val)
    circ_r = np.cos(dec_r) / (1.0 + np.sin(dec_r))
    for i in range(len(theta)):
        dec_circles_data.append(
            {"gx": circ_r * np.sin(theta[i]), "gy": -circ_r * np.cos(theta[i]), "dec_label": f"{dec_val}°", "order": i}
        )
dec_circles_df = pd.DataFrame(dec_circles_data)

# RA radial lines for grid
ra_lines_data = []
for ra_h in range(0, 24, 3):
    ra_angle = np.radians(ra_h * 15.0)
    r_inner = np.cos(np.radians(60)) / (1.0 + np.sin(np.radians(60)))
    r_outer = np.cos(np.radians(-10)) / (1.0 + np.sin(np.radians(-10)))
    ra_lines_data.append(
        {
            "x": r_inner * np.sin(ra_angle),
            "y": -r_inner * np.cos(ra_angle),
            "x2": r_outer * np.sin(ra_angle),
            "y2": -r_outer * np.cos(ra_angle),
            "ra_label": f"{ra_h}h",
        }
    )
ra_lines_df = pd.DataFrame(ra_lines_data)

# RA labels at the boundary
ra_label_df = ra_lines_df.copy()
ra_label_df["lx"] = ra_label_df["x2"] * 1.07
ra_label_df["ly"] = ra_label_df["y2"] * 1.07

# Magnitude legend data (size classes, lower-right inside the plot)
legend_stars = pd.DataFrame(
    [
        {"lx": 0.92, "ly": -0.72, "lsize": 620, "label": "mag < 1"},
        {"lx": 0.92, "ly": -0.80, "lsize": 330, "label": "mag 1-2.5"},
        {"lx": 0.92, "ly": -0.88, "lsize": 140, "label": "mag 2.5-4"},
        {"lx": 0.92, "ly": -0.96, "lsize": 45, "label": "mag 4-6"},
    ]
)

# Boundary circle at dec=-10° to frame the projection
boundary_theta = np.linspace(0, 2 * np.pi, 200)
boundary_dec = np.radians(-10)
boundary_r = np.cos(boundary_dec) / (1.0 + np.sin(boundary_dec))
boundary_df = pd.DataFrame(
    {"bx": boundary_r * np.sin(boundary_theta), "by": -boundary_r * np.cos(boundary_theta), "order": range(200)}
)

# Plot domain
plot_bound = 1.22

# Shared magnitude→size scale (brighter = larger)
size_scale = alt.Scale(domain=[stars["size"].min(), stars["size"].max()], range=[12, 700])

# Interactive selection for constellation highlighting
highlight = alt.selection_point(fields=["constellation"], on="pointerover", empty=False)

X_AXIS = alt.X(
    "proj_x:Q",
    axis=alt.Axis(labels=False, ticks=False, domain=False, title="", grid=False),
    scale=alt.Scale(domain=[-plot_bound, plot_bound]),
)
Y_AXIS = alt.Y(
    "proj_y:Q",
    axis=alt.Axis(labels=False, ticks=False, domain=False, title="", grid=False),
    scale=alt.Scale(domain=[-plot_bound, plot_bound]),
)

# Boundary circle layer
boundary = (
    alt.Chart(boundary_df)
    .mark_line(strokeWidth=1.2, opacity=0.4)
    .encode(x="bx:Q", y="by:Q", order="order:Q", color=alt.value(INK_SOFT))
)

# RA radial grid lines
ra_grid = (
    alt.Chart(ra_lines_df)
    .mark_rule(strokeDash=[4, 6], strokeWidth=0.8, opacity=0.28)
    .encode(x="x:Q", y="y:Q", x2="x2:Q", y2="y2:Q", color=alt.value(INK_SOFT))
)

# Declination grid circles
dec_grid = (
    alt.Chart(dec_circles_df)
    .mark_line(strokeDash=[4, 6], strokeWidth=0.8, opacity=0.28)
    .encode(x="gx:Q", y="gy:Q", detail="dec_label:N", order="order:Q", color=alt.value(INK_SOFT))
)

# RA hour labels around the boundary (made more prominent per prior review)
ra_labels = (
    alt.Chart(ra_label_df)
    .mark_text(fontSize=12, opacity=0.7)
    .encode(x="lx:Q", y="ly:Q", text="ra_label:N", color=alt.value(INK_SOFT))
)

# Field (filler) stars — muted, recede behind the data
field_points = (
    alt.Chart(field_stars)
    .mark_circle(opacity=0.55)
    .encode(x=X_AXIS, y=Y_AXIS, size=alt.Size("size:Q", legend=None, scale=size_scale), color=alt.value(INK_MUTED))
)

# Constellation stick-figure lines (Imprint blue, semi-transparent)
lines = (
    alt.Chart(edges_df)
    .mark_rule(strokeWidth=1.6, opacity=0.5)
    .encode(x="x:Q", y="y:Q", x2="x2:Q", y2="y2:Q", color=alt.value(BLUE))
)

# Summer Triangle highlight lines (dashed amber — focal anchor)
triangle_lines = (
    alt.Chart(triangle_edges)
    .mark_rule(strokeWidth=2.0, strokeDash=[6, 4], opacity=0.9)
    .encode(x="x:Q", y="y:Q", x2="x2:Q", y2="y2:Q", color=alt.value(AMBER))
)

# Named constellation stars — brand green, sized by magnitude (brighter = larger).
# Solid brand keeps the stars clearly distinct from the blue stick-figure lines.
star_points = (
    alt.Chart(named_stars)
    .mark_circle(color=BRAND, stroke=PAGE_BG, strokeWidth=0.6)
    .encode(
        x=X_AXIS,
        y=Y_AXIS,
        size=alt.Size("size:Q", legend=None, scale=size_scale),
        opacity=alt.condition(highlight, alt.value(1.0), alt.value(0.95)),
        tooltip=["star_id:N", "magnitude:Q", "constellation:N", "ra:Q", "dec:Q"],
    )
    .add_params(highlight)
)

# Constellation labels (primary ink, theme-adaptive)
labels = (
    alt.Chart(label_df)
    .mark_text(fontSize=14, fontWeight="bold", dy=-20, opacity=0.95)
    .encode(x="proj_x:Q", y="proj_y:Q", text="name:N", color=alt.value(INK))
)

# Summer Triangle label
triangle_label = (
    alt.Chart(st_label_df)
    .mark_text(fontSize=13, fontStyle="italic", fontWeight="bold", opacity=0.95)
    .encode(x="proj_x:Q", y="proj_y:Q", text=alt.value("Summer Triangle"), color=alt.value(AMBER))
)

# Magnitude legend - star markers (brand green)
legend_points = (
    alt.Chart(legend_stars)
    .mark_circle(opacity=0.95, color=BRAND)
    .encode(
        x=alt.X("lx:Q", scale=alt.Scale(domain=[-plot_bound, plot_bound])),
        y=alt.Y("ly:Q", scale=alt.Scale(domain=[-plot_bound, plot_bound])),
        size=alt.Size("lsize:Q", legend=None, scale=size_scale),
    )
)

# Magnitude legend - text labels
legend_text = (
    alt.Chart(legend_stars)
    .mark_text(fontSize=13, align="left", dx=20, opacity=0.85)
    .encode(x="lx:Q", y="ly:Q", text="label:N", color=alt.value(INK_SOFT))
)

# Legend title
legend_title_df = pd.DataFrame([{"lx": 0.92, "ly": -0.62}])
legend_title = (
    alt.Chart(legend_title_df)
    .mark_text(fontSize=14, fontWeight="bold", align="left", opacity=0.95)
    .encode(x="lx:Q", y="ly:Q", text=alt.value("Magnitude"), color=alt.value(INK))
)

# Combine all layers
chart = (
    (
        boundary
        + ra_grid
        + dec_grid
        + ra_labels
        + lines
        + triangle_lines
        + field_points
        + star_points
        + labels
        + triangle_label
        + legend_points
        + legend_text
        + legend_title
    )
    .properties(
        width=480,
        height=480,
        background=PAGE_BG,
        title=alt.Title(
            text="star-chart-constellation · python · altair · anyplot.ai",
            subtitle="Stereographic projection from the north celestial pole · Summer Triangle highlighted",
            fontSize=16,
            subtitleFontSize=12,
            anchor="middle",
            color=INK,
            subtitleColor=INK_SOFT,
            offset=12,
        ),
    )
    .configure_view(fill=PAGE_BG, strokeWidth=0)
    .configure_axis(grid=False, domainColor=INK_SOFT, labelColor=INK_SOFT, titleColor=INK)
    .configure_title(color=INK)
)

# Save PNG (square target) + interactive HTML
chart.save(f"plot-{THEME}.png", scale_factor=4.0)
chart.save(f"plot-{THEME}.html")

# Pad-only to the exact square canvas target (no crop — see altair library prompt)
TW, TH = 2400, 2400
_img = Image.open(f"plot-{THEME}.png").convert("RGB")
_w, _h = _img.size
if _w > TW or _h > TH:
    raise SystemExit(
        f"altair vl-convert produced {_w}×{_h}, exceeds target {TW}×{TH}. "
        f"Shrink chart .properties(width=, height=) values and re-render."
    )
if _w < TW or _h < TH:
    _canvas = Image.new("RGB", (TW, TH), PAGE_BG)
    _canvas.paste(_img, ((TW - _w) // 2, (TH - _h) // 2))
    _canvas.save(f"plot-{THEME}.png")
Runnable source as JSON, for any HTTP client: https://api.anyplot.ai/specs/star-chart-constellation/altair/code. Any spec id and library id listed in llms-full.txt fit the same URL shape; every URL below is complete and callable.
{
  "spec_id": "star-chart-constellation",
  "language": "python",
  "library": "altair",
  "page": "https://anyplot.ai/star-chart-constellation/python/altair",
  "hub": "https://anyplot.ai/star-chart-constellation",
  "code_json": "https://api.anyplot.ai/specs/star-chart-constellation/altair/code",
  "spec_json": "https://api.anyplot.ai/specs/star-chart-constellation",
  "render_light_png": "https://storage.googleapis.com/anyplot-images/plots/star-chart-constellation/python/altair/plot-light.png",
  "render_dark_png": "https://storage.googleapis.com/anyplot-images/plots/star-chart-constellation/python/altair/plot-dark.png",
  "interactive_light_html": "https://storage.googleapis.com/anyplot-images/plots/star-chart-constellation/python/altair/plot-light.html",
  "interactive_dark_html": "https://storage.googleapis.com/anyplot-images/plots/star-chart-constellation/python/altair/plot-dark.html",
  "quality_score": 90.0,
  "license": "MIT",
  "guide": "https://anyplot.ai/llms.txt"
}
Part of Star Chart with Constellations on anyplot.ai.