The same plot in 14 other libraries — JavaScript: D3.js, Apache ECharts, Highcharts, MUI X Charts; Python: Altair, Bokeh, lets-plot, Matplotlib, Plotly, plotnine, Pygal, Seaborn; R: ggplot2; Julia: Makie.jl. Compare all 15 side by side: EAN-13 Barcode in Python, R, Julia and JavaScript.
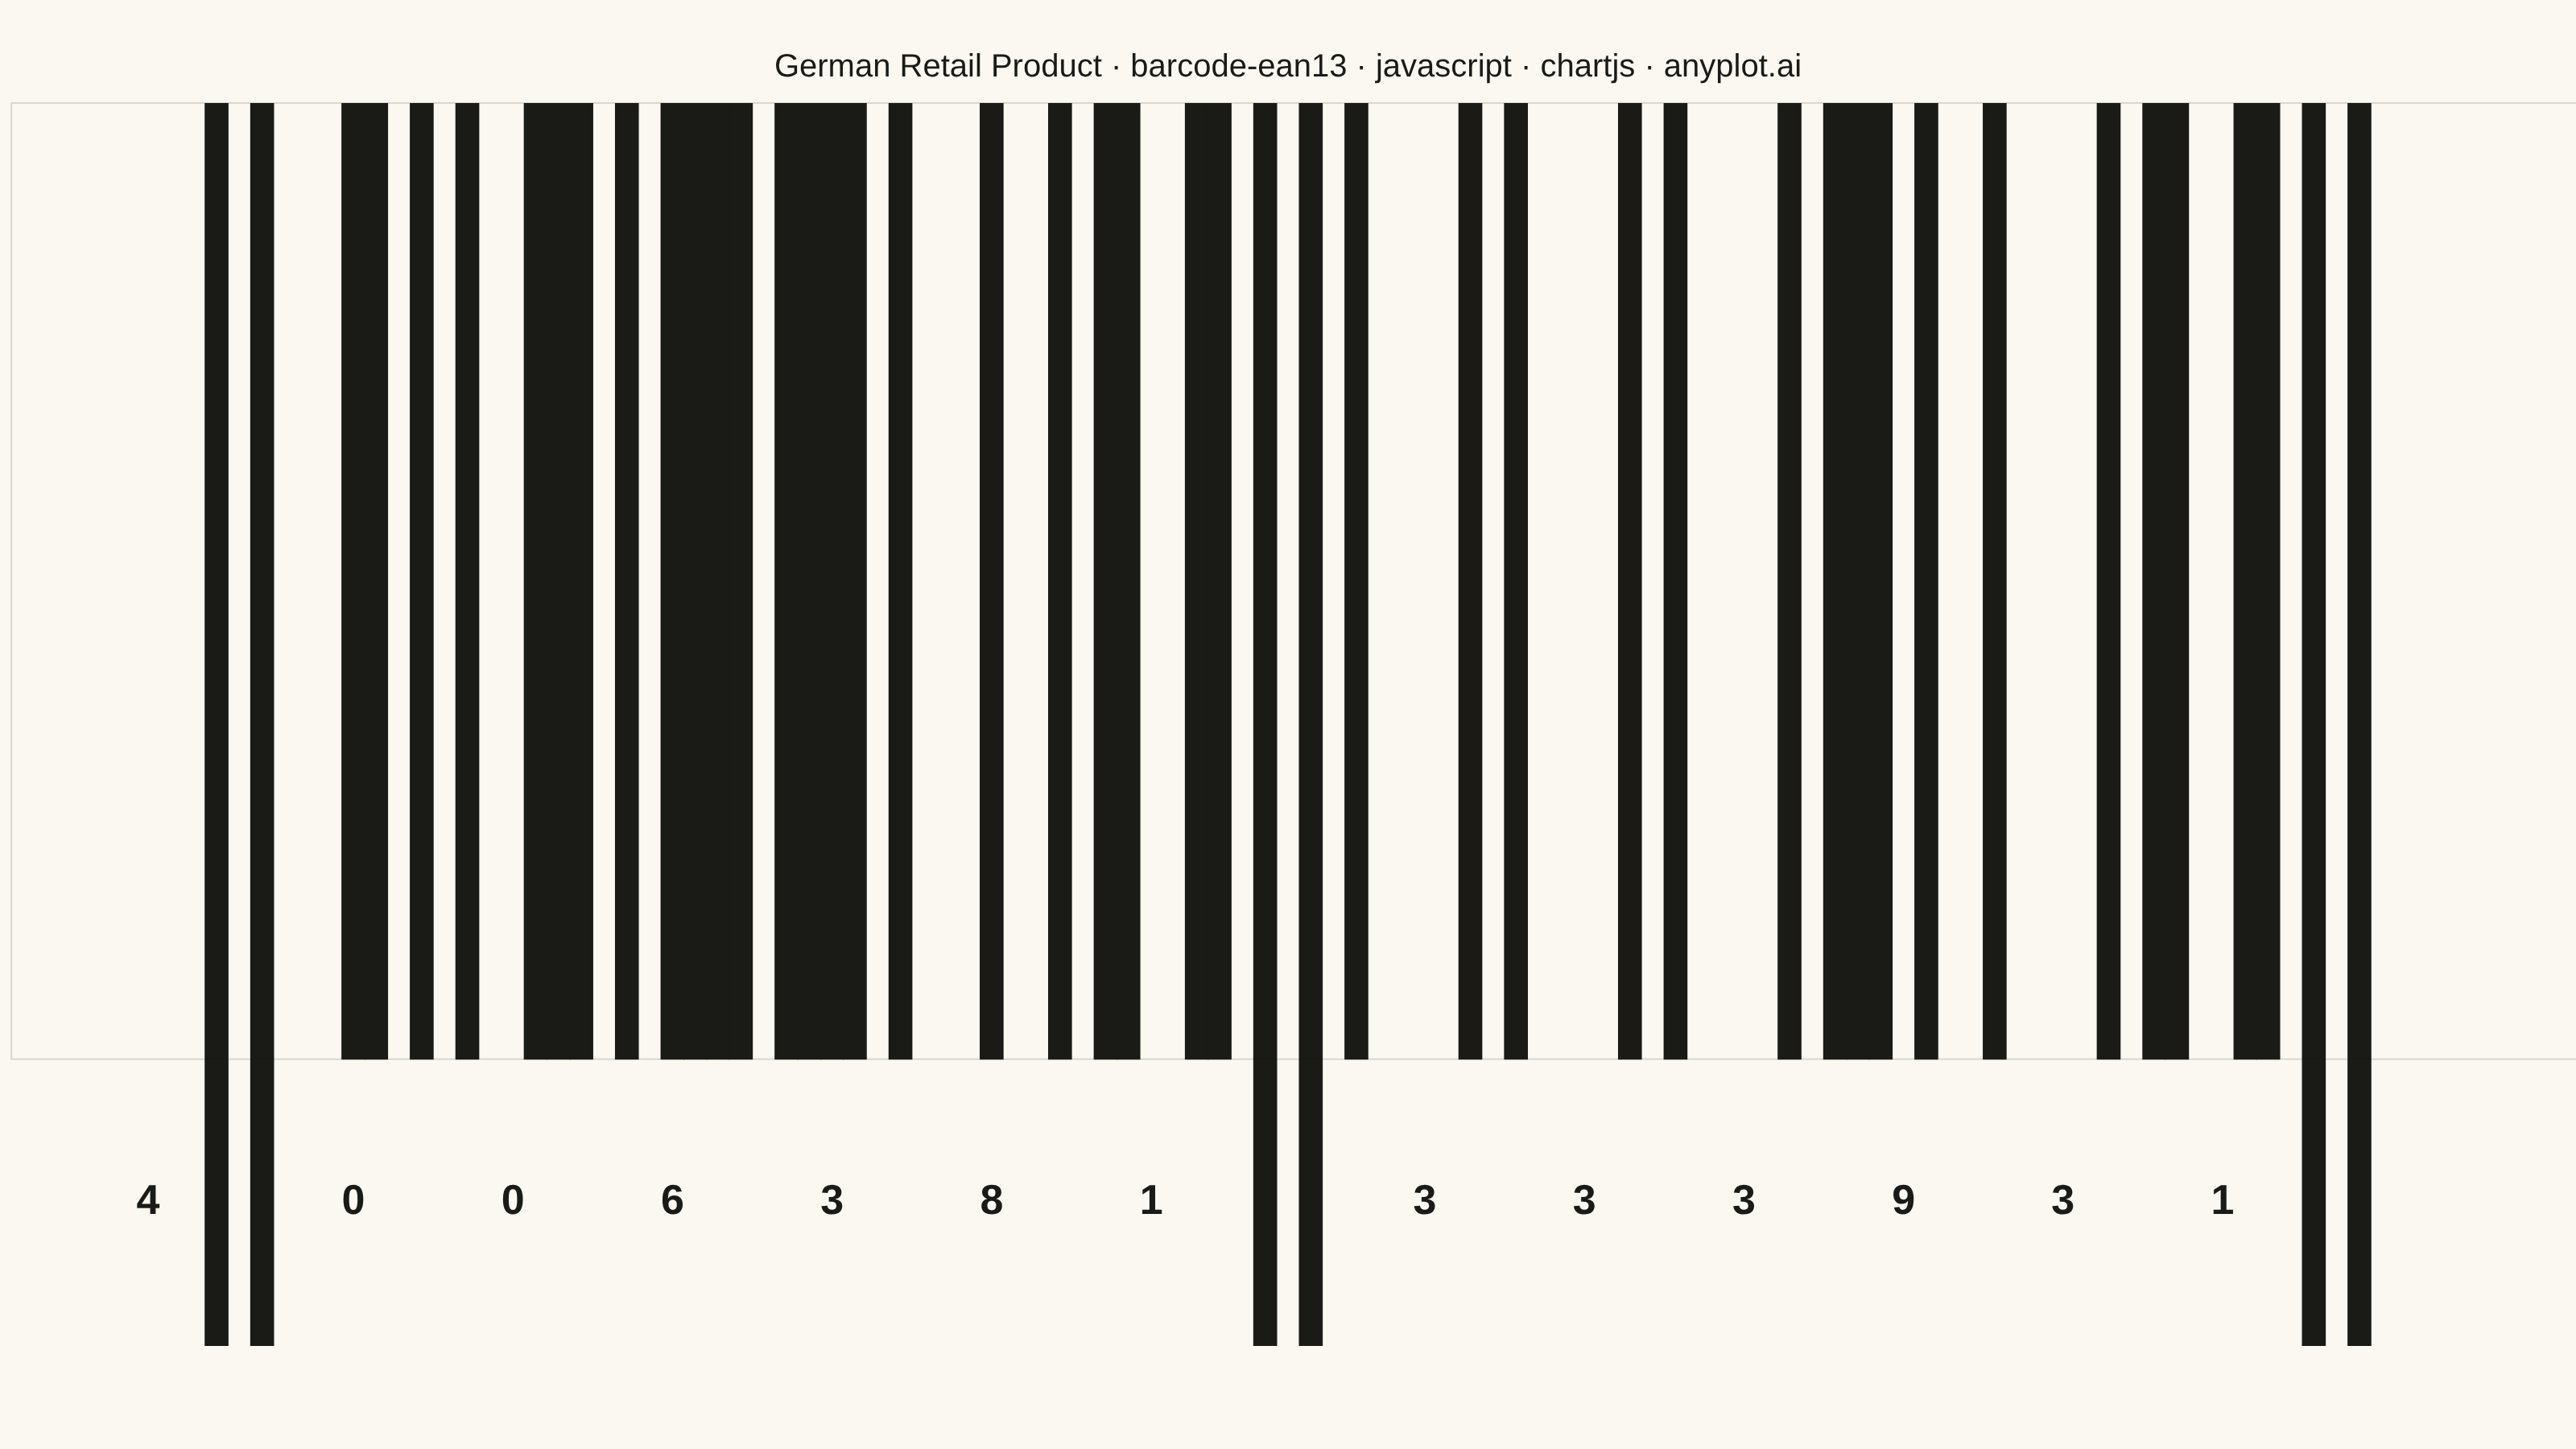
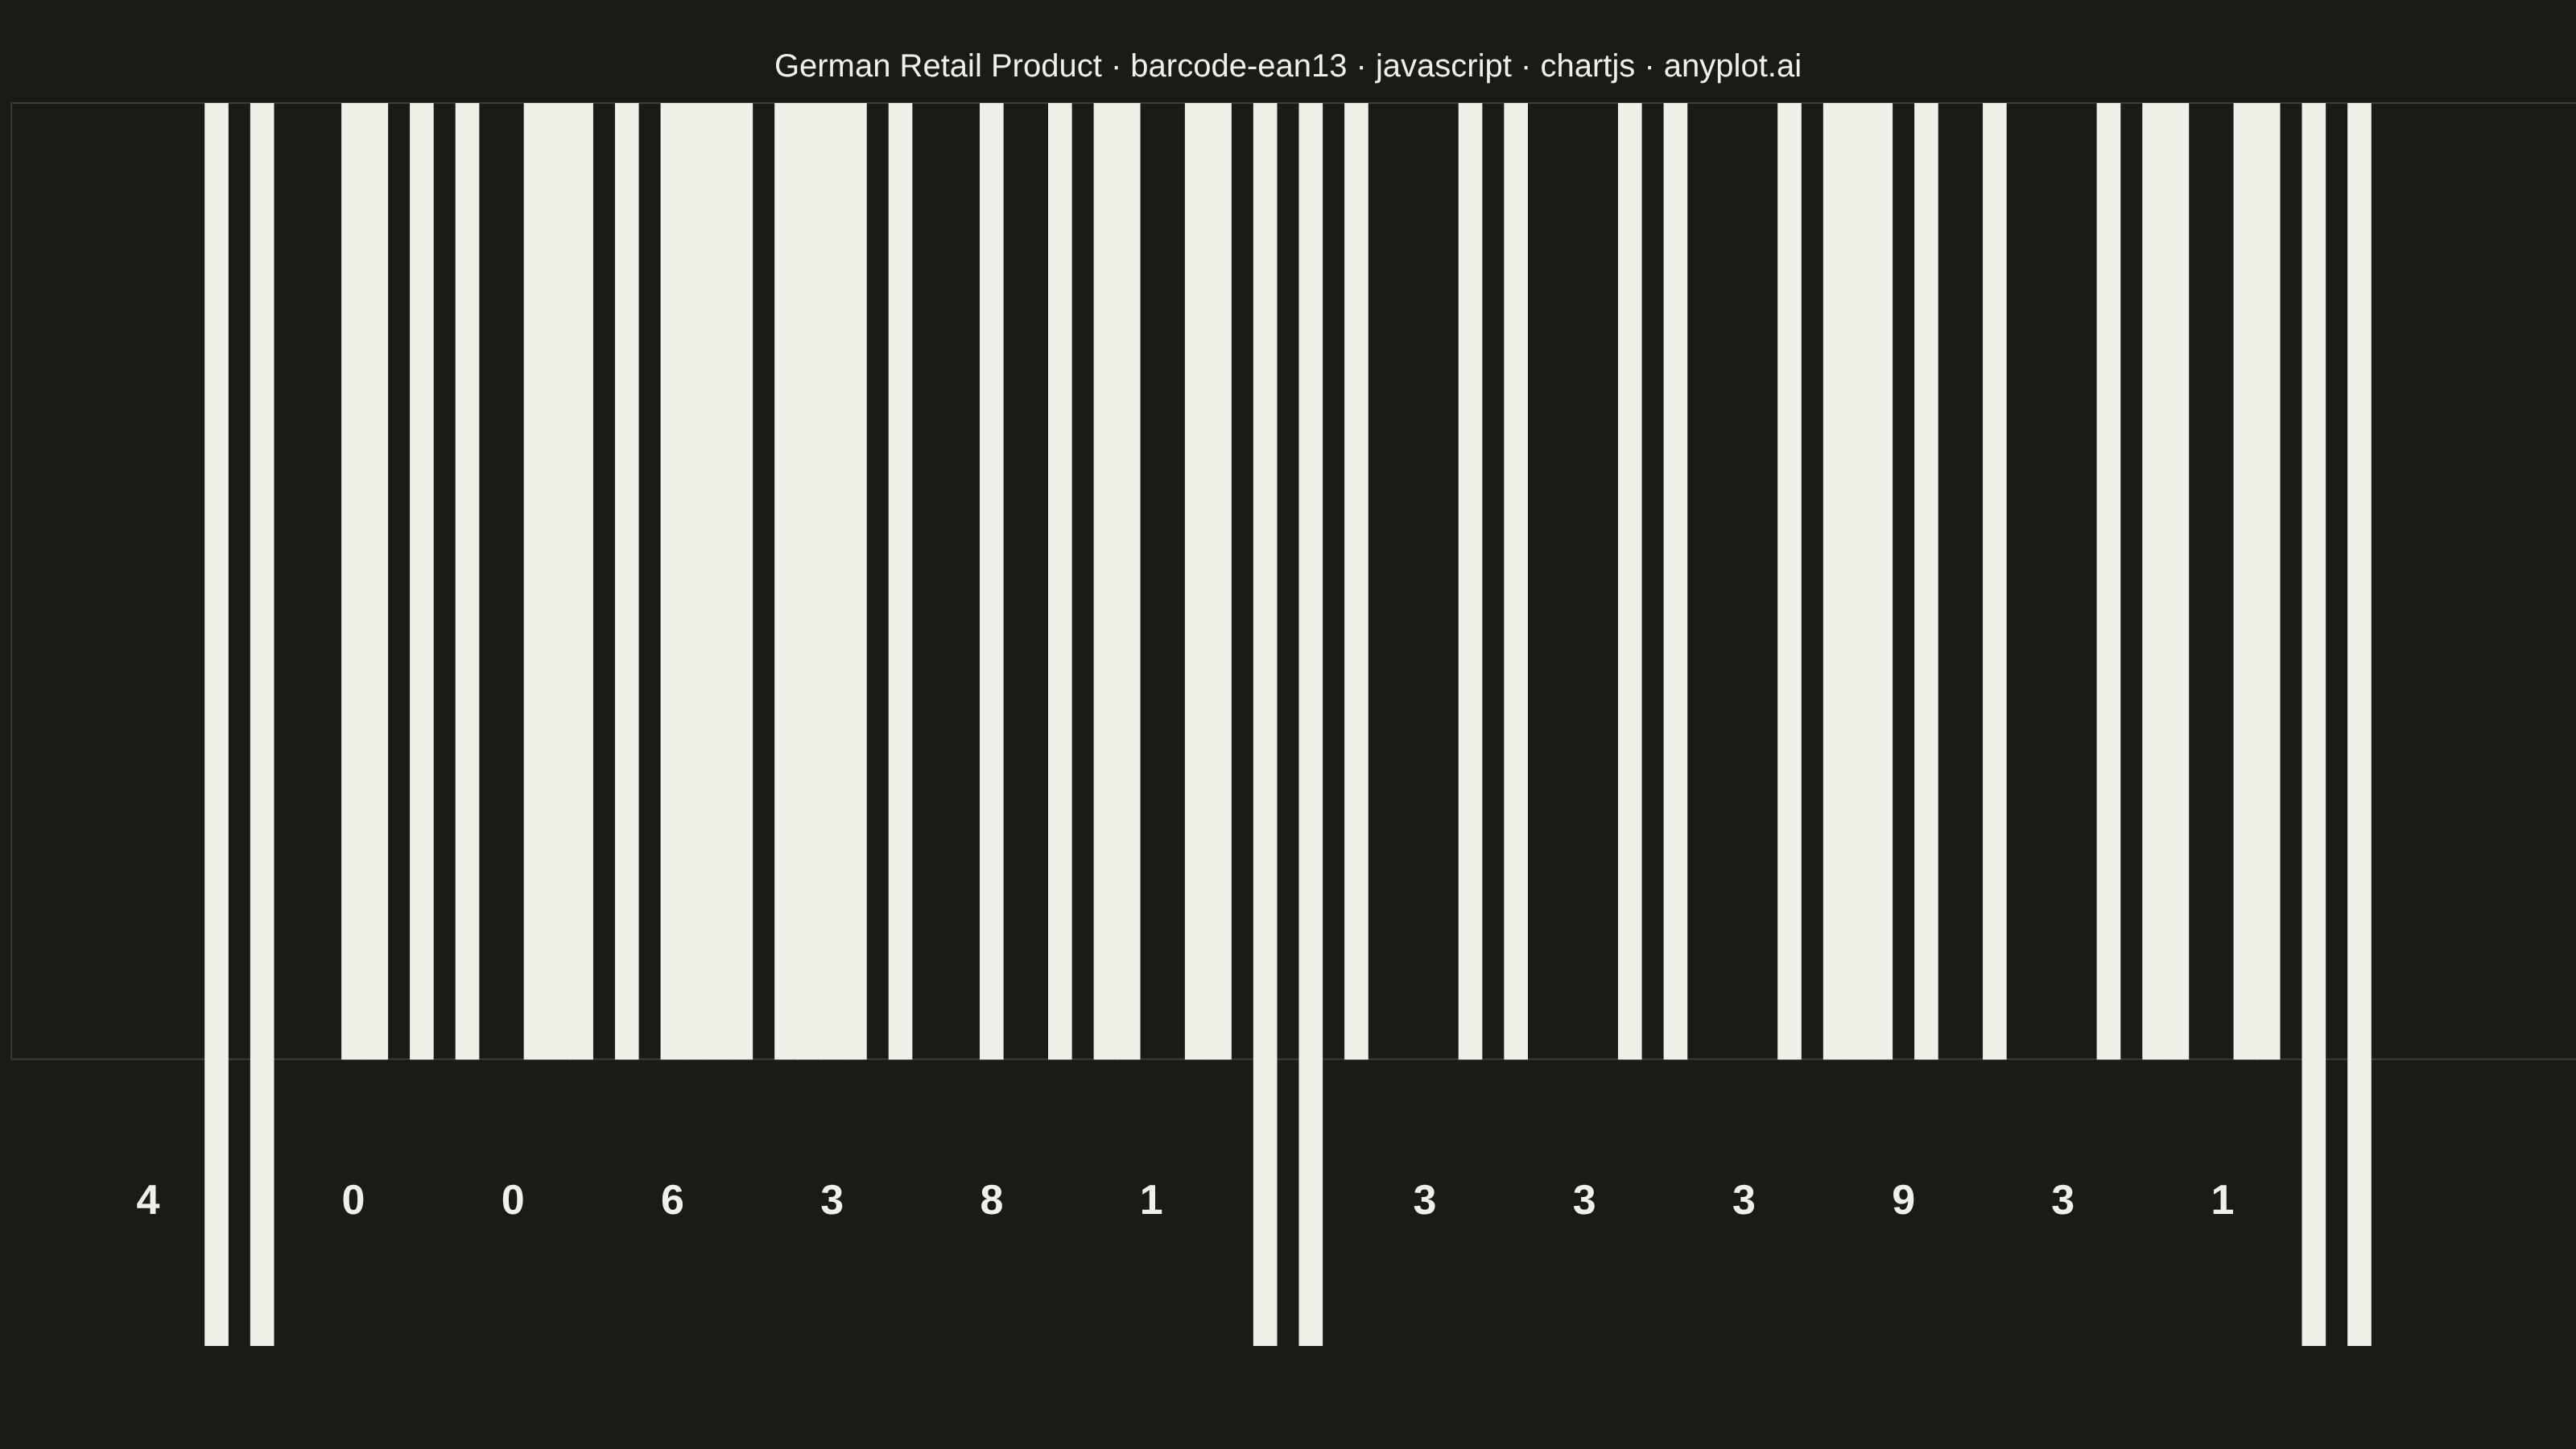
A standard EAN-13 barcode visualization commonly used for retail products worldwide. The plot renders a scannable linear barcode encoding a 13-digit number with proper bar widths, guard patterns, and human-readable digits. This visualization is essential for product identification, inventory management, and point-of-sale systems.
// anyplot.ai
// barcode-ean13: EAN-13 Barcode
// Library: chartjs 4.4.7 | JavaScript 22.23.2
// Quality: 90/100 | Created: 2026-09-01

const t = window.ANYPLOT_TOKENS;

// --- EAN-13 encoding tables (in-memory, deterministic) ----------------------
const L_CODE = ["0001101", "0011001", "0010011", "0111101", "0100011", "0110001", "0101111", "0111011", "0110111", "0001011"];
const G_CODE = ["0100111", "0110011", "0011011", "0100001", "0011101", "0111001", "0000101", "0010001", "0001001", "0010111"];
const R_CODE = ["1110010", "1100110", "1101100", "1000010", "1011100", "1001110", "1010000", "1000100", "1001000", "1110100"];
const PARITY = ["LLLLLL", "LLGLGG", "LLGGLG", "LLGGGL", "LGLLGG", "LGGLLG", "LGGGLL", "LGLGLG", "LGLGGL", "LGGLGL"];

function checkDigit(digits12) {
  let sum = 0;
  for (let i = 0; i < 12; i++) {
    sum += digits12[i] * (i % 2 === 0 ? 1 : 3);
  }
  return (10 - (sum % 10)) % 10;
}

function encodeModules(digits) {
  const parity = PARITY[digits[0]];
  let left = "";
  for (let i = 0; i < 6; i++) {
    const digit = digits[1 + i];
    left += parity[i] === "L" ? L_CODE[digit] : G_CODE[digit];
  }
  let right = "";
  for (let i = 0; i < 6; i++) {
    right += R_CODE[digits[7 + i]];
  }
  return "101" + left + "01010" + right + "101";
}

// German retail product (EAN-13 country prefix 400-440) — 12-digit payload,
// check digit auto-calculated per the spec's "12 or 13 digit" rule.
const payload = [4, 0, 0, 6, 3, 8, 1, 3, 3, 3, 9, 3];
const digits = payload.concat(checkDigit(payload));
const moduleBits = encodeModules(digits);

// --- Module layout -----------------------------------------------------------
// 9-module quiet zones (spec: "at least 9 module widths") + 95 barcode
// modules (3 start guard + 42 left digits + 5 center guard + 42 right
// digits + 3 end guard).
const QUIET_ZONE = 9;
const START_GUARD = 0;
const LEFT_DIGITS = 3;
const CENTER_GUARD = 45;
const RIGHT_DIGITS = 50;
const END_GUARD = 92;
const guardModules = new Set([
  START_GUARD, START_GUARD + 1, START_GUARD + 2,
  CENTER_GUARD, CENTER_GUARD + 1, CENTER_GUARD + 2, CENTER_GUARD + 3, CENTER_GUARD + 4,
  END_GUARD, END_GUARD + 1, END_GUARD + 2,
]);

// Bars use theme-adaptive ink, not the Imprint brand green — a barcode's
// bars are a printed mark (the "Imprint" metaphor itself), not a
// categorical data series, and ink gives the highest contrast for scanning.
const labels = [];
const bars = [];
const colors = [];

for (let i = 0; i < QUIET_ZONE; i++) {
  labels.push(`q${i}`);
  bars.push([0, 1.3]);
  colors.push("transparent");
}
for (let i = 0; i < moduleBits.length; i++) {
  const isBar = moduleBits[i] === "1";
  const isGuard = guardModules.has(i);
  labels.push(`m${i}`);
  bars.push(isBar && isGuard ? [0, 1.3] : [0.3, 1.3]);
  colors.push(isBar ? t.ink : "transparent");
}
for (let i = 0; i < QUIET_ZONE; i++) {
  labels.push(`q${QUIET_ZONE + i}`);
  bars.push([0, 1.3]);
  colors.push("transparent");
}

// --- Mount -------------------------------------------------------------------
const canvas = document.createElement("canvas");
document.getElementById("container").appendChild(canvas);

// --- Chart ---------------------------------------------------------------
// A floating (range) bar per module: guard bars span the full depth [0, 1.3],
// data bars stop at 0.3 to leave the human-readable digit strip below them.
const title = "German Retail Product · barcode-ean13 · javascript · chartjs · anyplot.ai";
const titleFontSize = Math.round(22 * Math.min(1, 67 / title.length));

new Chart(canvas, {
  type: "bar",
  data: {
    labels,
    datasets: [
      {
        data: bars,
        backgroundColor: colors,
        borderWidth: 0,
        categoryPercentage: 1,
        barPercentage: 1,
      },
    ],
  },
  options: {
    responsive: true,
    maintainAspectRatio: false,
    animation: false,
    layout: { padding: { top: 20, bottom: 64 } },
    plugins: {
      title: { display: true, text: title, color: t.ink, font: { size: titleFontSize, weight: "500" } },
      legend: { display: false },
      tooltip: { enabled: false },
    },
    scales: {
      x: { display: false },
      y: { display: false, min: 0, max: 1.3 },
    },
  },
  plugins: [
    {
      id: "ean13Digits",
      afterDraw(chart) {
        const { ctx } = chart;
        const x = chart.scales.x;
        const y = chart.scales.y;
        const moduleWidth = x.getPixelForValue(1) - x.getPixelForValue(0);
        const yLabel = y.getPixelForValue(0.15);

        // Faint quiet-zone frame: a subtle outline around the full symbol
        // (bars + quiet zones), the way a printed barcode label is often
        // bordered. Uses the low-contrast grid token so it reads as a
        // hairline, never competing with the bars' scannable contrast.
        ctx.save();
        ctx.strokeStyle = t.grid;
        ctx.lineWidth = 1;
        ctx.strokeRect(
          x.getPixelForValue(0),
          y.getPixelForValue(1.3),
          x.getPixelForValue(labels.length - 1) + moduleWidth - x.getPixelForValue(0),
          y.getPixelForValue(0.3) - y.getPixelForValue(1.3)
        );
        ctx.restore();

        ctx.save();
        ctx.fillStyle = t.ink;
        ctx.font = "600 26px sans-serif";
        ctx.textAlign = "center";
        ctx.textBaseline = "middle";

        // First digit sits outside the guard, in the left quiet zone.
        const xFirst = x.getPixelForValue(QUIET_ZONE + START_GUARD) - moduleWidth * 3;
        ctx.fillText(String(digits[0]), xFirst, yLabel);

        // Left group: 6 digits under the 42 left-side modules.
        for (let i = 0; i < 6; i++) {
          const idx = QUIET_ZONE + LEFT_DIGITS + i * 7;
          const cx = x.getPixelForValue(idx) + moduleWidth * 3;
          ctx.fillText(String(digits[1 + i]), cx, yLabel);
        }

        // Right group: 6 digits under the 42 right-side modules.
        for (let i = 0; i < 6; i++) {
          const idx = QUIET_ZONE + RIGHT_DIGITS + i * 7;
          const cx = x.getPixelForValue(idx) + moduleWidth * 3;
          ctx.fillText(String(digits[7 + i]), cx, yLabel);
        }

        ctx.restore();
      },
    },
  ],
});
Runnable source as JSON, for any HTTP client: https://api.anyplot.ai/specs/barcode-ean13/chartjs/code. Any spec id and library id listed in llms-full.txt fit the same URL shape; every URL below is complete and callable.
{
  "spec_id": "barcode-ean13",
  "language": "javascript",
  "library": "chartjs",
  "page": "https://anyplot.ai/barcode-ean13/javascript/chartjs",
  "hub": "https://anyplot.ai/barcode-ean13",
  "code_json": "https://api.anyplot.ai/specs/barcode-ean13/chartjs/code",
  "spec_json": "https://api.anyplot.ai/specs/barcode-ean13",
  "render_light_png": "https://storage.googleapis.com/anyplot-images/plots/barcode-ean13/javascript/chartjs/plot-light.png",
  "render_dark_png": "https://storage.googleapis.com/anyplot-images/plots/barcode-ean13/javascript/chartjs/plot-dark.png",
  "interactive_light_html": "https://storage.googleapis.com/anyplot-images/plots/barcode-ean13/javascript/chartjs/plot-light.html",
  "interactive_dark_html": "https://storage.googleapis.com/anyplot-images/plots/barcode-ean13/javascript/chartjs/plot-dark.html",
  "quality_score": 90.0,
  "license": "MIT",
  "guide": "https://anyplot.ai/llms.txt"
}
Part of EAN-13 Barcode on anyplot.ai.