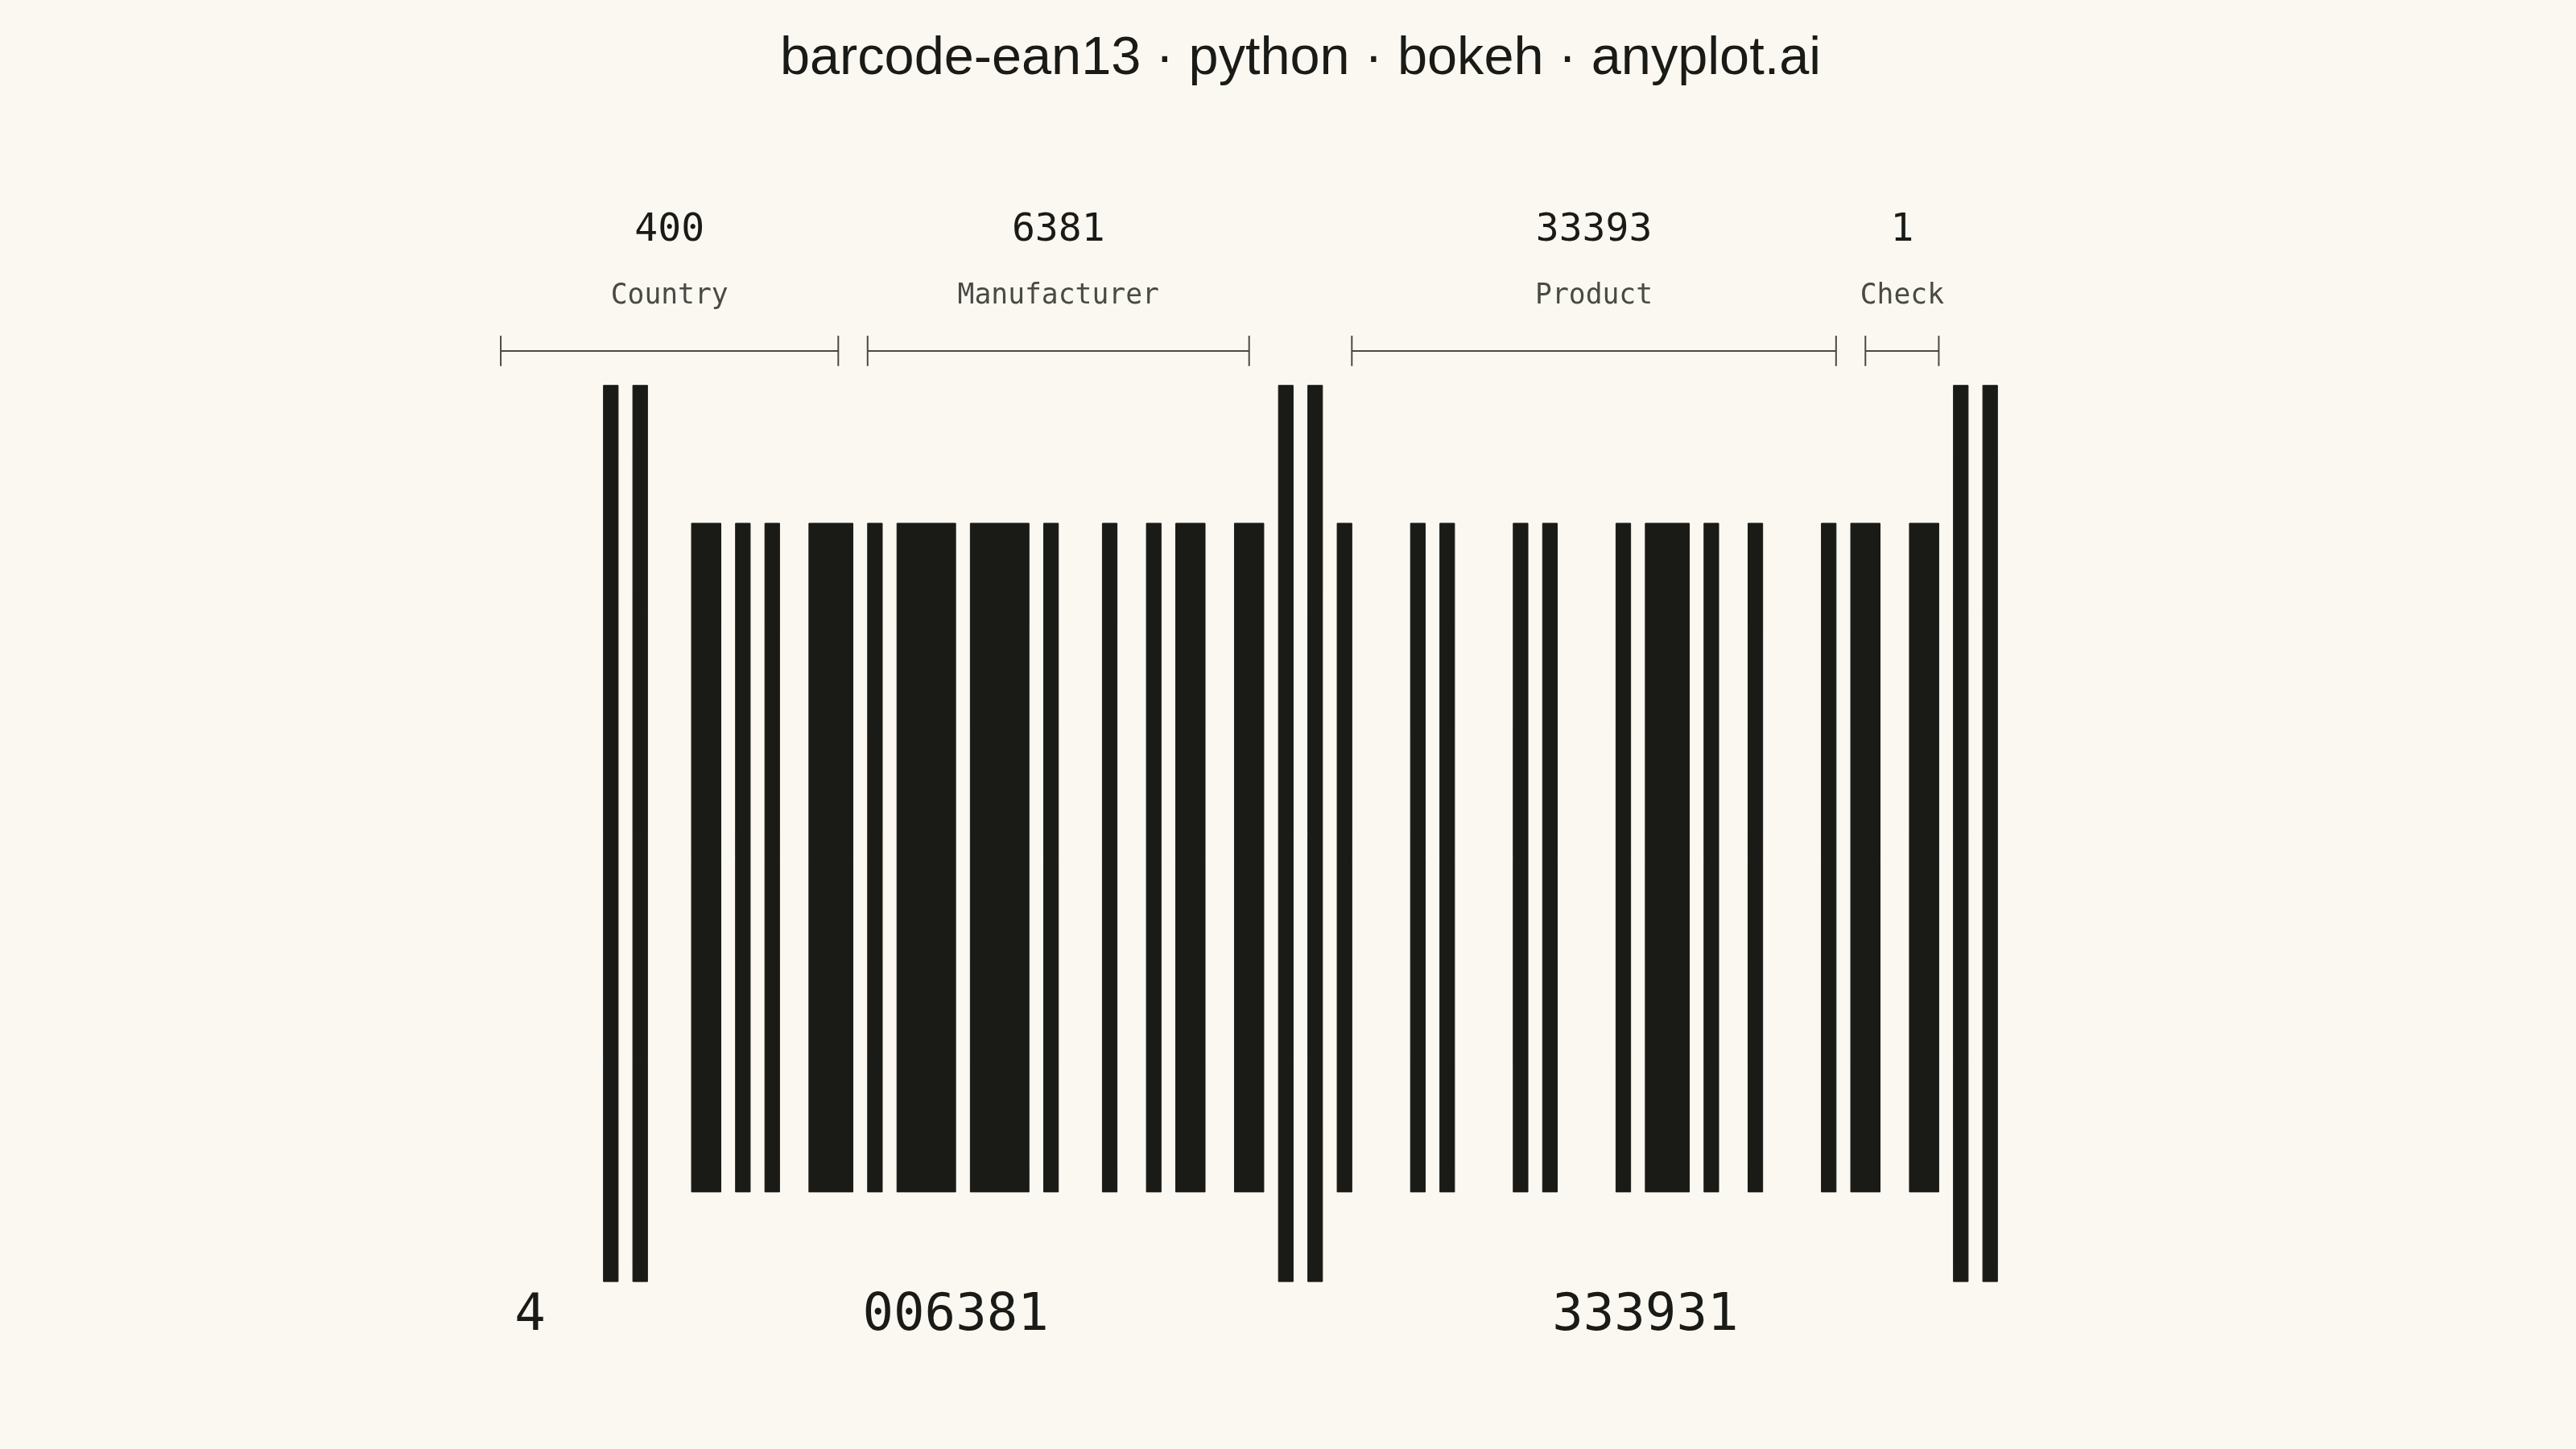
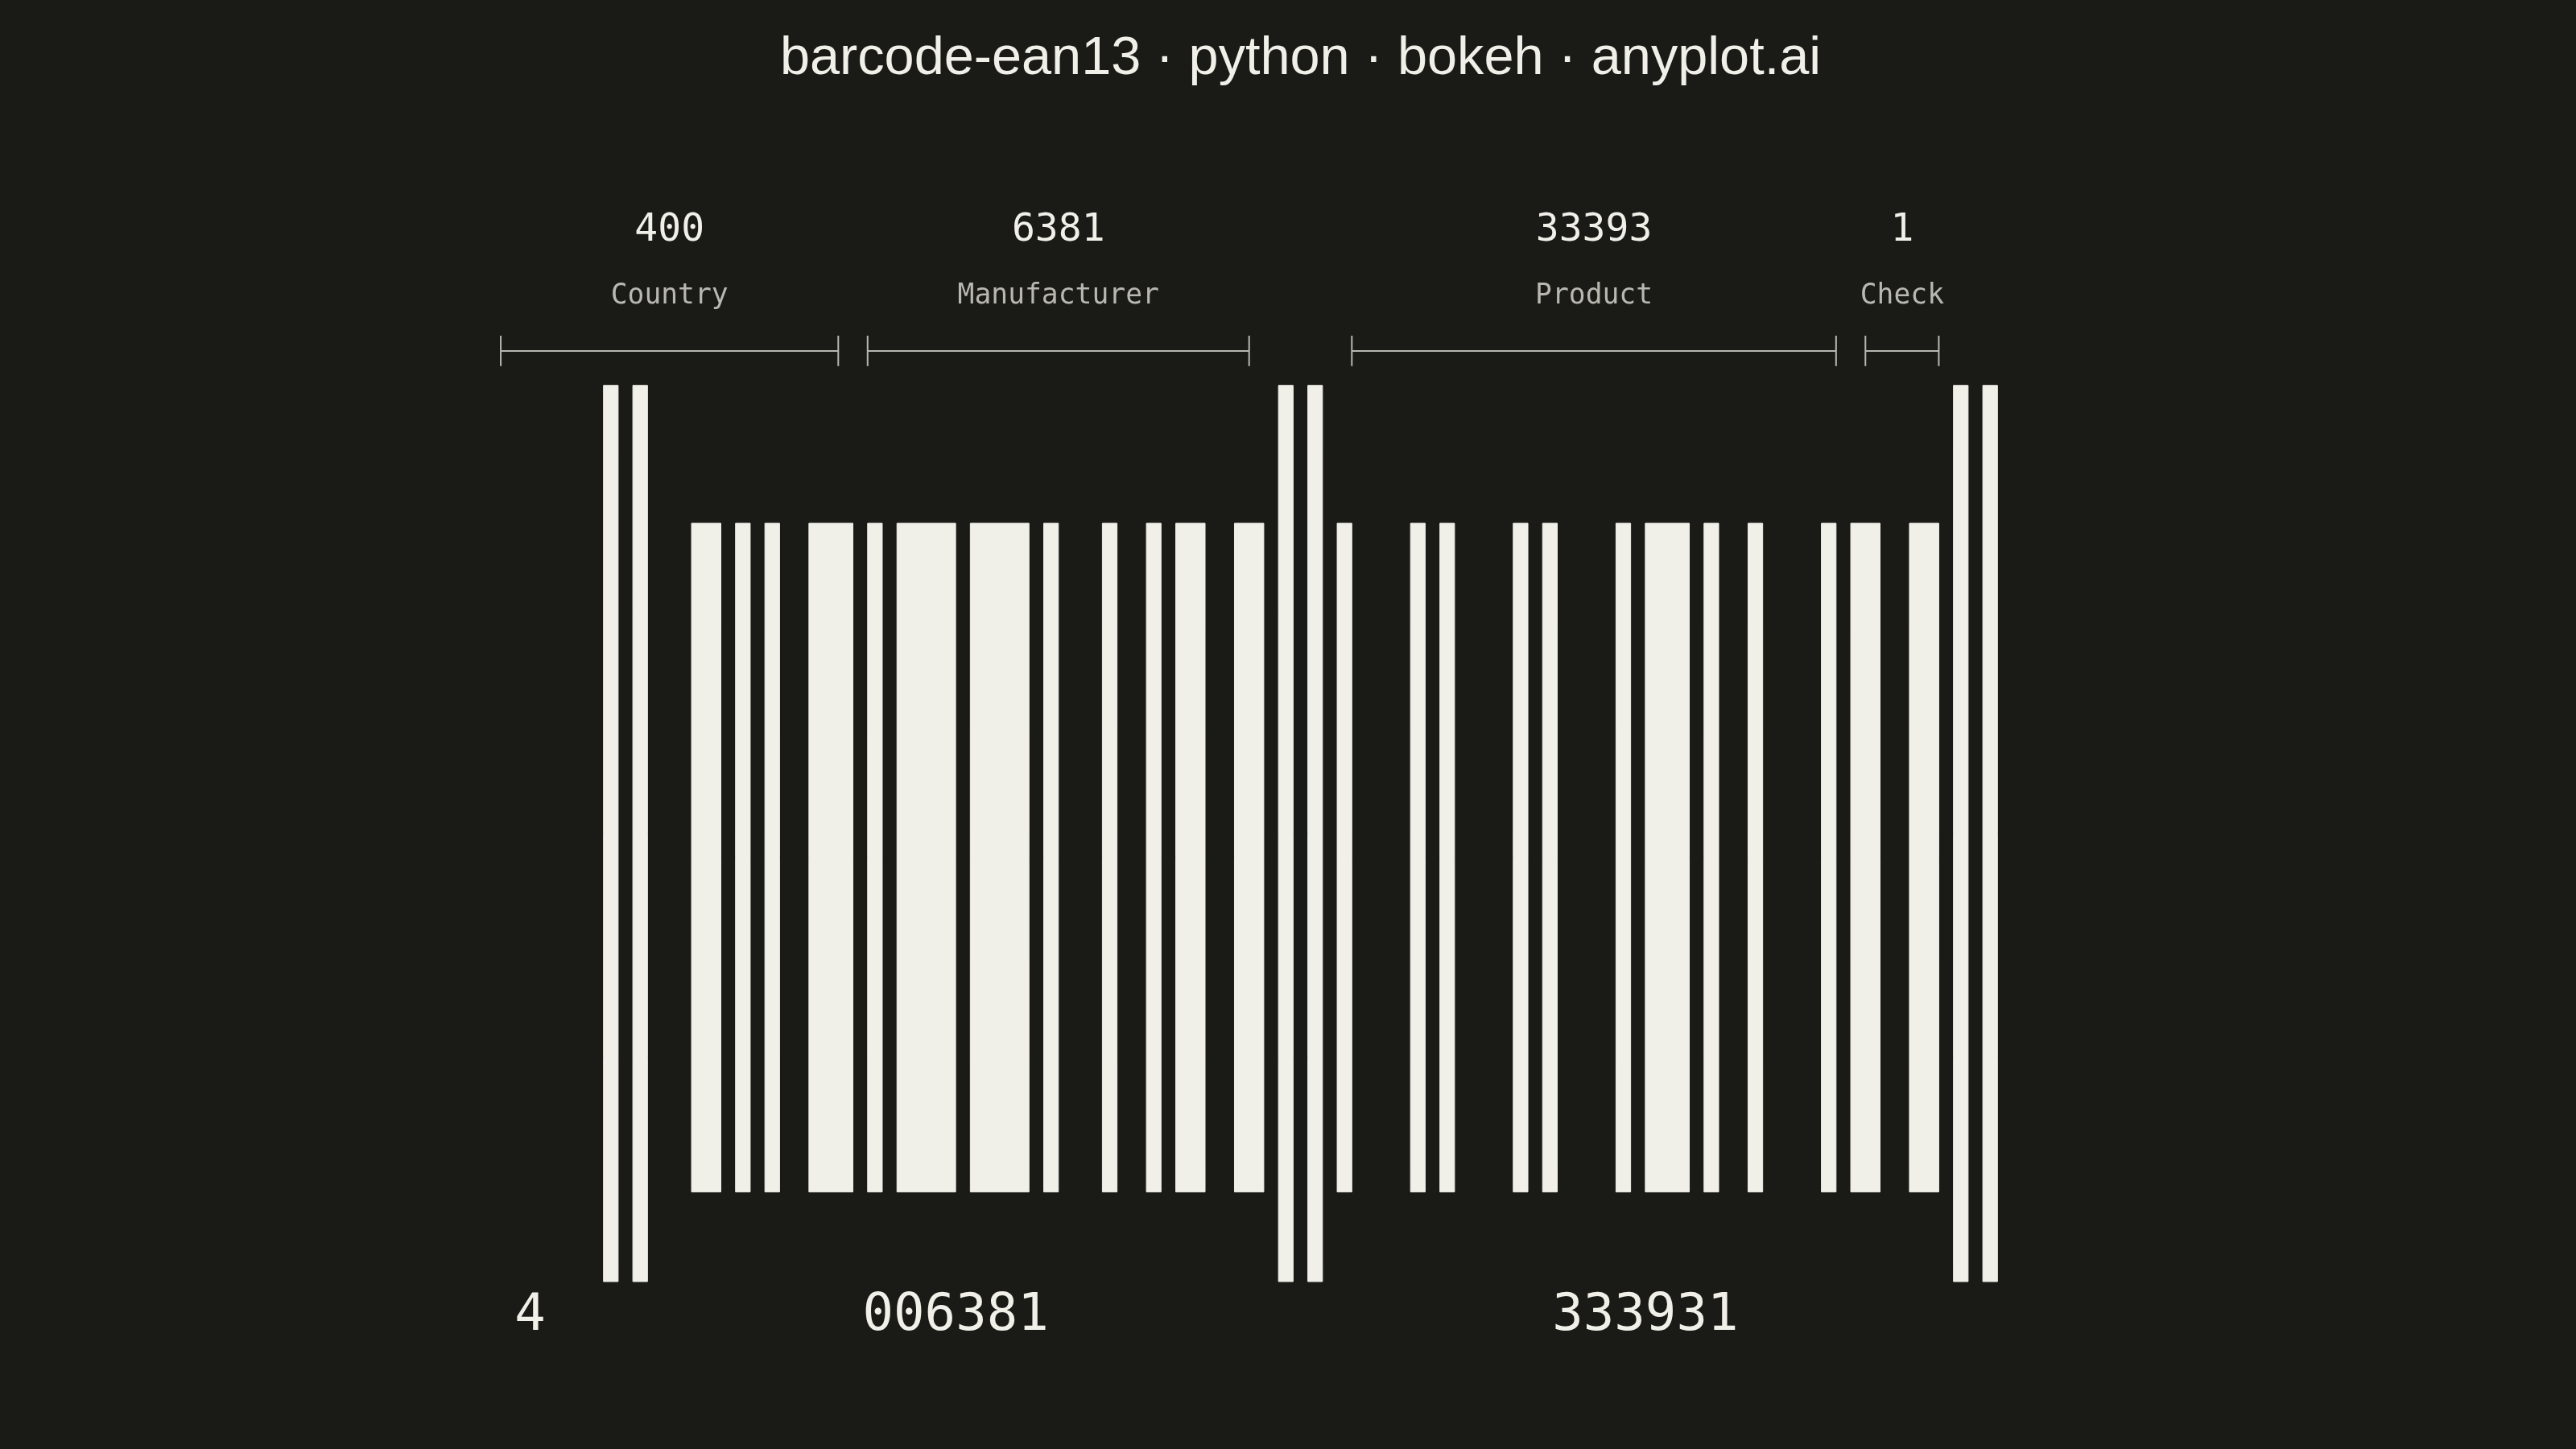
A standard EAN-13 barcode visualization commonly used for retail products worldwide. The plot renders a scannable linear barcode encoding a 13-digit number with proper bar widths, guard patterns, and human-readable digits. This visualization is essential for product identification, inventory management, and point-of-sale systems.
""" anyplot.ai
barcode-ean13: EAN-13 Barcode
Library: bokeh 3.9.0 | Python 3.13.13
Quality: 91/100 | Updated: 2026-05-21
"""

import base64
import os
import sys
import time
from pathlib import Path


# Remove this script's own directory from sys.path so the installed
# bokeh package is found instead of this file (which is also named bokeh.py).
_own_dir = os.path.dirname(os.path.realpath(__file__))
sys.path = [p for p in sys.path if os.path.realpath(p or ".") != _own_dir]

from bokeh.embed import file_html
from bokeh.models import ColumnDataSource, HoverTool, Label
from bokeh.plotting import figure
from bokeh.resources import INLINE
from selenium import webdriver
from selenium.webdriver.chrome.options import Options


THEME = os.getenv("ANYPLOT_THEME", "light")
PAGE_BG = "#FAF8F1" if THEME == "light" else "#1A1A17"
INK = "#1A1A17" if THEME == "light" else "#F0EFE8"
INK_SOFT = "#4A4A44" if THEME == "light" else "#B8B7B0"

# EAN-13 encoding patterns
L_CODES = {
    "0": [0, 0, 0, 1, 1, 0, 1],
    "1": [0, 0, 1, 1, 0, 0, 1],
    "2": [0, 0, 1, 0, 0, 1, 1],
    "3": [0, 1, 1, 1, 1, 0, 1],
    "4": [0, 1, 0, 0, 0, 1, 1],
    "5": [0, 1, 1, 0, 0, 0, 1],
    "6": [0, 1, 0, 1, 1, 1, 1],
    "7": [0, 1, 1, 1, 0, 1, 1],
    "8": [0, 1, 1, 0, 1, 1, 1],
    "9": [0, 0, 0, 1, 0, 1, 1],
}

G_CODES = {
    "0": [0, 1, 0, 0, 1, 1, 1],
    "1": [0, 1, 1, 0, 0, 1, 1],
    "2": [0, 0, 1, 1, 0, 1, 1],
    "3": [0, 1, 0, 0, 0, 0, 1],
    "4": [0, 0, 1, 1, 1, 0, 1],
    "5": [0, 1, 1, 1, 0, 0, 1],
    "6": [0, 0, 0, 0, 1, 0, 1],
    "7": [0, 0, 1, 0, 0, 0, 1],
    "8": [0, 0, 0, 1, 0, 0, 1],
    "9": [0, 0, 1, 0, 1, 1, 1],
}

R_CODES = {
    "0": [1, 1, 1, 0, 0, 1, 0],
    "1": [1, 1, 0, 0, 1, 1, 0],
    "2": [1, 1, 0, 1, 1, 0, 0],
    "3": [1, 0, 0, 0, 0, 1, 0],
    "4": [1, 0, 1, 1, 1, 0, 0],
    "5": [1, 0, 0, 1, 1, 1, 0],
    "6": [1, 0, 1, 0, 0, 0, 0],
    "7": [1, 0, 0, 0, 1, 0, 0],
    "8": [1, 0, 0, 1, 0, 0, 0],
    "9": [1, 1, 1, 0, 1, 0, 0],
}

FIRST_DIGIT_PATTERNS = {
    "0": "LLLLLL",
    "1": "LLGLGG",
    "2": "LLGGLG",
    "3": "LLGGGL",
    "4": "LGLLGG",
    "5": "LGGLLG",
    "6": "LGGGLL",
    "7": "LGLGLG",
    "8": "LGLGGL",
    "9": "LGGLGL",
}

START_GUARD = [1, 0, 1]
CENTER_GUARD = [0, 1, 0, 1, 0]
END_GUARD = [1, 0, 1]

# 12-digit German product code — check digit auto-calculated
code = "400638133393"

total = 0
for pos, digit in enumerate(code):
    if pos % 2 == 0:
        total += int(digit)
    else:
        total += int(digit) * 3
check_digit = (10 - (total % 10)) % 10
code = code + str(check_digit)

# Build barcode bit pattern with section labels for HoverTool
barcode_pattern = []
section_labels = []

for bit in START_GUARD:
    barcode_pattern.append(bit)
    section_labels.append("Start Guard")

lg_pattern = FIRST_DIGIT_PATTERNS[code[0]]
for i, digit in enumerate(code[1:7]):
    label = f"Left digit {i + 1}: '{digit}'"
    if lg_pattern[i] == "L":
        bits = L_CODES[digit]
    else:
        bits = G_CODES[digit]
    for bit in bits:
        barcode_pattern.append(bit)
        section_labels.append(label)

for bit in CENTER_GUARD:
    barcode_pattern.append(bit)
    section_labels.append("Center Guard")

for i, digit in enumerate(code[7:13]):
    label = f"Right digit {i + 1}: '{digit}'"
    for bit in R_CODES[digit]:
        barcode_pattern.append(bit)
        section_labels.append(label)

for bit in END_GUARD:
    barcode_pattern.append(bit)
    section_labels.append("End Guard")

# Canvas dimensions (canonical Bokeh landscape)
W, H = 3200, 1800

# Scale barcode to ~70% of canvas width
quiet_zone_modules = 11
total_modules = quiet_zone_modules + len(barcode_pattern) + quiet_zone_modules
module_width = int(W * 0.70 / total_modules)
quiet_zone = quiet_zone_modules * module_width

# Bar heights in data coordinates
bar_height = 1100
guard_height = 1300
text_y_pos = 80

# Guard bar module index ranges
start_guard_end = 2
center_guard_start = 3 + 6 * 7
center_guard_end = center_guard_start + 4
end_guard_start = center_guard_end + 1 + 6 * 7

bar_lefts = []
bar_widths_px = []
bar_tops = []
bar_bottoms = []
bar_sections = []

x_pos = quiet_zone
module_idx = 0
i = 0

while i < len(barcode_pattern):
    if barcode_pattern[i] == 1:
        bar_start = x_pos
        bar_w = 0
        start_module = module_idx
        sec = section_labels[i]

        while i < len(barcode_pattern) and barcode_pattern[i] == 1:
            bar_w += module_width
            x_pos += module_width
            module_idx += 1
            i += 1

        is_guard = (
            start_module <= start_guard_end
            or center_guard_start <= start_module <= center_guard_end
            or start_module >= end_guard_start
        )

        bar_lefts.append(bar_start)
        bar_widths_px.append(bar_w)
        bar_sections.append(sec)
        if is_guard:
            bar_tops.append(guard_height + 150)
            bar_bottoms.append(150)
        else:
            bar_tops.append(bar_height + 150)
            bar_bottoms.append(280)
    else:
        x_pos += module_width
        module_idx += 1
        i += 1

total_barcode_width = x_pos + quiet_zone
x_offset = (W - total_barcode_width) / 2
bar_lefts = [left + x_offset for left in bar_lefts]
bar_rights = [left + w for left, w in zip(bar_lefts, bar_widths_px, strict=True)]

# Figure — y_range extended to accommodate zone annotations above the barcode
p = figure(
    width=W,
    height=H,
    title="barcode-ean13 · python · bokeh · anyplot.ai",
    x_range=(0, W),
    y_range=(0, guard_height + 580),
    toolbar_location=None,
    min_border_top=110,
    min_border_bottom=80,
    min_border_left=80,
    min_border_right=50,
)

p.background_fill_color = PAGE_BG
p.border_fill_color = PAGE_BG
p.outline_line_color = None

p.title.text_font_size = "50pt"
p.title.align = "center"
p.title.text_color = INK
p.title.text_font_style = "normal"

p.xaxis.visible = False
p.yaxis.visible = False
p.xgrid.visible = False
p.ygrid.visible = False

source = ColumnDataSource(
    data={"left": bar_lefts, "right": bar_rights, "top": bar_tops, "bottom": bar_bottoms, "section": bar_sections}
)

bars = p.quad(left="left", right="right", top="top", bottom="bottom", color=INK, source=source)

# HoverTool reveals which digit or guard section each bar encodes
hover = HoverTool(renderers=[bars], tooltips=[("Encodes", "@section")])
p.add_tools(hover)

# Human-readable digits: first digit outside left guard
first_digit_x = x_offset + quiet_zone - module_width * 5
left_start = x_offset + quiet_zone + 3 * module_width
left_span = 6 * 7 * module_width
right_start = left_start + left_span + 5 * module_width
right_span = 6 * 7 * module_width

p.add_layout(
    Label(
        x=first_digit_x,
        y=text_y_pos,
        text=code[0],
        text_font_size="48pt",
        text_align="center",
        text_baseline="bottom",
        text_color=INK,
        text_font="monospace",
    )
)

p.add_layout(
    Label(
        x=left_start + left_span / 2,
        y=text_y_pos,
        text=code[1:7],
        text_font_size="48pt",
        text_align="center",
        text_baseline="bottom",
        text_color=INK,
        text_font="monospace",
    )
)

p.add_layout(
    Label(
        x=right_start + right_span / 2,
        y=text_y_pos,
        text=code[7:13],
        text_font_size="48pt",
        text_align="center",
        text_baseline="bottom",
        text_color=INK,
        text_font="monospace",
    )
)

# Zone annotations: bracket lines + labels above the barcode showing structure
# EAN-13 structure: Country (400) | Manufacturer (6381) | Product (33393) | Check (1)
zone_line_y = guard_height + 200  # just above guard bar tops
zone_name_y = zone_line_y + 60  # zone name text y
zone_val_y = zone_line_y + 160  # zone digit value y

country_x1 = first_digit_x - module_width * 3
country_x2 = left_start + 2 * 7 * module_width
mfr_x1 = country_x2
mfr_x2 = left_start + left_span
prod_x1 = right_start
prod_x2 = right_start + 5 * 7 * module_width
check_x1 = prod_x2
check_x2 = right_start + right_span

zones = [
    (country_x1, country_x2, "Country", code[:3]),
    (mfr_x1, mfr_x2, "Manufacturer", code[3:7]),
    (prod_x1, prod_x2, "Product", code[7:12]),
    (check_x1, check_x2, "Check", code[12]),
]

for x1, x2, zone_name, zone_val in zones:
    cx = (x1 + x2) / 2
    pad = module_width
    # Horizontal bracket line
    p.segment(x0=[x1 + pad], y0=[zone_line_y], x1=[x2 - pad], y1=[zone_line_y], line_color=INK_SOFT, line_width=2)
    # Vertical end ticks
    p.segment(
        x0=[x1 + pad], y0=[zone_line_y - 22], x1=[x1 + pad], y1=[zone_line_y + 22], line_color=INK_SOFT, line_width=2
    )
    p.segment(
        x0=[x2 - pad], y0=[zone_line_y - 22], x1=[x2 - pad], y1=[zone_line_y + 22], line_color=INK_SOFT, line_width=2
    )
    # Zone name
    p.add_layout(
        Label(
            x=cx,
            y=zone_name_y,
            text=zone_name,
            text_align="center",
            text_baseline="bottom",
            text_color=INK_SOFT,
            text_font_size="26pt",
            text_font="monospace",
        )
    )
    # Zone digit value
    p.add_layout(
        Label(
            x=cx,
            y=zone_val_y,
            text=zone_val,
            text_align="center",
            text_baseline="bottom",
            text_color=INK,
            text_font_size="36pt",
            text_font="monospace",
        )
    )

# Save interactive HTML with inline resources (no CDN dependency)
html_path = Path(f"plot-{THEME}.html").resolve()
html_content = file_html(p, INLINE)
# Inject body background + CSS to eliminate any canvas/border artifacts.
# The body background fix prevents browser-default white from bleeding through
# as a thin border in the dark theme; the CSS removes Bokeh canvas box-shadow.
html_content = html_content.replace("<body>", f'<body style="background-color:{PAGE_BG};margin:0;padding:0;">', 1)
# Set html element background + remove any canvas/div borders/shadows.
# html{} is needed because Chrome uses the html element's background to fill
# the viewport even outside the body, causing 1-px edge artifacts in headless.
html_content = html_content.replace(
    "</head>",
    (
        f"<style>"
        f"html{{background-color:{PAGE_BG}!important;margin:0!important;padding:0!important;}}"
        f"canvas,div.bk-root,div.bk{{border:none!important;box-shadow:none!important;outline:none!important;}}"
        f"</style></head>"
    ),
    1,
)
html_path.write_text(html_content)

# Screenshot with headless Chrome via Selenium + CDP for exact W×H dimensions
opts = Options()
for arg in (
    "--headless=new",
    "--no-sandbox",
    "--disable-dev-shm-usage",
    "--disable-gpu",
    f"--window-size={W},{H}",
    "--hide-scrollbars",
):
    opts.add_argument(arg)
driver = webdriver.Chrome(options=opts)
driver.set_window_size(W, H)
driver.get(f"file://{html_path}")
time.sleep(3)
result = driver.execute_cdp_cmd(
    "Page.captureScreenshot",
    {"format": "png", "captureBeyondViewport": True, "clip": {"x": 0, "y": 0, "width": W, "height": H, "scale": 1.0}},
)
Path(f"plot-{THEME}.png").write_bytes(base64.b64decode(result["data"]))
driver.quit()
Runnable source as JSON, for any HTTP client: https://api.anyplot.ai/specs/barcode-ean13/bokeh/code. Any spec id and library id listed in llms-full.txt fit the same URL shape; every URL below is complete and callable.
{
  "spec_id": "barcode-ean13",
  "language": "python",
  "library": "bokeh",
  "page": "https://anyplot.ai/barcode-ean13/python/bokeh",
  "hub": "https://anyplot.ai/barcode-ean13",
  "code_json": "https://api.anyplot.ai/specs/barcode-ean13/bokeh/code",
  "spec_json": "https://api.anyplot.ai/specs/barcode-ean13",
  "render_light_png": "https://storage.googleapis.com/anyplot-images/plots/barcode-ean13/python/bokeh/plot-light.png",
  "render_dark_png": "https://storage.googleapis.com/anyplot-images/plots/barcode-ean13/python/bokeh/plot-dark.png",
  "interactive_light_html": "https://storage.googleapis.com/anyplot-images/plots/barcode-ean13/python/bokeh/plot-light.html",
  "interactive_dark_html": "https://storage.googleapis.com/anyplot-images/plots/barcode-ean13/python/bokeh/plot-dark.html",
  "quality_score": 91.0,
  "license": "MIT",
  "guide": "https://anyplot.ai/llms.txt"
}
Part of EAN-13 Barcode on anyplot.ai.