The same plot in 14 other libraries — Python: Altair, Bokeh, lets-plot, Matplotlib, Plotly, plotnine, Pygal, Seaborn; Julia: Makie.jl; JavaScript: Chart.js, D3.js, Apache ECharts, Highcharts, MUI X Charts. Compare all 15 side by side: EAN-13 Barcode in Python, R, Julia and JavaScript.
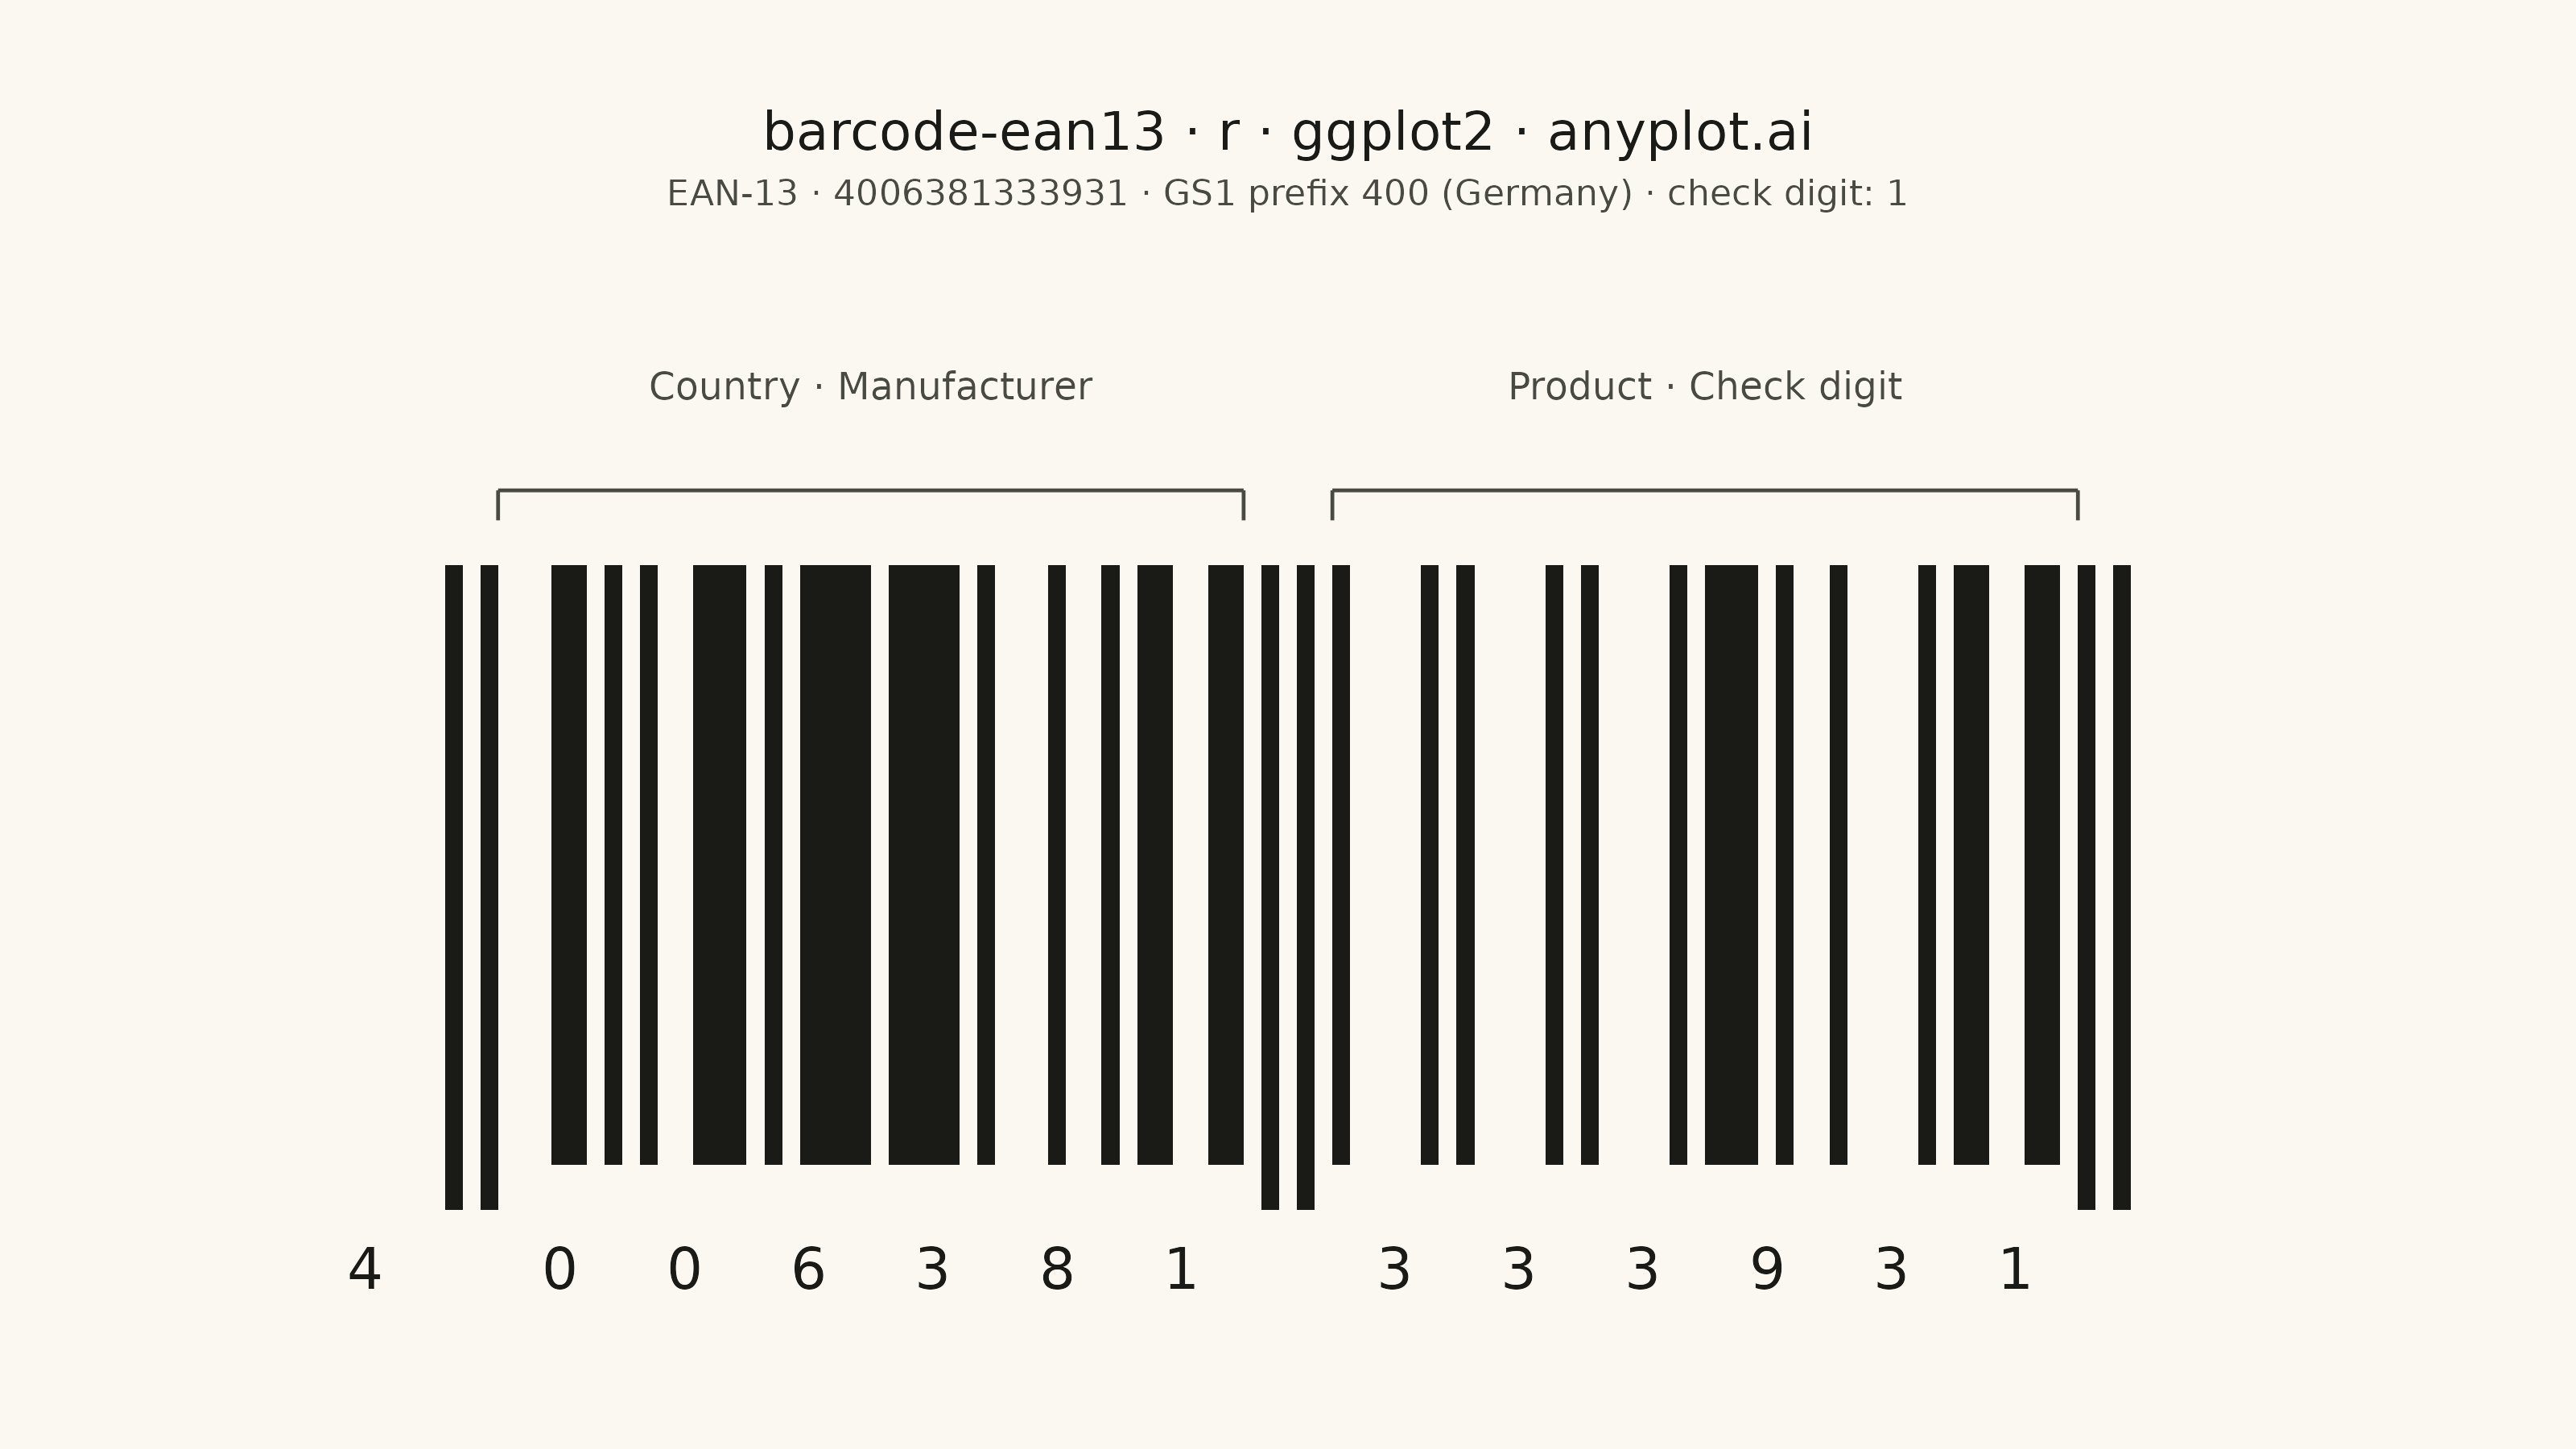
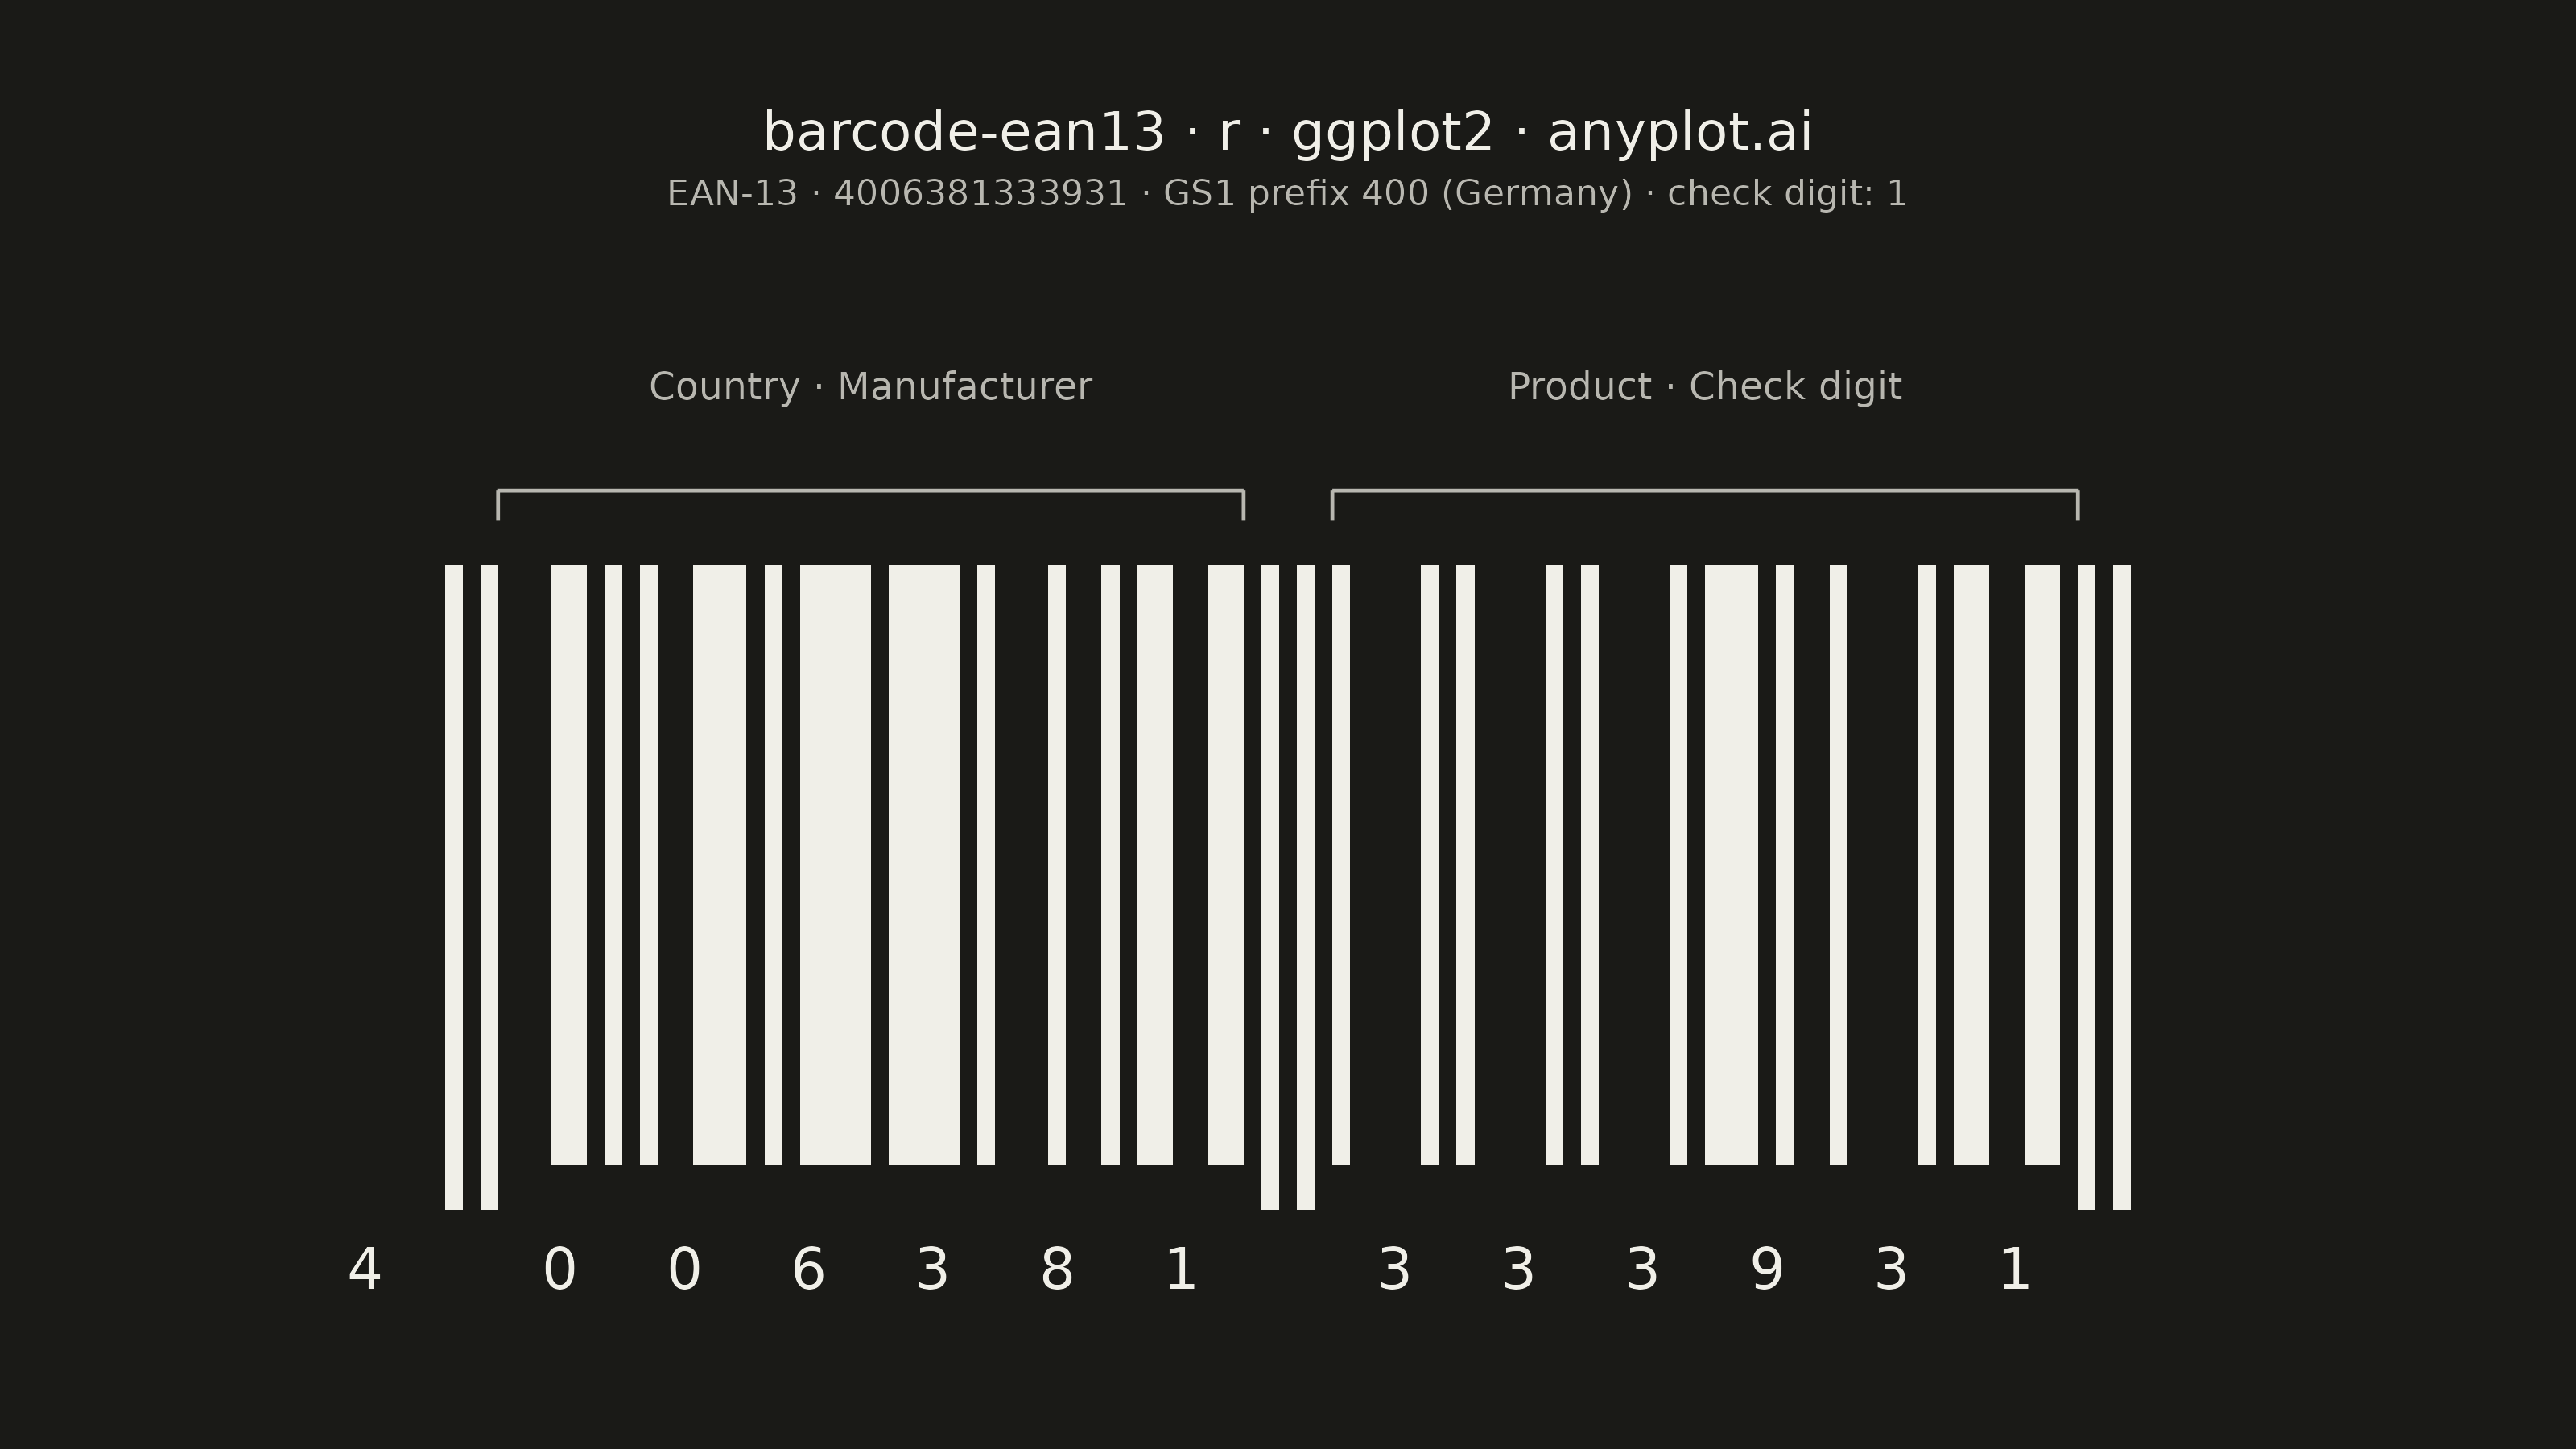
A standard EAN-13 barcode visualization commonly used for retail products worldwide. The plot renders a scannable linear barcode encoding a 13-digit number with proper bar widths, guard patterns, and human-readable digits. This visualization is essential for product identification, inventory management, and point-of-sale systems.
#' anyplot.ai
#' barcode-ean13: EAN-13 Barcode
#' Library: ggplot2 3.5.1 | R 4.4.1
#' Quality: 88/100 | Created: 2026-05-21

library(ggplot2)
library(ragg)

THEME    <- Sys.getenv("ANYPLOT_THEME", "light")
PAGE_BG  <- if (THEME == "light") "#FAF8F1" else "#1A1A17"
INK      <- if (THEME == "light") "#1A1A17" else "#F0EFE8"
INK_SOFT <- if (THEME == "light") "#4A4A44" else "#B8B7B0"

# EAN-13 encoding tables
L_CODES <- list(
    "0" = c(0,0,0,1,1,0,1), "1" = c(0,0,1,1,0,0,1),
    "2" = c(0,0,1,0,0,1,1), "3" = c(0,1,1,1,1,0,1),
    "4" = c(0,1,0,0,0,1,1), "5" = c(0,1,1,0,0,0,1),
    "6" = c(0,1,0,1,1,1,1), "7" = c(0,1,1,1,0,1,1),
    "8" = c(0,1,1,0,1,1,1), "9" = c(0,0,0,1,0,1,1)
)
G_CODES <- list(
    "0" = c(0,1,0,0,1,1,1), "1" = c(0,1,1,0,0,1,1),
    "2" = c(0,0,1,1,0,1,1), "3" = c(0,1,0,0,0,0,1),
    "4" = c(0,0,1,1,1,0,1), "5" = c(0,1,1,1,0,0,1),
    "6" = c(0,0,0,0,1,0,1), "7" = c(0,0,1,0,0,0,1),
    "8" = c(0,0,0,1,0,0,1), "9" = c(0,0,1,0,1,1,1)
)
R_CODES <- list(
    "0" = c(1,1,1,0,0,1,0), "1" = c(1,1,0,0,1,1,0),
    "2" = c(1,1,0,1,1,0,0), "3" = c(1,0,0,0,0,1,0),
    "4" = c(1,0,1,1,1,0,0), "5" = c(1,0,0,1,1,1,0),
    "6" = c(1,0,1,0,0,0,0), "7" = c(1,0,0,0,1,0,0),
    "8" = c(1,0,0,1,0,0,0), "9" = c(1,1,1,0,1,0,0)
)
# Parity pattern per first digit: 0 = L-code, 1 = G-code
PARITY <- list(
    "0" = c(0,0,0,0,0,0), "1" = c(0,0,1,0,1,1),
    "2" = c(0,0,1,1,0,1), "3" = c(0,0,1,1,1,0),
    "4" = c(0,1,0,0,1,1), "5" = c(0,1,1,0,0,1),
    "6" = c(0,1,1,1,0,0), "7" = c(0,1,0,1,0,1),
    "8" = c(0,1,0,1,1,0), "9" = c(0,1,1,0,1,0)
)

# Build 95-module EAN-13 bitstream; appends check digit when 12 digits supplied
build_ean13 <- function(code) {
    d <- as.integer(strsplit(code, "")[[1]])
    if (length(d) == 12L) {
        s <- sum(d[c(1,3,5,7,9,11)]) + 3L * sum(d[c(2,4,6,8,10,12)])
        d <- c(d, (10L - s %% 10L) %% 10L)
    }
    par  <- PARITY[[as.character(d[1])]]
    bits <- c(1L, 0L, 1L)                            # start guard (101)
    for (i in seq_len(6L)) {
        ch   <- as.character(d[i + 1L])
        bits <- c(bits, if (par[i] == 0L) L_CODES[[ch]] else G_CODES[[ch]])
    }
    bits <- c(bits, 0L, 1L, 0L, 1L, 0L)              # center guard (01010)
    for (i in seq_len(6L)) {
        bits <- c(bits, R_CODES[[as.character(d[i + 7L])]])
    }
    list(bits = c(bits, 1L, 0L, 1L), digits = d)     # end guard (101)
}

# --- Data ---
result <- build_ean13("4006381333931")   # German product (Leifheit AG)
bits   <- result$bits                    # 95 modules
digits <- result$digits                  # 13 digits [4,0,0,6,3,8,1,3,3,3,9,3,1]

quiet     <- 9L    # quiet-zone modules each side (EAN-13 spec minimum)
bar_h     <- 40    # bar height in module units
guard_ext <- 3     # guard bar descender below y = 0

guard_idx <- c(0L:2L, 45L:49L, 92L:94L)
bar_pos   <- which(bits == 1L) - 1L          # 0-indexed positions
is_guard  <- bar_pos %in% guard_idx

bar_df <- data.frame(
    xmin = quiet + bar_pos,
    xmax = quiet + bar_pos + 1L,
    ymin = ifelse(is_guard, -guard_ext, 0),
    ymax = bar_h
)

total_w <- quiet + 95L + quiet   # 113 modules total

# Human-readable digit x-coordinates (module units)
x_first <- quiet / 2                                    # first digit outside left guard
x_left  <- quiet + 3L + (0L:5L) * 7L + 3.5            # left group: 6 digits
x_right <- quiet + 3L + 42L + 5L + (0L:5L) * 7L + 3.5 # right group: 6 digits

digit_df <- data.frame(
    x     = c(x_first, x_left, x_right),
    y     = rep(-guard_ext - 2.5, 13L),
    label = as.character(digits)
)

# Structural bracket geometry (module-unit coordinates)
# Left group  occupies bits  3–44 → x = quiet+3 to quiet+45 = 12…54
# Right group occupies bits 50–91 → x = quiet+50 to quiet+92 = 59…101
left_x1  <- quiet + 3L;  left_x2  <- quiet + 45L   # 12, 54
right_x1 <- quiet + 50L; right_x2 <- quiet + 92L   # 59, 101
brk_y    <- bar_h + 5                               # bracket line y
lbl_y    <- bar_h + 12                              # label y (above bracket)
tick_h   <- 2                                       # bracket tick descent

# --- Plot ---
p <- ggplot() +
    # Barcode bars
    geom_rect(
        data = bar_df,
        aes(xmin = xmin, xmax = xmax, ymin = ymin, ymax = ymax),
        fill = INK, color = NA
    ) +
    # Human-readable digits (increased size for readability at mobile widths)
    geom_text(
        data = digit_df,
        aes(x = x, y = y, label = label),
        color = INK, size = 4.5, vjust = 1, family = "sans"
    ) +
    # Left group bracket: horizontal bar + end ticks
    annotate("segment",
             x = left_x1, xend = left_x2, y = brk_y, yend = brk_y,
             color = INK_SOFT, linewidth = 0.4) +
    annotate("segment",
             x = left_x1, xend = left_x1, y = brk_y - tick_h, yend = brk_y,
             color = INK_SOFT, linewidth = 0.4) +
    annotate("segment",
             x = left_x2, xend = left_x2, y = brk_y - tick_h, yend = brk_y,
             color = INK_SOFT, linewidth = 0.4) +
    annotate("text",
             x = (left_x1 + left_x2) / 2, y = lbl_y,
             label = "Country · Manufacturer",
             color = INK_SOFT, size = 3.0, hjust = 0.5, family = "sans") +
    # Right group bracket: horizontal bar + end ticks
    annotate("segment",
             x = right_x1, xend = right_x2, y = brk_y, yend = brk_y,
             color = INK_SOFT, linewidth = 0.4) +
    annotate("segment",
             x = right_x1, xend = right_x1, y = brk_y - tick_h, yend = brk_y,
             color = INK_SOFT, linewidth = 0.4) +
    annotate("segment",
             x = right_x2, xend = right_x2, y = brk_y - tick_h, yend = brk_y,
             color = INK_SOFT, linewidth = 0.4) +
    annotate("text",
             x = (right_x1 + right_x2) / 2, y = lbl_y,
             label = "Product · Check digit",
             color = INK_SOFT, size = 3.0, hjust = 0.5, family = "sans") +
    scale_x_continuous(limits = c(0, total_w), expand = expansion(add = c(1, 1))) +
    scale_y_continuous(limits = c(-guard_ext - 13, bar_h + 20), expand = c(0, 0)) +
    labs(
        title    = "barcode-ean13 · r · ggplot2 · anyplot.ai",
        subtitle = "EAN-13 · 4006381333931 · GS1 prefix 400 (Germany) · check digit: 1"
    ) +
    theme_void() +
    theme(
        plot.background  = element_rect(fill = PAGE_BG, color = PAGE_BG),
        panel.background = element_rect(fill = PAGE_BG, color = NA),
        plot.title       = element_text(
            color = INK, size = 12, hjust = 0.5,
            margin = margin(t = 15, b = 4)
        ),
        plot.subtitle    = element_text(
            color = INK_SOFT, size = 8, hjust = 0.5,
            margin = margin(b = 12)
        ),
        plot.margin = margin(10, 60, 10, 60)
    )

# --- Save ---
ggsave(
    filename = sprintf("plot-%s.png", THEME),
    plot     = p,
    device   = ragg::agg_png,
    width    = 8,
    height   = 4.5,
    units    = "in",
    dpi      = 400
)
Runnable source as JSON, for any HTTP client: https://api.anyplot.ai/specs/barcode-ean13/ggplot2/code. Any spec id and library id listed in llms-full.txt fit the same URL shape; every URL below is complete and callable.
{
  "spec_id": "barcode-ean13",
  "language": "r",
  "library": "ggplot2",
  "page": "https://anyplot.ai/barcode-ean13/r/ggplot2",
  "hub": "https://anyplot.ai/barcode-ean13",
  "code_json": "https://api.anyplot.ai/specs/barcode-ean13/ggplot2/code",
  "spec_json": "https://api.anyplot.ai/specs/barcode-ean13",
  "render_light_png": "https://storage.googleapis.com/anyplot-images/plots/barcode-ean13/r/ggplot2/plot-light.png",
  "render_dark_png": "https://storage.googleapis.com/anyplot-images/plots/barcode-ean13/r/ggplot2/plot-dark.png",
  "quality_score": 88.0,
  "license": "MIT",
  "guide": "https://anyplot.ai/llms.txt"
}
Part of EAN-13 Barcode on anyplot.ai.