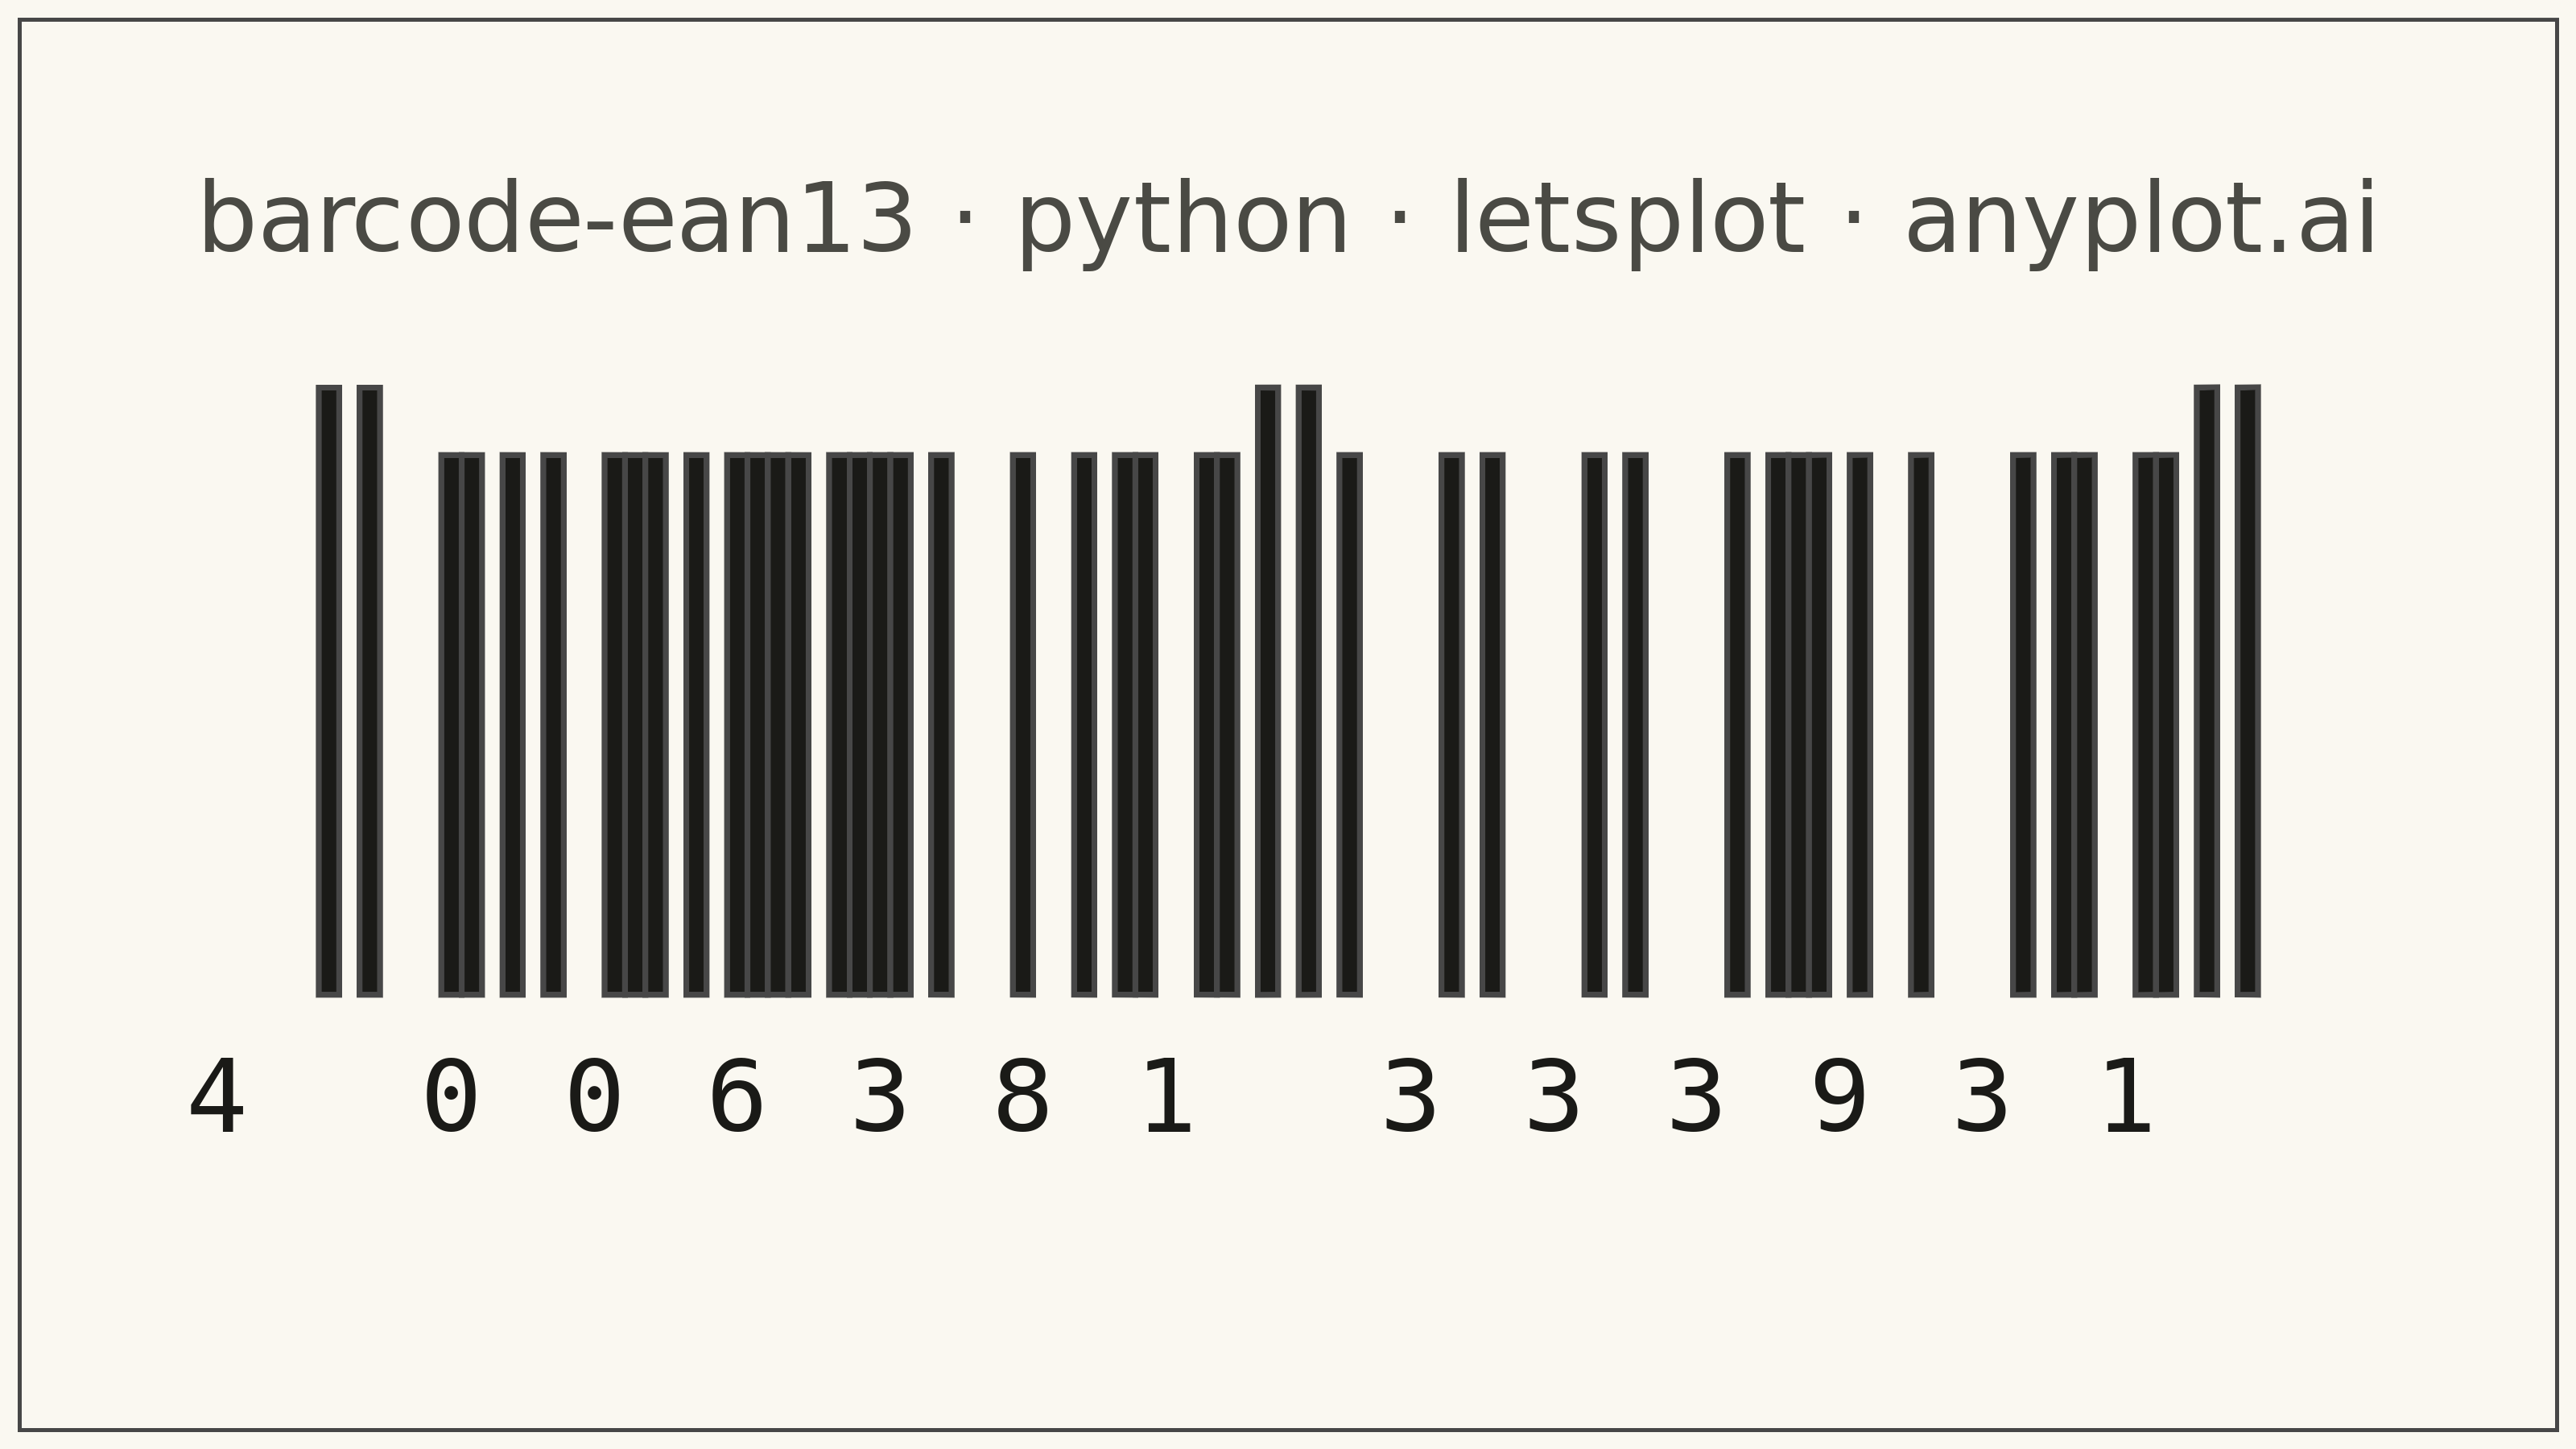
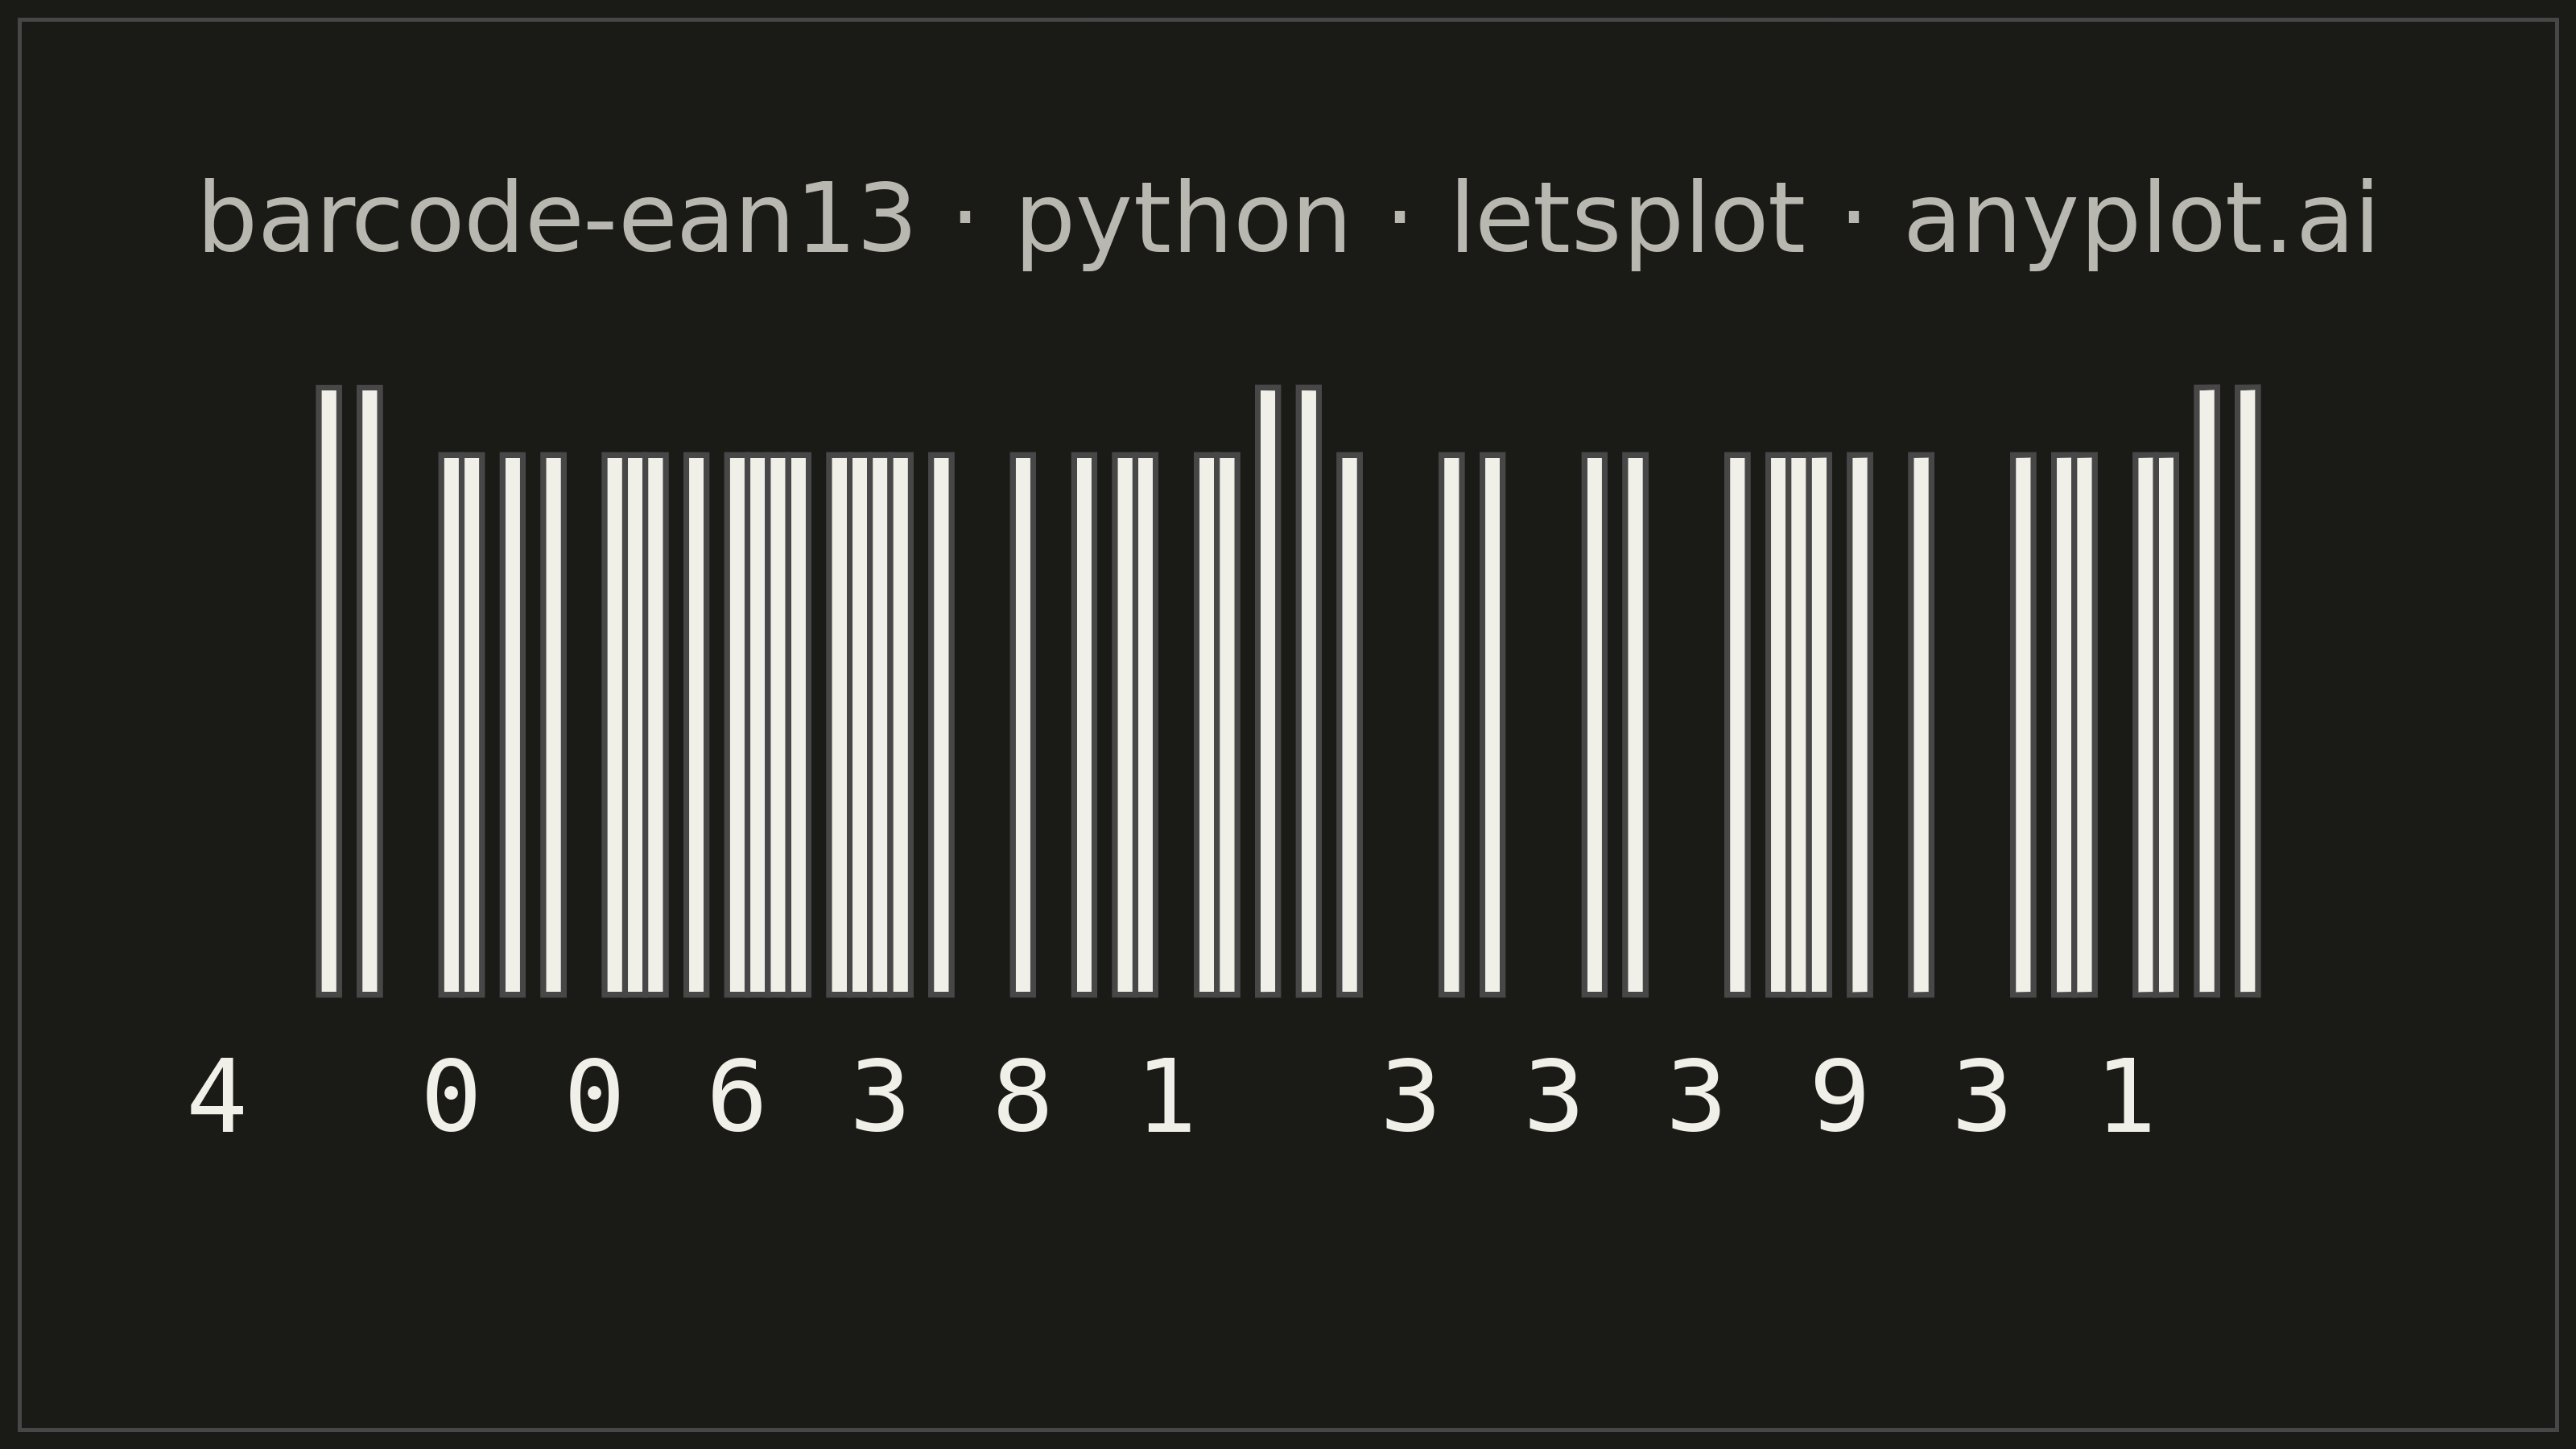
A standard EAN-13 barcode visualization commonly used for retail products worldwide. The plot renders a scannable linear barcode encoding a 13-digit number with proper bar widths, guard patterns, and human-readable digits. This visualization is essential for product identification, inventory management, and point-of-sale systems.
""" anyplot.ai
barcode-ean13: EAN-13 Barcode
Library: letsplot 4.10.1 | Python 3.13.13
Quality: 85/100 | Updated: 2026-05-21
"""

import os

import pandas as pd
from lets_plot import (
    LetsPlot,
    aes,
    element_blank,
    element_rect,
    geom_rect,
    geom_text,
    ggplot,
    ggsave,
    ggsize,
    layer_tooltips,
    scale_fill_identity,
    theme,
    theme_void,
    xlim,
    ylim,
)


LetsPlot.setup_html()

# Theme tokens
THEME = os.getenv("ANYPLOT_THEME", "light")
PAGE_BG = "#FAF8F1" if THEME == "light" else "#1A1A17"
INK = "#1A1A17" if THEME == "light" else "#F0EFE8"
INK_SOFT = "#4A4A44" if THEME == "light" else "#B8B7B0"
BAR_COLOR = "#1A1A17" if THEME == "light" else "#F0EFE8"

# EAN-13 encoding patterns (L, G, R codes — 7 modules each)
L_CODES = {
    "0": "0001101",
    "1": "0011001",
    "2": "0010011",
    "3": "0111101",
    "4": "0100011",
    "5": "0110001",
    "6": "0101111",
    "7": "0111011",
    "8": "0110111",
    "9": "0001011",
}
G_CODES = {
    "0": "0100111",
    "1": "0110011",
    "2": "0011011",
    "3": "0100001",
    "4": "0011101",
    "5": "0111001",
    "6": "0000101",
    "7": "0010001",
    "8": "0001001",
    "9": "0010111",
}
R_CODES = {
    "0": "1110010",
    "1": "1100110",
    "2": "1101100",
    "3": "1000010",
    "4": "1011100",
    "5": "1001110",
    "6": "1010000",
    "7": "1000100",
    "8": "1001000",
    "9": "1110100",
}
FIRST_DIGIT_PATTERNS = {
    "0": "LLLLLL",
    "1": "LLGLGG",
    "2": "LLGGLG",
    "3": "LLGGGL",
    "4": "LGLLGG",
    "5": "LGGLLG",
    "6": "LGGGLL",
    "7": "LGLGLG",
    "8": "LGLGGL",
    "9": "LGGLGL",
}

# Data — German product EAN-13 (4006381333931)
raw_code = "4006381333931"
module_width = 3
bar_y_min = 35
bar_y_max = bar_y_min + 80  # 80-unit bar height
guard_y_max = bar_y_max + 10  # guard bars extend 10 units lower

# Inline check digit calculation
digits_12 = raw_code[:12]
check_total = sum(int(d) * (1 if i % 2 == 0 else 3) for i, d in enumerate(digits_12))
check_digit = str((10 - (check_total % 10)) % 10)
full_code = digits_12 + check_digit if len(raw_code) == 12 else raw_code

# Inline EAN-13 bit-pattern encoding
first_digit = full_code[0]
left_digits = full_code[1:7]
right_digits = full_code[7:13]
parity = FIRST_DIGIT_PATTERNS[first_digit]

bars_pattern = "101"
for i, d in enumerate(left_digits):
    bars_pattern += L_CODES[d] if parity[i] == "L" else G_CODES[d]
bars_pattern += "01010"
for d in right_digits:
    bars_pattern += R_CODES[d]
bars_pattern += "101"

# Section label for each bit position — used in interactive HTML tooltips
section_labels = ["Start Guard"] * 3
for i in range(6):
    section_labels += [f"Left digit {i + 1}: {left_digits[i]}"] * 7
section_labels += ["Center Guard"] * 5
for i in range(6):
    section_labels += [f"Right digit {i + 7}: {right_digits[i]}"] * 7
section_labels += ["End Guard"] * 3

# Guard bar bit positions (start, center, end) — extend lower than regular bars
guard_positions = set(range(3)) | set(range(45, 50)) | set(range(92, 95))

# Inline bar rectangle generation
bars = []
x_pos = 9 * module_width  # quiet zone offset
for i, bit in enumerate(bars_pattern):
    if bit == "1":
        y_max = guard_y_max if i in guard_positions else bar_y_max
        bars.append(
            {
                "xmin": float(x_pos),
                "xmax": float(x_pos + module_width),
                "ymin": float(bar_y_min),
                "ymax": float(y_max),
                "fill": BAR_COLOR,
                "section": section_labels[i],
                "position": i,
            }
        )
    x_pos += module_width

total_width = x_pos + 9 * module_width  # right quiet zone
df_bars = pd.DataFrame(bars)

# Digit label positions
quiet_zone = 9 * module_width
start_guard_end = quiet_zone + 3 * module_width
left_digit_width = 7 * module_width
center_guard_start = start_guard_end + 42 * module_width
right_start = center_guard_start + 5 * module_width

text_y = bar_y_min - 15
digit_labels = [{"x": quiet_zone - 5 * module_width, "y": text_y, "label": full_code[0]}]
for i, d in enumerate(full_code[1:7]):
    digit_labels.append({"x": start_guard_end + (i + 0.5) * left_digit_width, "y": text_y, "label": d})
for i, d in enumerate(full_code[7:13]):
    digit_labels.append({"x": right_start + (i + 0.5) * left_digit_width, "y": text_y, "label": d})
df_digits = pd.DataFrame(digit_labels)

title_str = "barcode-ean13 · python · letsplot · anyplot.ai"
df_title = pd.DataFrame({"x": [total_width / 2], "y": [guard_y_max + 25], "label": [title_str]})

# Plot
plot = (
    ggplot()
    + geom_rect(
        aes(xmin="xmin", xmax="xmax", ymin="ymin", ymax="ymax", fill="fill"),
        data=df_bars,
        tooltips=layer_tooltips().line("@section").line("Module @position"),
    )
    + scale_fill_identity()
    + geom_text(aes(x="x", y="y", label="label"), data=df_digits, size=16, family="monospace", color=INK)
    + geom_text(aes(x="x", y="y", label="label"), data=df_title, size=15, color=INK_SOFT)
    + xlim(0, total_width)
    + ylim(-20, guard_y_max + 45)
    + theme_void()
    + theme(
        plot_background=element_rect(fill=PAGE_BG, color=PAGE_BG),
        panel_background=element_rect(fill=PAGE_BG),
        panel_border=element_blank(),
    )
    + ggsize(800, 450)
)

# Save
ggsave(plot, f"plot-{THEME}.png", scale=4, path=".")
ggsave(plot, f"plot-{THEME}.html", path=".")
Runnable source as JSON, for any HTTP client: https://api.anyplot.ai/specs/barcode-ean13/letsplot/code. Any spec id and library id listed in llms-full.txt fit the same URL shape; every URL below is complete and callable.
{
  "spec_id": "barcode-ean13",
  "language": "python",
  "library": "letsplot",
  "page": "https://anyplot.ai/barcode-ean13/python/letsplot",
  "hub": "https://anyplot.ai/barcode-ean13",
  "code_json": "https://api.anyplot.ai/specs/barcode-ean13/letsplot/code",
  "spec_json": "https://api.anyplot.ai/specs/barcode-ean13",
  "render_light_png": "https://storage.googleapis.com/anyplot-images/plots/barcode-ean13/python/letsplot/plot-light.png",
  "render_dark_png": "https://storage.googleapis.com/anyplot-images/plots/barcode-ean13/python/letsplot/plot-dark.png",
  "interactive_light_html": "https://storage.googleapis.com/anyplot-images/plots/barcode-ean13/python/letsplot/plot-light.html",
  "interactive_dark_html": "https://storage.googleapis.com/anyplot-images/plots/barcode-ean13/python/letsplot/plot-dark.html",
  "quality_score": 85.0,
  "license": "MIT",
  "guide": "https://anyplot.ai/llms.txt"
}
Part of EAN-13 Barcode on anyplot.ai.