The same plot in 14 other libraries — JavaScript: D3.js, Apache ECharts, Highcharts, MUI X Charts; Python: Altair, Bokeh, lets-plot, Matplotlib, Plotly, plotnine, Pygal, Seaborn; R: ggplot2; Julia: Makie.jl. Compare all 15 side by side: Chess Board Grid Visualization in Python, R, Julia and JavaScript.
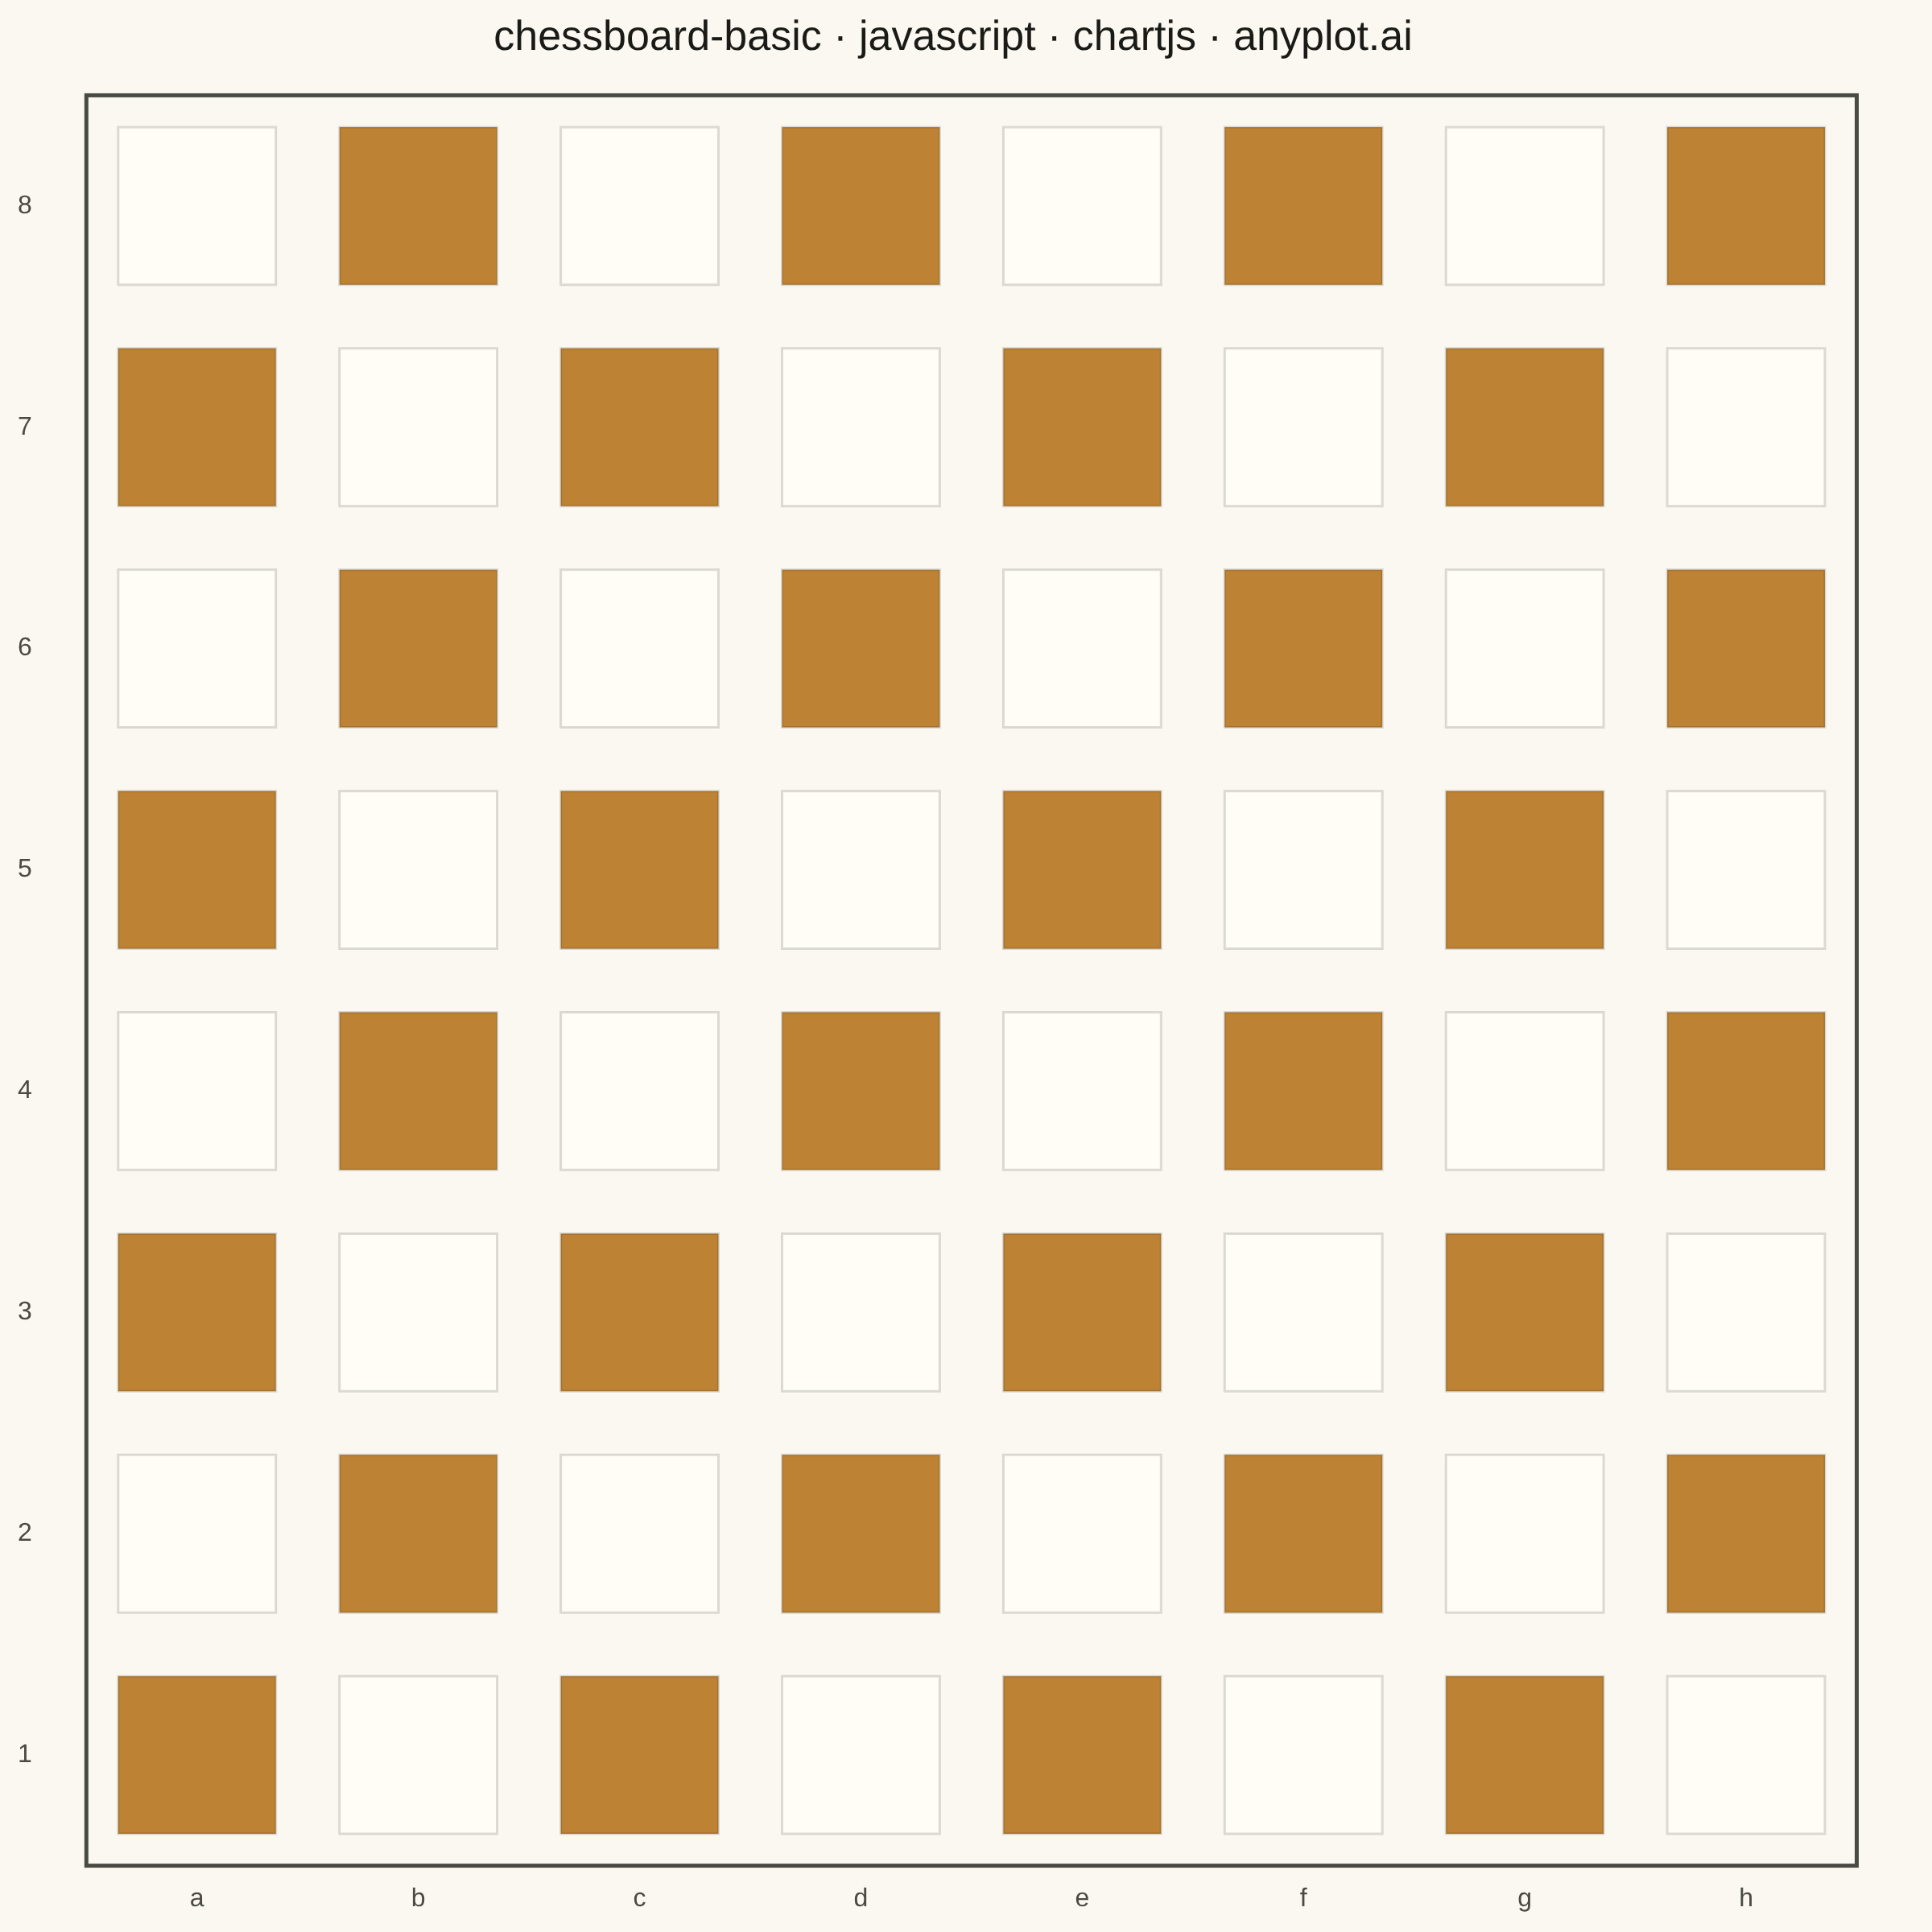
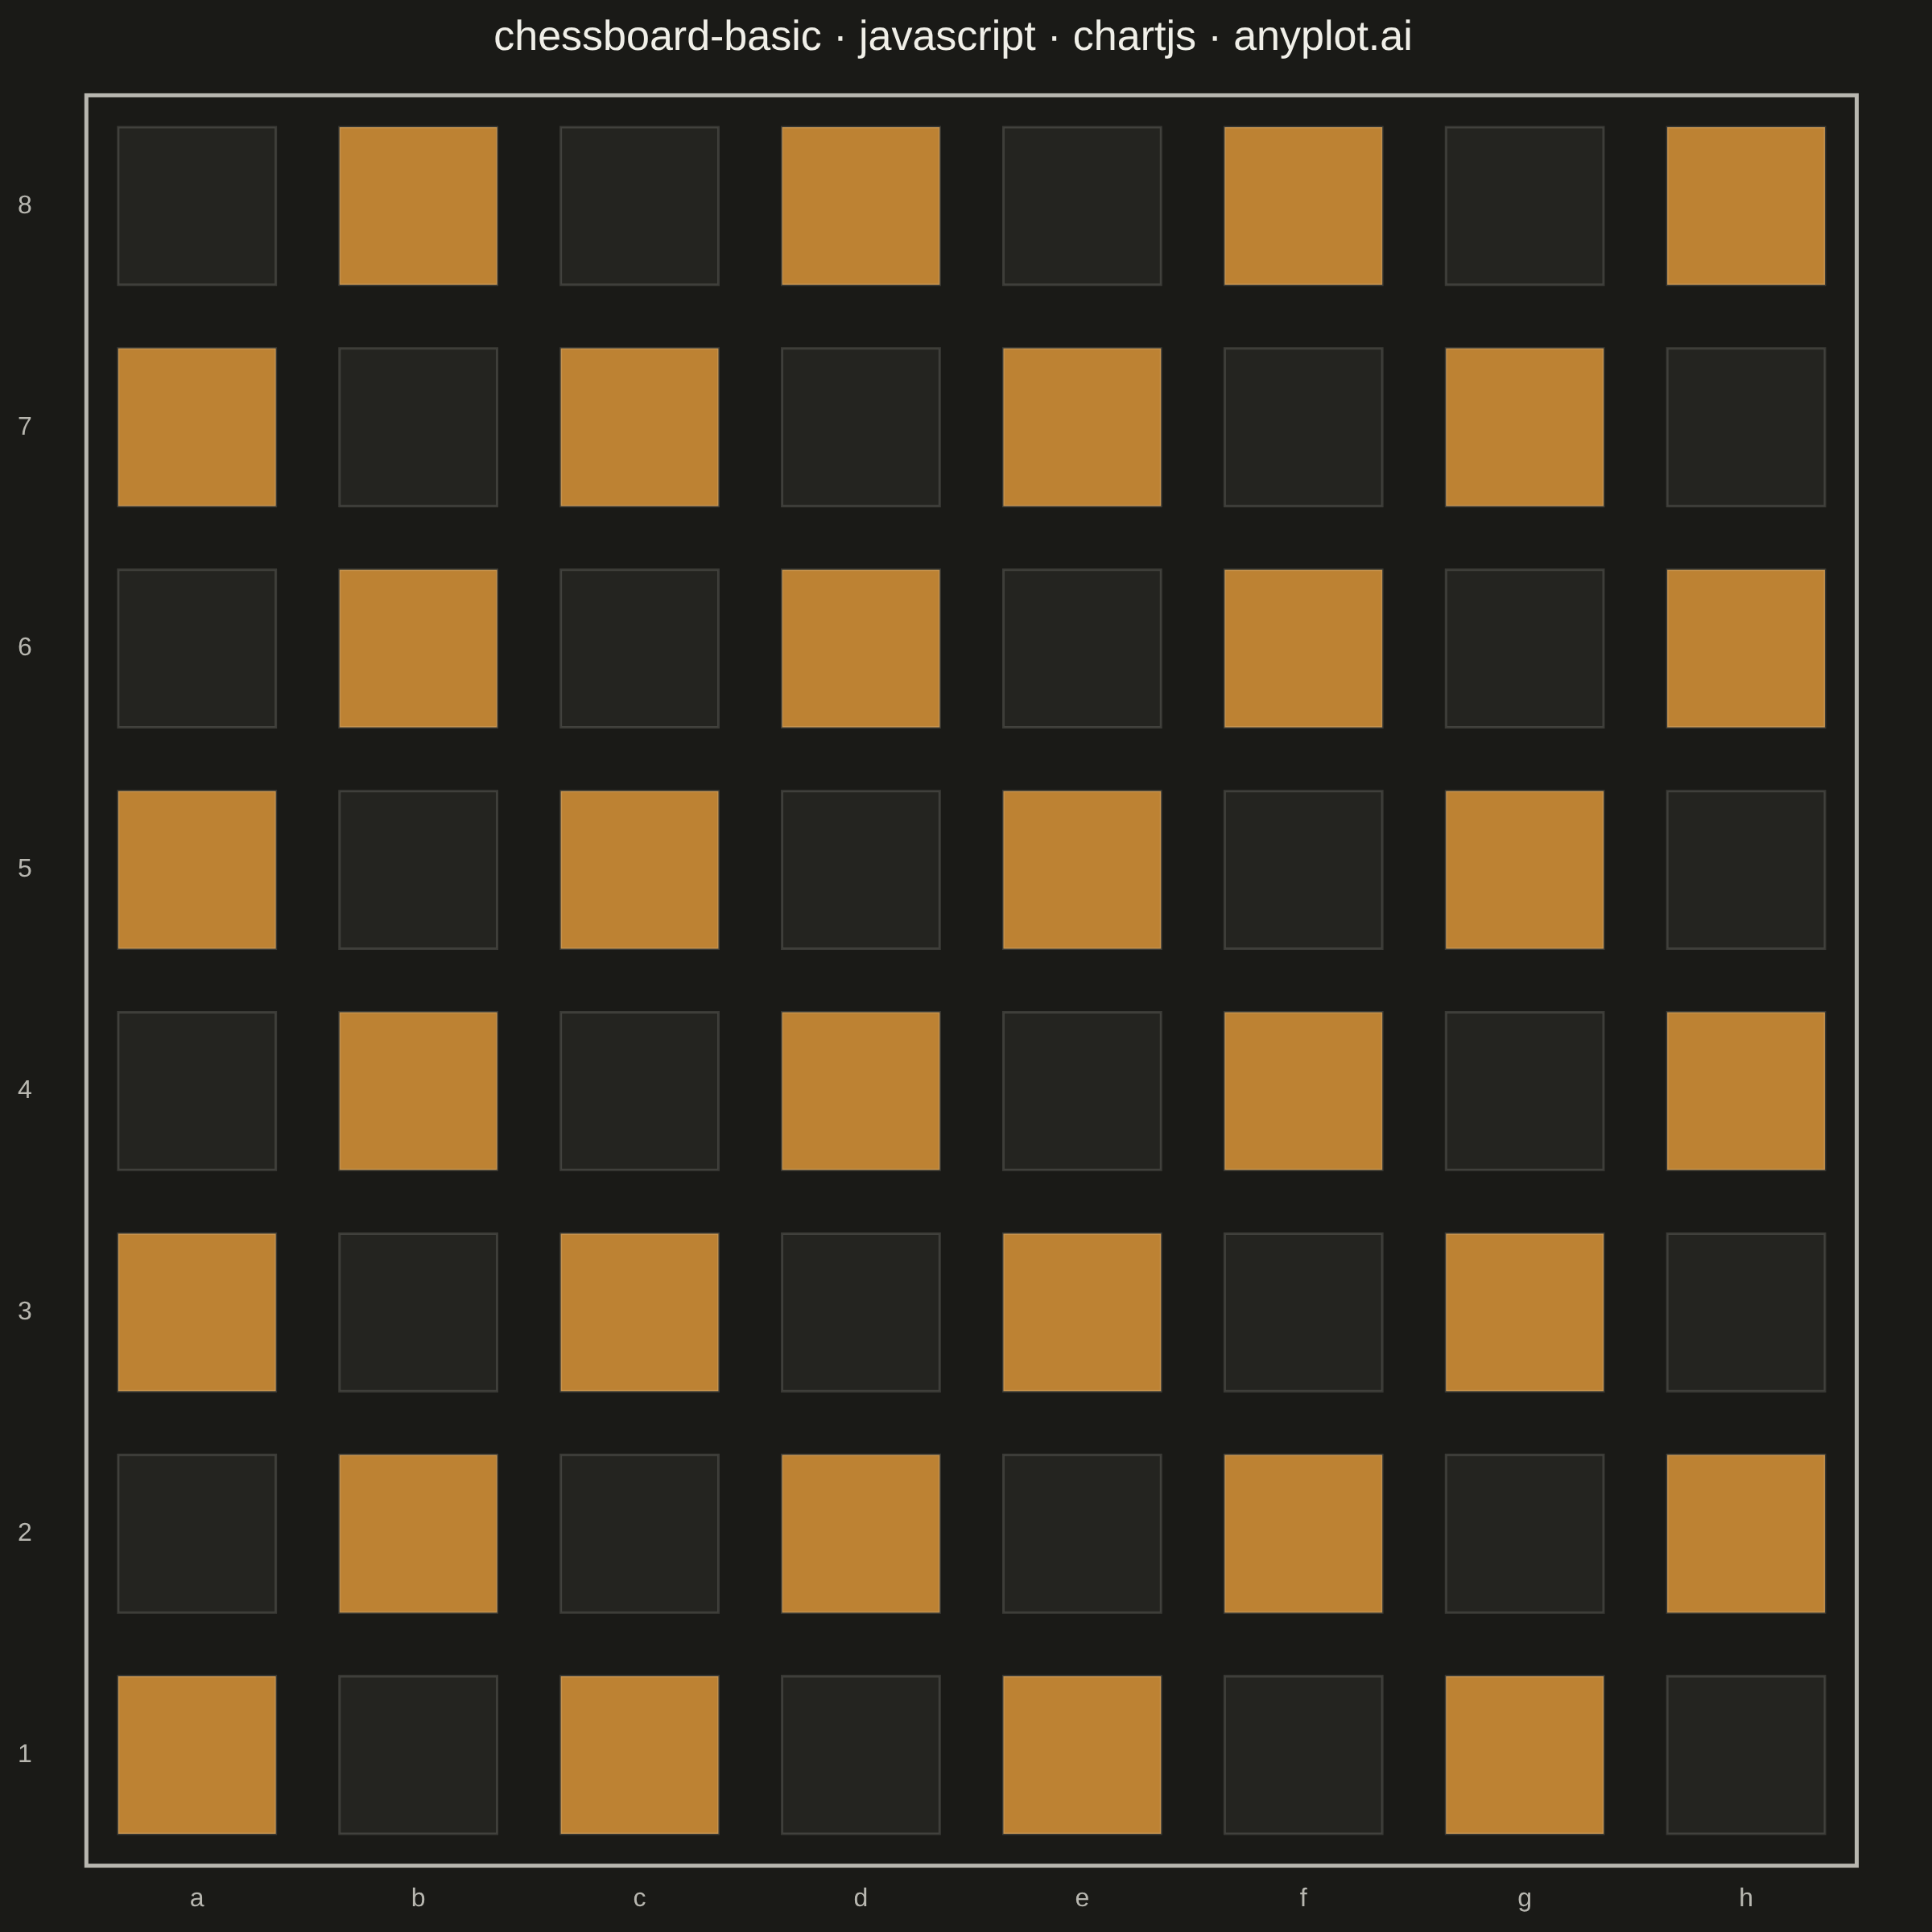
A classic 8x8 chess board with alternating light and dark squares, labeled with standard algebraic notation (columns a-h, rows 1-8). This clean grid visualization serves as a foundation for chess diagrams, game position displays, and educational chess materials.
// anyplot.ai
// chessboard-basic: Chess Board Grid Visualization
// Library: chartjs 4.4.7 | JavaScript 22.23.2
// Quality: 94/100 | Created: 2026-09-01

//# anyplot-orientation: square
const t = window.ANYPLOT_TOKENS;

// --- Data (in-memory, deterministic) ----------------------------------------
// Standard 8x8 board: files a-h left-to-right, ranks 1-8 bottom-to-top.
// Light squares fall on h1 and a8 (file-index + rank-index is odd).
const FILES = ["a", "b", "c", "d", "e", "f", "g", "h"];
const RANKS = ["1", "2", "3", "4", "5", "6", "7", "8"];

const squares = [];
for (let r = 0; r < 8; r++) {
  for (let c = 0; c < 8; c++) {
    squares.push({ x: c, y: r, file: FILES[c], rank: RANKS[r], isLight: (c + r) % 2 === 1 });
  }
}

// Semantic exception (default-style-guide.md): a chess board is a real-world
// object with a strong cream/wood color expectation, so dark squares use the
// Imprint ochre hue (earth/wood) instead of the canonical position-2 lavender,
// and light squares use the elevated-surface token rather than a custom hex.
const LIGHT_SQUARE = t.elevatedBg;
const DARK_SQUARE = t.palette[3]; // #BD8233 ochre — wood association

// --- Square-aspect layout plugin --------------------------------------------
// The title block eats vertical space the axis labels don't eat horizontally,
// so the raw chart area isn't square. Shrink it to the largest centered
// square before the scatter points (and their pixel-derived radius) are laid
// out, then draw a crisp outer frame so the board reads as one solid block
// even where a corner square's fill is close in value to the page background.
const squareBoard = {
  id: "squareBoard",
  afterLayout(chart) {
    const { x, y } = chart.scales;
    if (!x || !y) return;
    const width = x.right - x.left;
    const height = y.bottom - y.top;
    const side = Math.min(width, height);
    x.left += (width - side) / 2;
    x.right = x.left + side;
    y.top += (height - side) / 2;
    y.bottom = y.top + side;
    chart.chartArea.left = x.left;
    chart.chartArea.right = x.right;
    chart.chartArea.top = y.top;
    chart.chartArea.bottom = y.bottom;
    // LinearScale caches _startPixel/_length in configure() during layout —
    // it must re-run for the shrunk box to affect pixel conversion.
    x.configure();
    y.configure();
  },
  afterDatasetsDraw(chart) {
    const { ctx, chartArea: area } = chart;
    ctx.save();
    ctx.strokeStyle = t.inkSoft;
    ctx.lineWidth = 2.5;
    ctx.strokeRect(area.left, area.top, area.right - area.left, area.bottom - area.top);
    ctx.restore();
  },
};

// --- Mount -------------------------------------------------------------------
const canvas = document.createElement("canvas");
document.getElementById("container").appendChild(canvas);

// --- Chart -------------------------------------------------------------------
new Chart(canvas, {
  type: "scatter",
  plugins: [squareBoard],
  data: {
    datasets: [
      {
        data: squares,
        showLine: false,
        pointStyle: "rect",
        pointBackgroundColor: (ctx) => (ctx.raw.isLight ? LIGHT_SQUARE : DARK_SQUARE),
        pointBorderColor: t.grid,
        pointBorderWidth: 1.5,
        pointRadius: (ctx) => {
          const { x, y } = ctx.chart.scales;
          if (!x || !y) return 8;
          const pxPerCol = Math.abs(x.getPixelForValue(1) - x.getPixelForValue(0));
          const pxPerRow = Math.abs(y.getPixelForValue(1) - y.getPixelForValue(0));
          return Math.min(pxPerCol, pxPerRow) / 2 + 0.5; // slight overlap hides seams
        },
        pointHoverBackgroundColor: (ctx) => (ctx.raw.isLight ? LIGHT_SQUARE : DARK_SQUARE),
        pointHoverBorderColor: t.ink,
        pointHoverBorderWidth: 2,
      },
    ],
  },
  options: {
    responsive: true,
    maintainAspectRatio: false,
    animation: false,
    layout: { padding: { top: 8, right: 24, bottom: 8, left: 8 } },
    plugins: {
      title: {
        display: true,
        text: "chessboard-basic · javascript · chartjs · anyplot.ai",
        color: t.ink,
        font: { size: 26, weight: "500" },
        padding: { bottom: 20 },
      },
      legend: { display: false },
      tooltip: {
        callbacks: {
          title: (items) => `${items[0].raw.file}${items[0].raw.rank}`,
          label: (item) => (item.raw.isLight ? "Light square" : "Dark square"),
        },
      },
    },
    scales: {
      x: {
        type: "linear",
        min: -0.5,
        max: 7.5,
        afterBuildTicks: (axis) => {
          axis.ticks = FILES.map((_, i) => ({ value: i }));
        },
        ticks: { callback: (v) => FILES[v] ?? "", color: t.inkSoft, font: { size: 16 } },
        grid: { display: false },
        border: { display: false },
      },
      y: {
        type: "linear",
        min: -0.5,
        max: 7.5,
        afterBuildTicks: (axis) => {
          axis.ticks = RANKS.map((_, i) => ({ value: i }));
        },
        ticks: { callback: (v) => RANKS[v] ?? "", color: t.inkSoft, font: { size: 16 } },
        grid: { display: false },
        border: { display: false },
      },
    },
  },
});
Runnable source as JSON, for any HTTP client: https://api.anyplot.ai/specs/chessboard-basic/chartjs/code. Any spec id and library id listed in llms-full.txt fit the same URL shape; every URL below is complete and callable.
{
  "spec_id": "chessboard-basic",
  "language": "javascript",
  "library": "chartjs",
  "page": "https://anyplot.ai/chessboard-basic/javascript/chartjs",
  "hub": "https://anyplot.ai/chessboard-basic",
  "code_json": "https://api.anyplot.ai/specs/chessboard-basic/chartjs/code",
  "spec_json": "https://api.anyplot.ai/specs/chessboard-basic",
  "render_light_png": "https://storage.googleapis.com/anyplot-images/plots/chessboard-basic/javascript/chartjs/plot-light.png",
  "render_dark_png": "https://storage.googleapis.com/anyplot-images/plots/chessboard-basic/javascript/chartjs/plot-dark.png",
  "interactive_light_html": "https://storage.googleapis.com/anyplot-images/plots/chessboard-basic/javascript/chartjs/plot-light.html",
  "interactive_dark_html": "https://storage.googleapis.com/anyplot-images/plots/chessboard-basic/javascript/chartjs/plot-dark.html",
  "quality_score": 94.0,
  "license": "MIT",
  "guide": "https://anyplot.ai/llms.txt"
}
Part of Chess Board Grid Visualization on anyplot.ai.