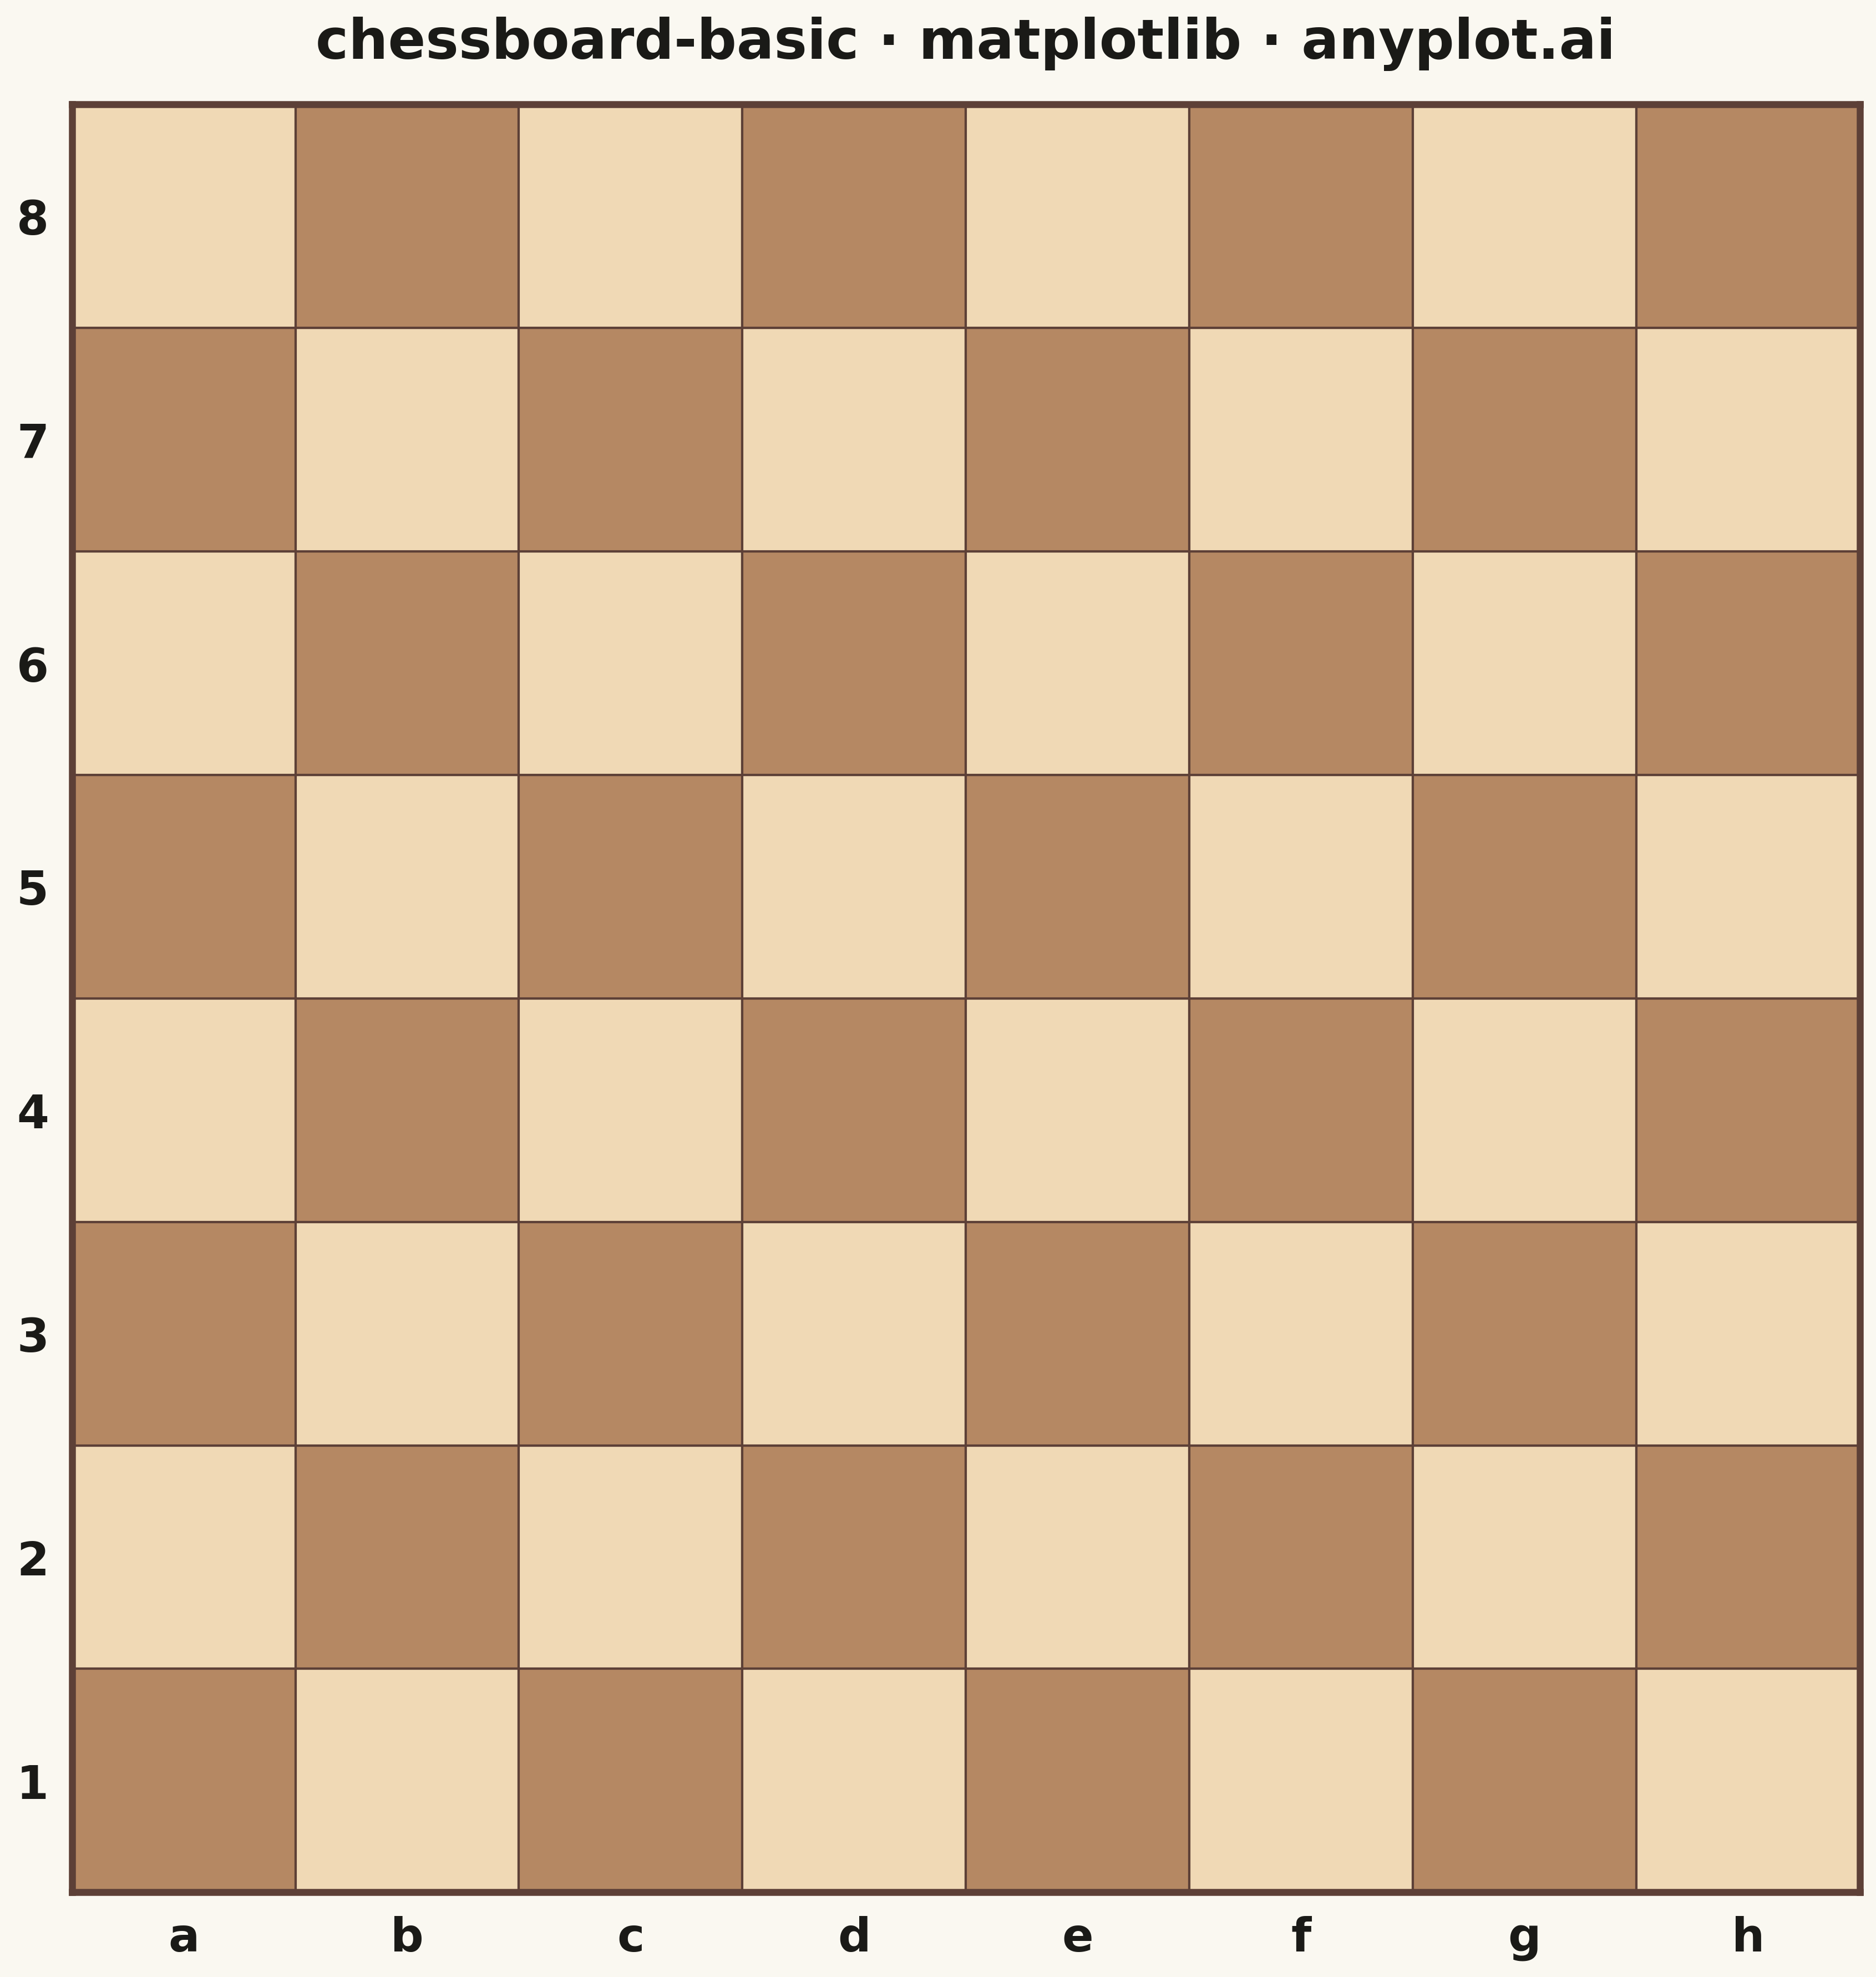
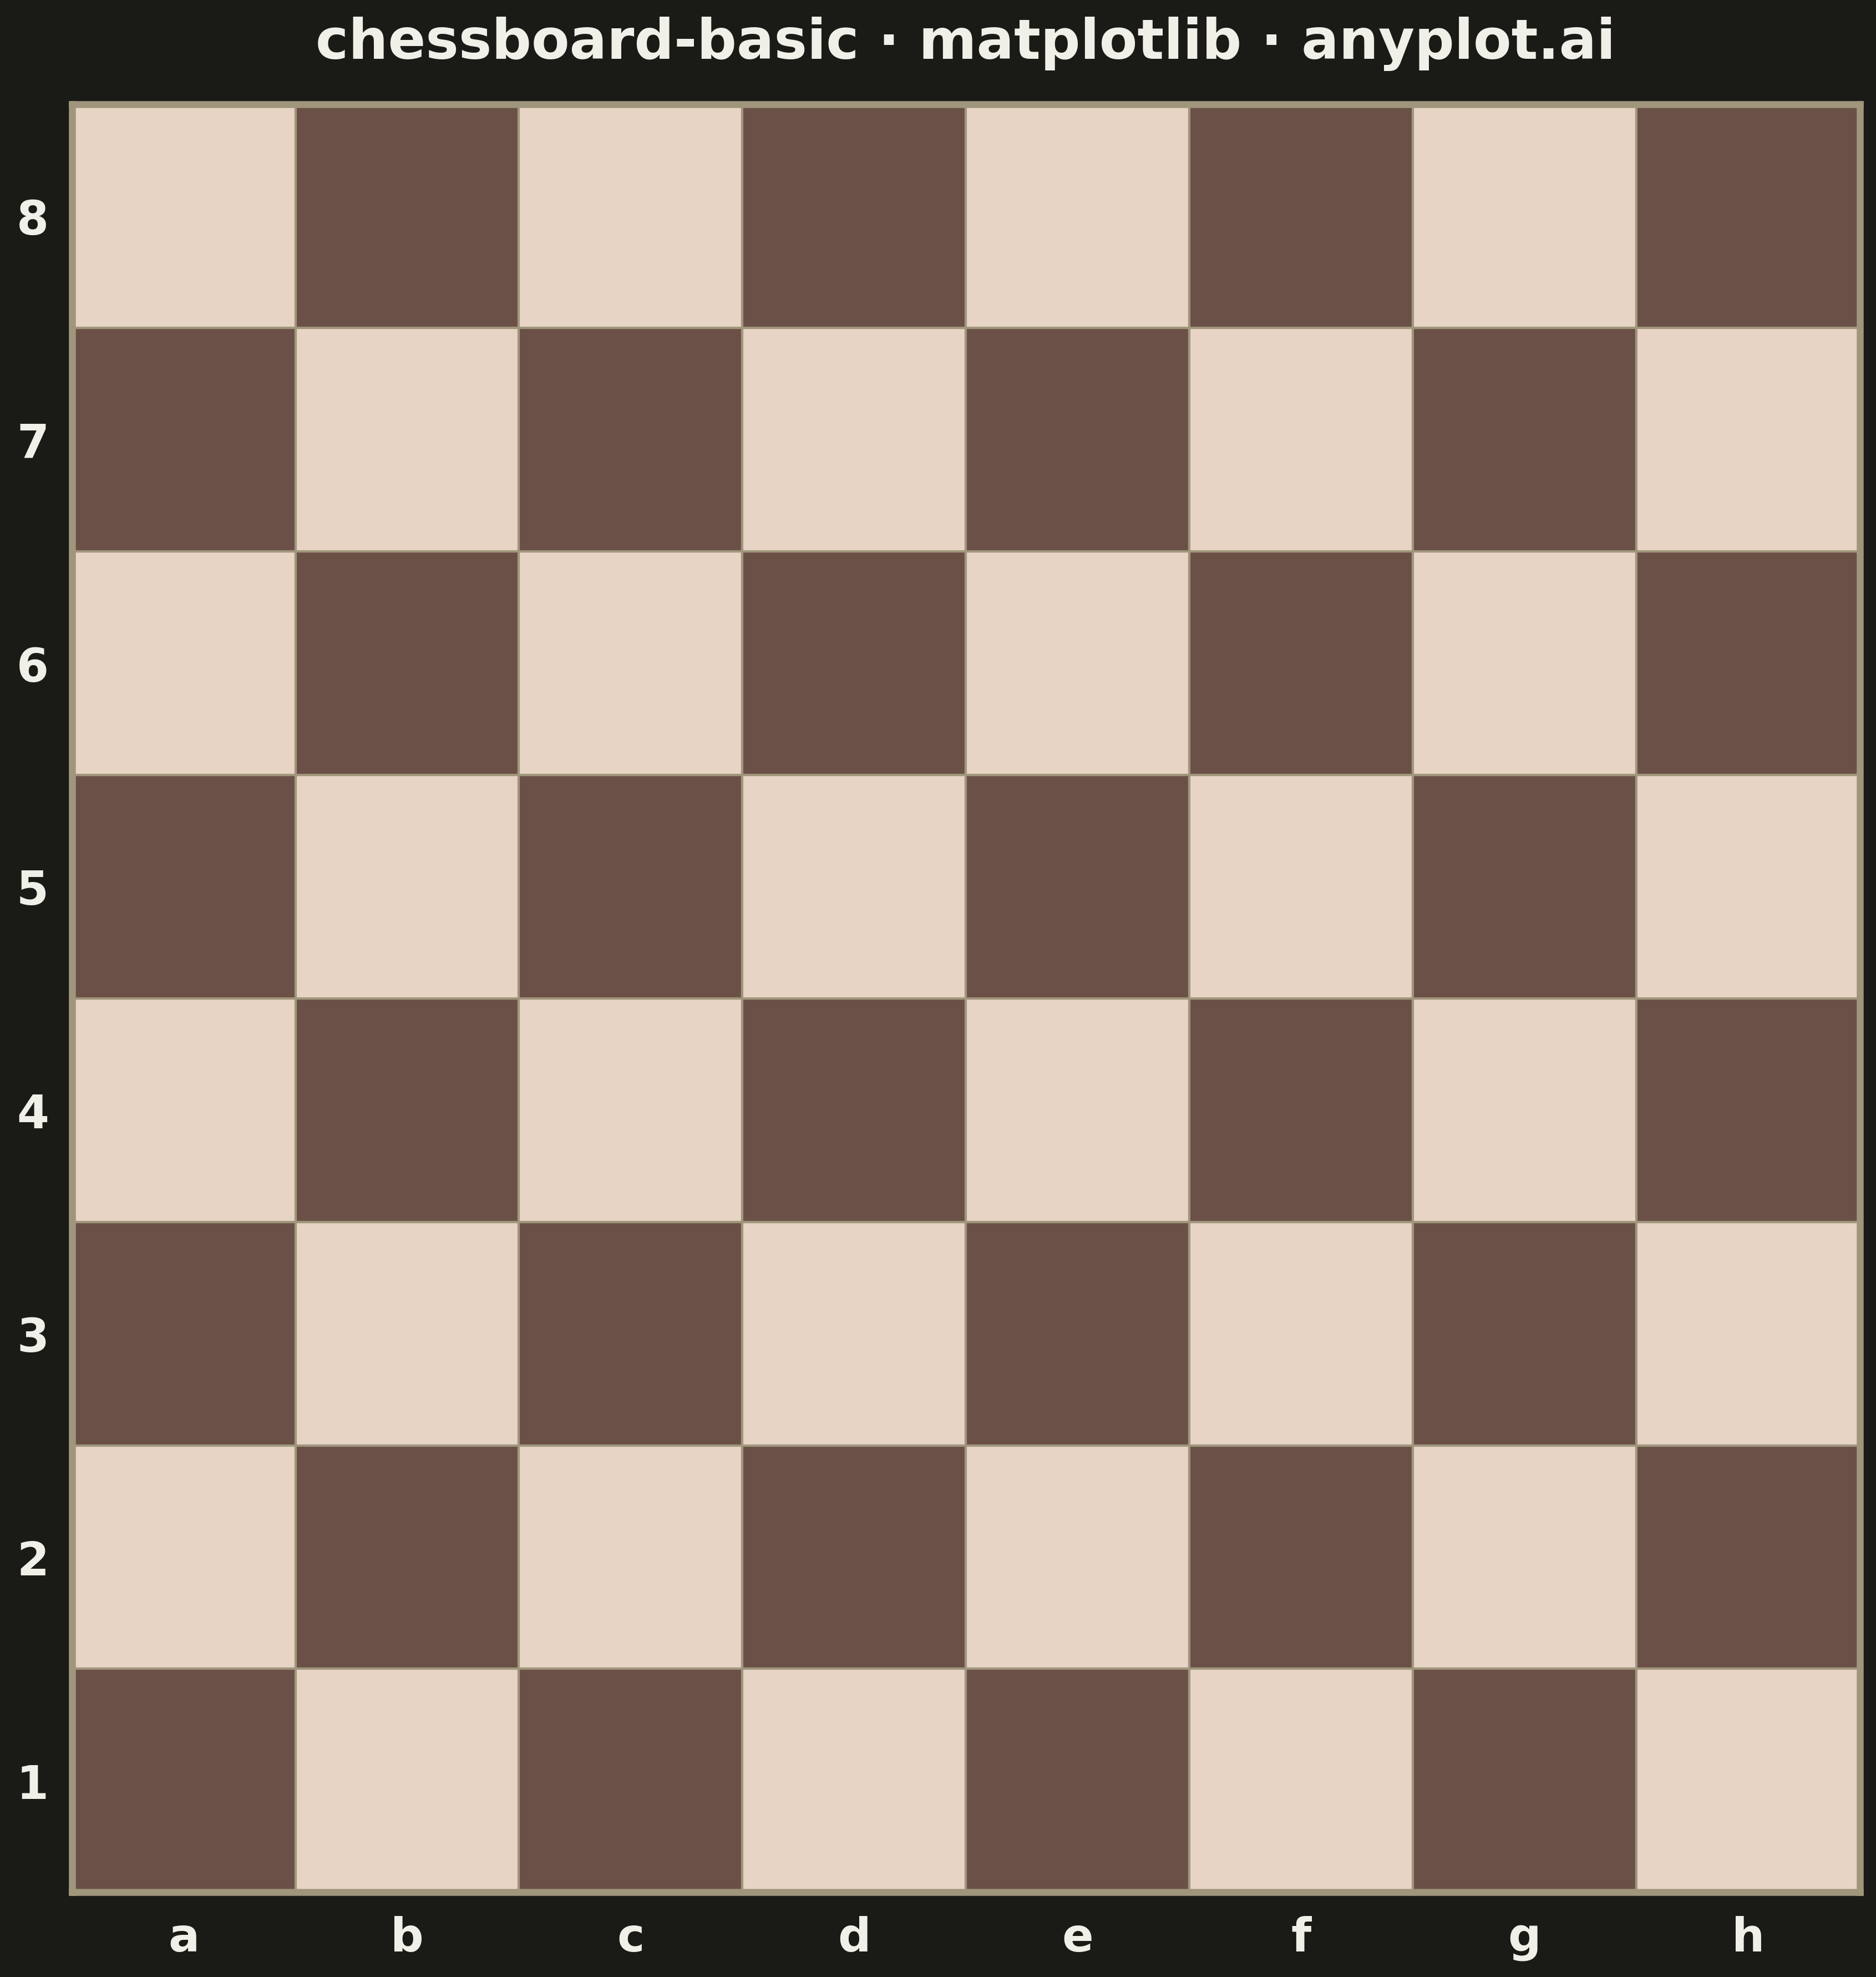
A classic 8x8 chess board with alternating light and dark squares, labeled with standard algebraic notation (columns a-h, rows 1-8). This clean grid visualization serves as a foundation for chess diagrams, game position displays, and educational chess materials.
""" anyplot.ai
chessboard-basic: Chess Board Grid Visualization
Library: matplotlib 3.10.9 | Python 3.13.13
Quality: 92/100 | Updated: 2026-05-17
"""

import os
import sys


# Remove the script directory from sys.path to avoid shadowing the matplotlib package
sys.path = [p for p in sys.path if p != os.path.dirname(__file__)]

import matplotlib.pyplot as plt


# Theme tokens
THEME = os.getenv("ANYPLOT_THEME", "light")
PAGE_BG = "#FAF8F1" if THEME == "light" else "#1A1A17"
INK = "#1A1A17" if THEME == "light" else "#F0EFE8"
INK_SOFT = "#4A4A44" if THEME == "light" else "#B8B7B0"

# Chess board colors (theme-adaptive)
if THEME == "light":
    LIGHT_SQUARE = "#F0D9B5"
    DARK_SQUARE = "#B58863"
    BORDER_COLOR = "#5D4037"
else:
    LIGHT_SQUARE = "#E8D4C4"
    DARK_SQUARE = "#6B5047"
    BORDER_COLOR = "#A0967C"

# Board configuration
rows = 8
cols = 8
column_labels = ["a", "b", "c", "d", "e", "f", "g", "h"]
row_labels = ["1", "2", "3", "4", "5", "6", "7", "8"]

# Create figure (square aspect ratio for chess board)
fig, ax = plt.subplots(figsize=(12, 12), facecolor=PAGE_BG)
ax.set_facecolor(PAGE_BG)

# Draw the chess board squares
for row in range(rows):
    for col in range(cols):
        # h1 (col=7, row=0) should be light, so (row + col) even = light
        color = LIGHT_SQUARE if (row + col) % 2 == 1 else DARK_SQUARE
        rect = plt.Rectangle((col, row), 1, 1, facecolor=color, edgecolor=BORDER_COLOR, linewidth=1)
        ax.add_patch(rect)

# Set axis limits
ax.set_xlim(0, 8)
ax.set_ylim(0, 8)

# Set column labels (a-h) at the bottom
ax.set_xticks([i + 0.5 for i in range(8)])
ax.set_xticklabels(column_labels, fontsize=20, fontweight="bold", color=INK)

# Set row labels (1-8) on the left side
ax.set_yticks([i + 0.5 for i in range(8)])
ax.set_yticklabels(row_labels, fontsize=20, fontweight="bold", color=INK)

# Style the axis
ax.tick_params(axis="both", length=0, pad=10)
ax.set_aspect("equal")

# Remove spines and add a border
for spine in ax.spines.values():
    spine.set_visible(True)
    spine.set_linewidth(3)
    spine.set_color(BORDER_COLOR)

# Title
ax.set_title("chessboard-basic · matplotlib · anyplot.ai", fontsize=24, fontweight="bold", color=INK, pad=20)

plt.tight_layout()
plt.savefig(f"plot-{THEME}.png", dpi=300, bbox_inches="tight", facecolor=PAGE_BG)
Runnable source as JSON, for any HTTP client: https://api.anyplot.ai/specs/chessboard-basic/matplotlib/code. Any spec id and library id listed in llms-full.txt fit the same URL shape; every URL below is complete and callable.
{
  "spec_id": "chessboard-basic",
  "language": "python",
  "library": "matplotlib",
  "page": "https://anyplot.ai/chessboard-basic/python/matplotlib",
  "hub": "https://anyplot.ai/chessboard-basic",
  "code_json": "https://api.anyplot.ai/specs/chessboard-basic/matplotlib/code",
  "spec_json": "https://api.anyplot.ai/specs/chessboard-basic",
  "render_light_png": "https://storage.googleapis.com/anyplot-images/plots/chessboard-basic/python/matplotlib/plot-light.png",
  "render_dark_png": "https://storage.googleapis.com/anyplot-images/plots/chessboard-basic/python/matplotlib/plot-dark.png",
  "quality_score": 92.0,
  "license": "MIT",
  "guide": "https://anyplot.ai/llms.txt"
}
Part of Chess Board Grid Visualization on anyplot.ai.