The same plot in 14 other libraries — JavaScript: Chart.js, D3.js, Apache ECharts, MUI X Charts; Python: Altair, Bokeh, lets-plot, Matplotlib, Plotly, plotnine, Pygal, Seaborn; R: ggplot2; Julia: Makie.jl. Compare all 15 side by side: Chess Board Grid Visualization in Python, R, Julia and JavaScript.
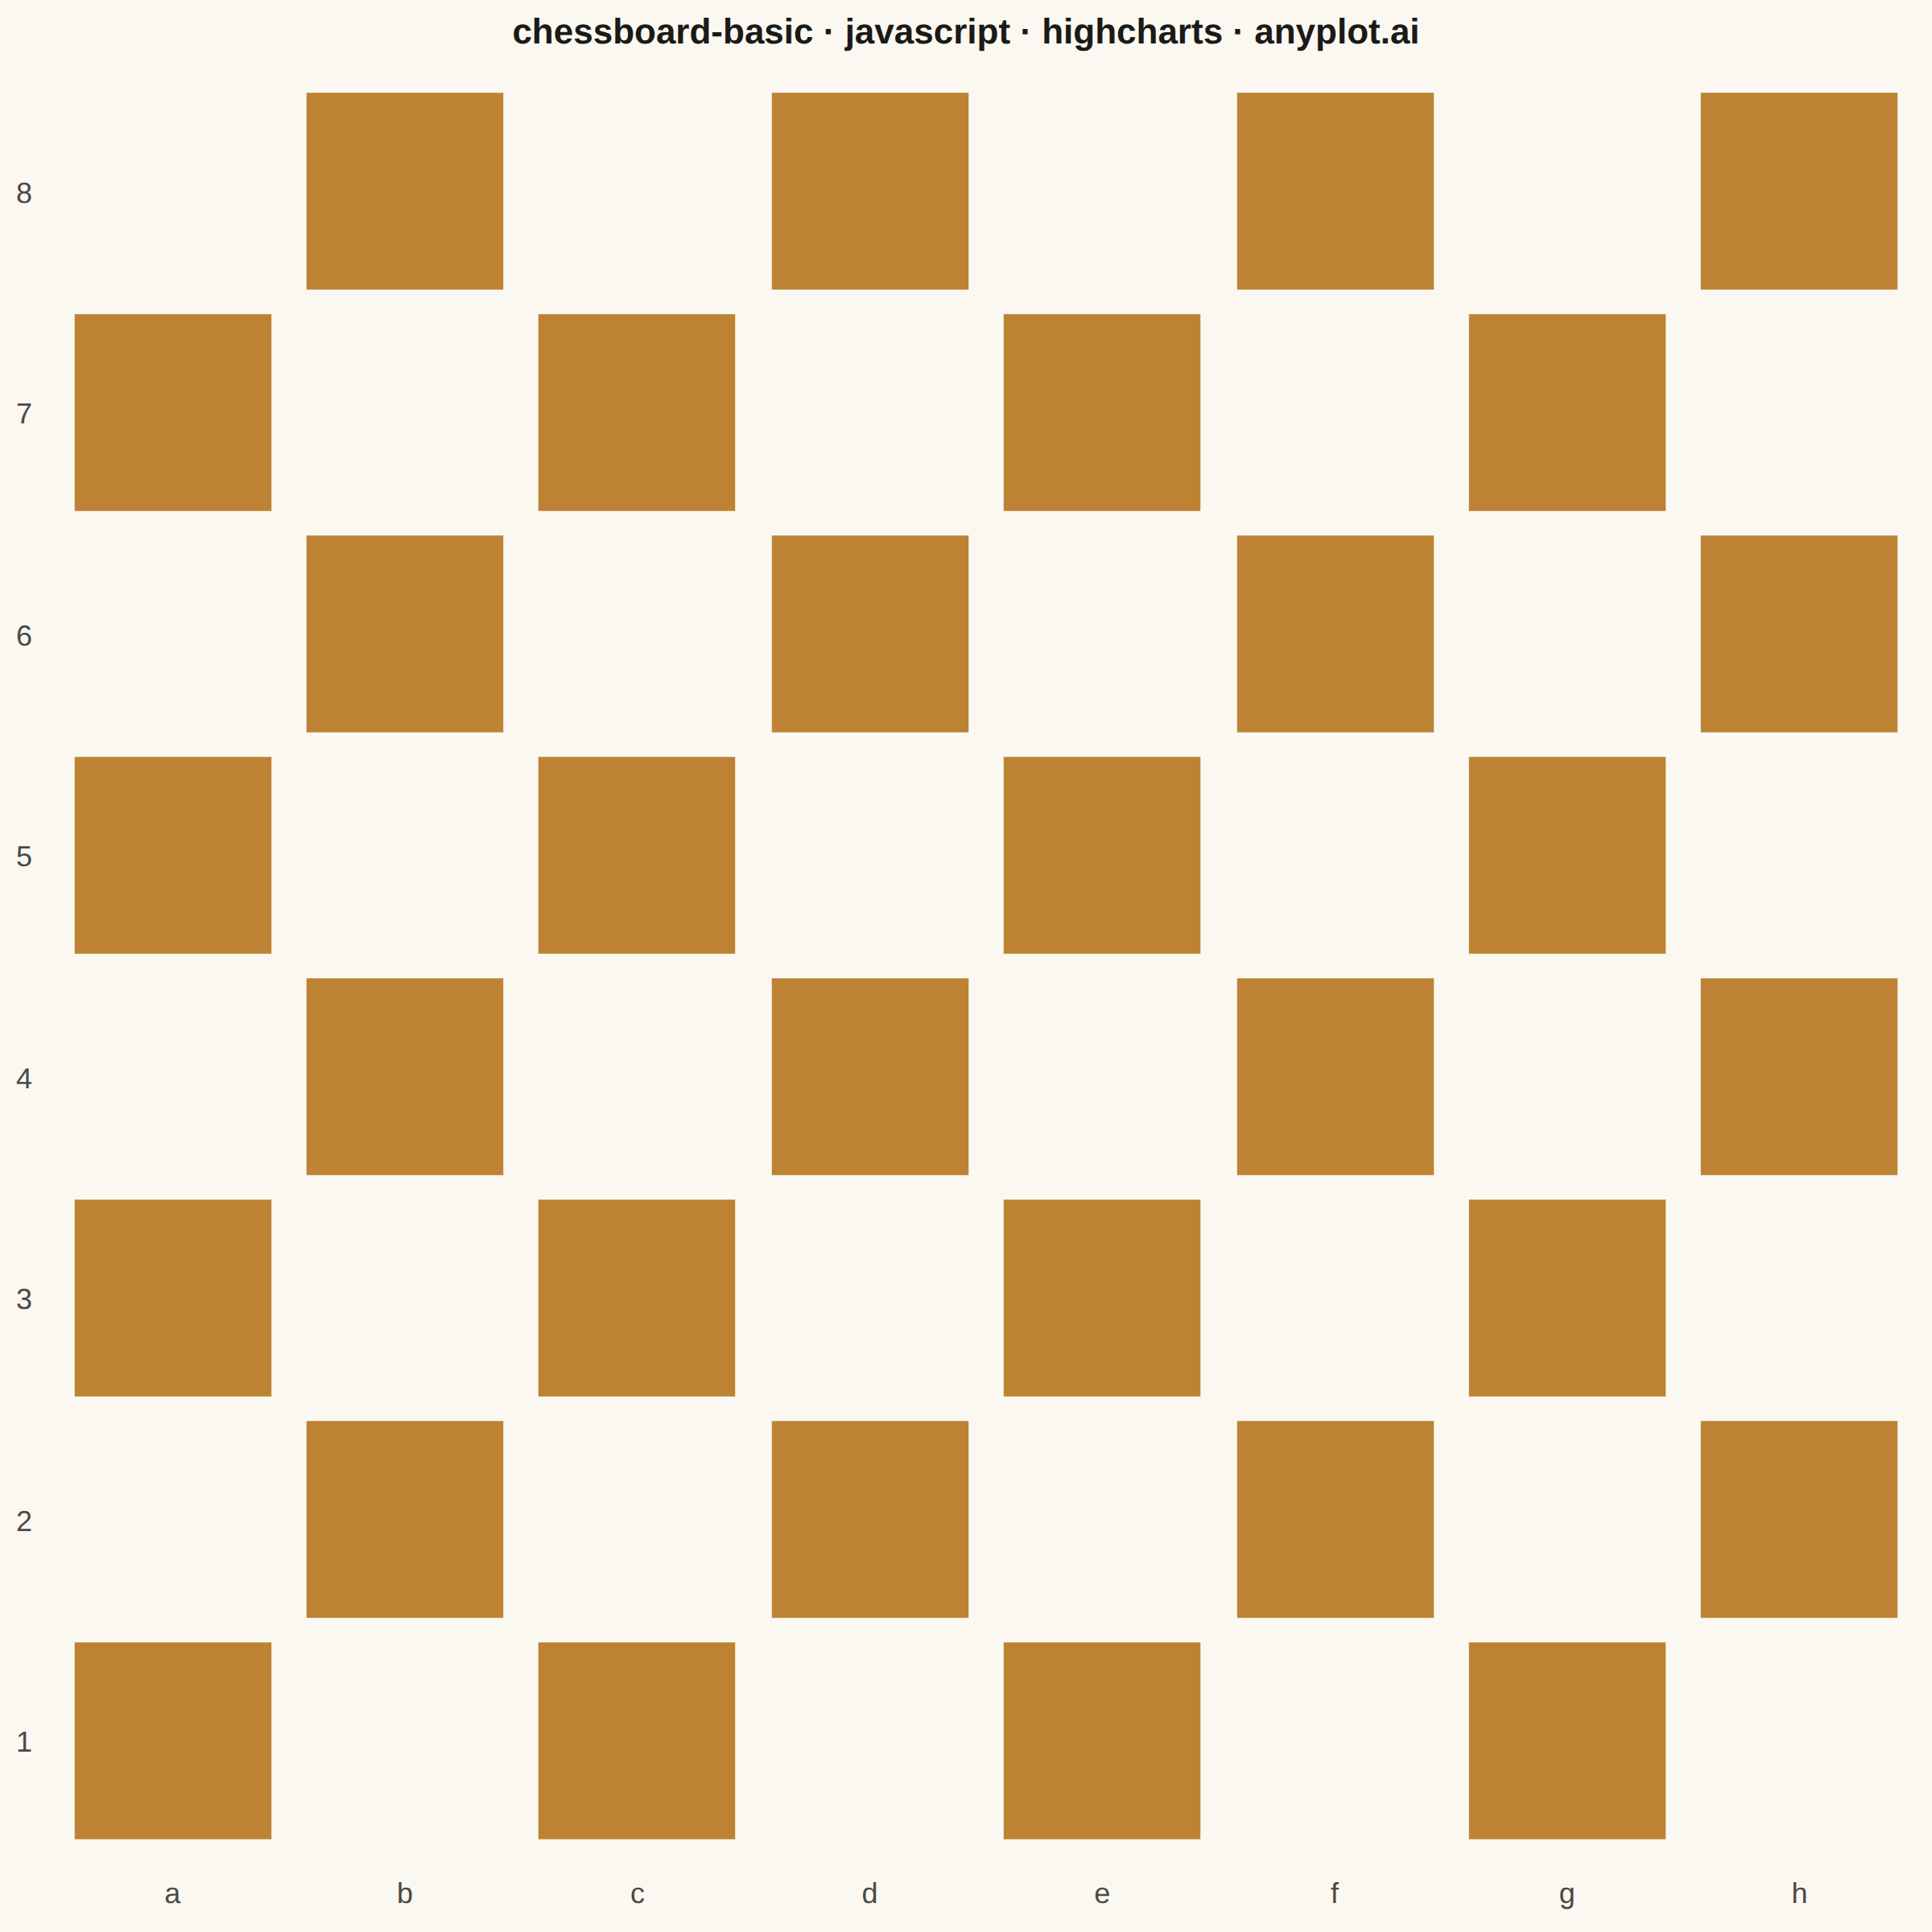
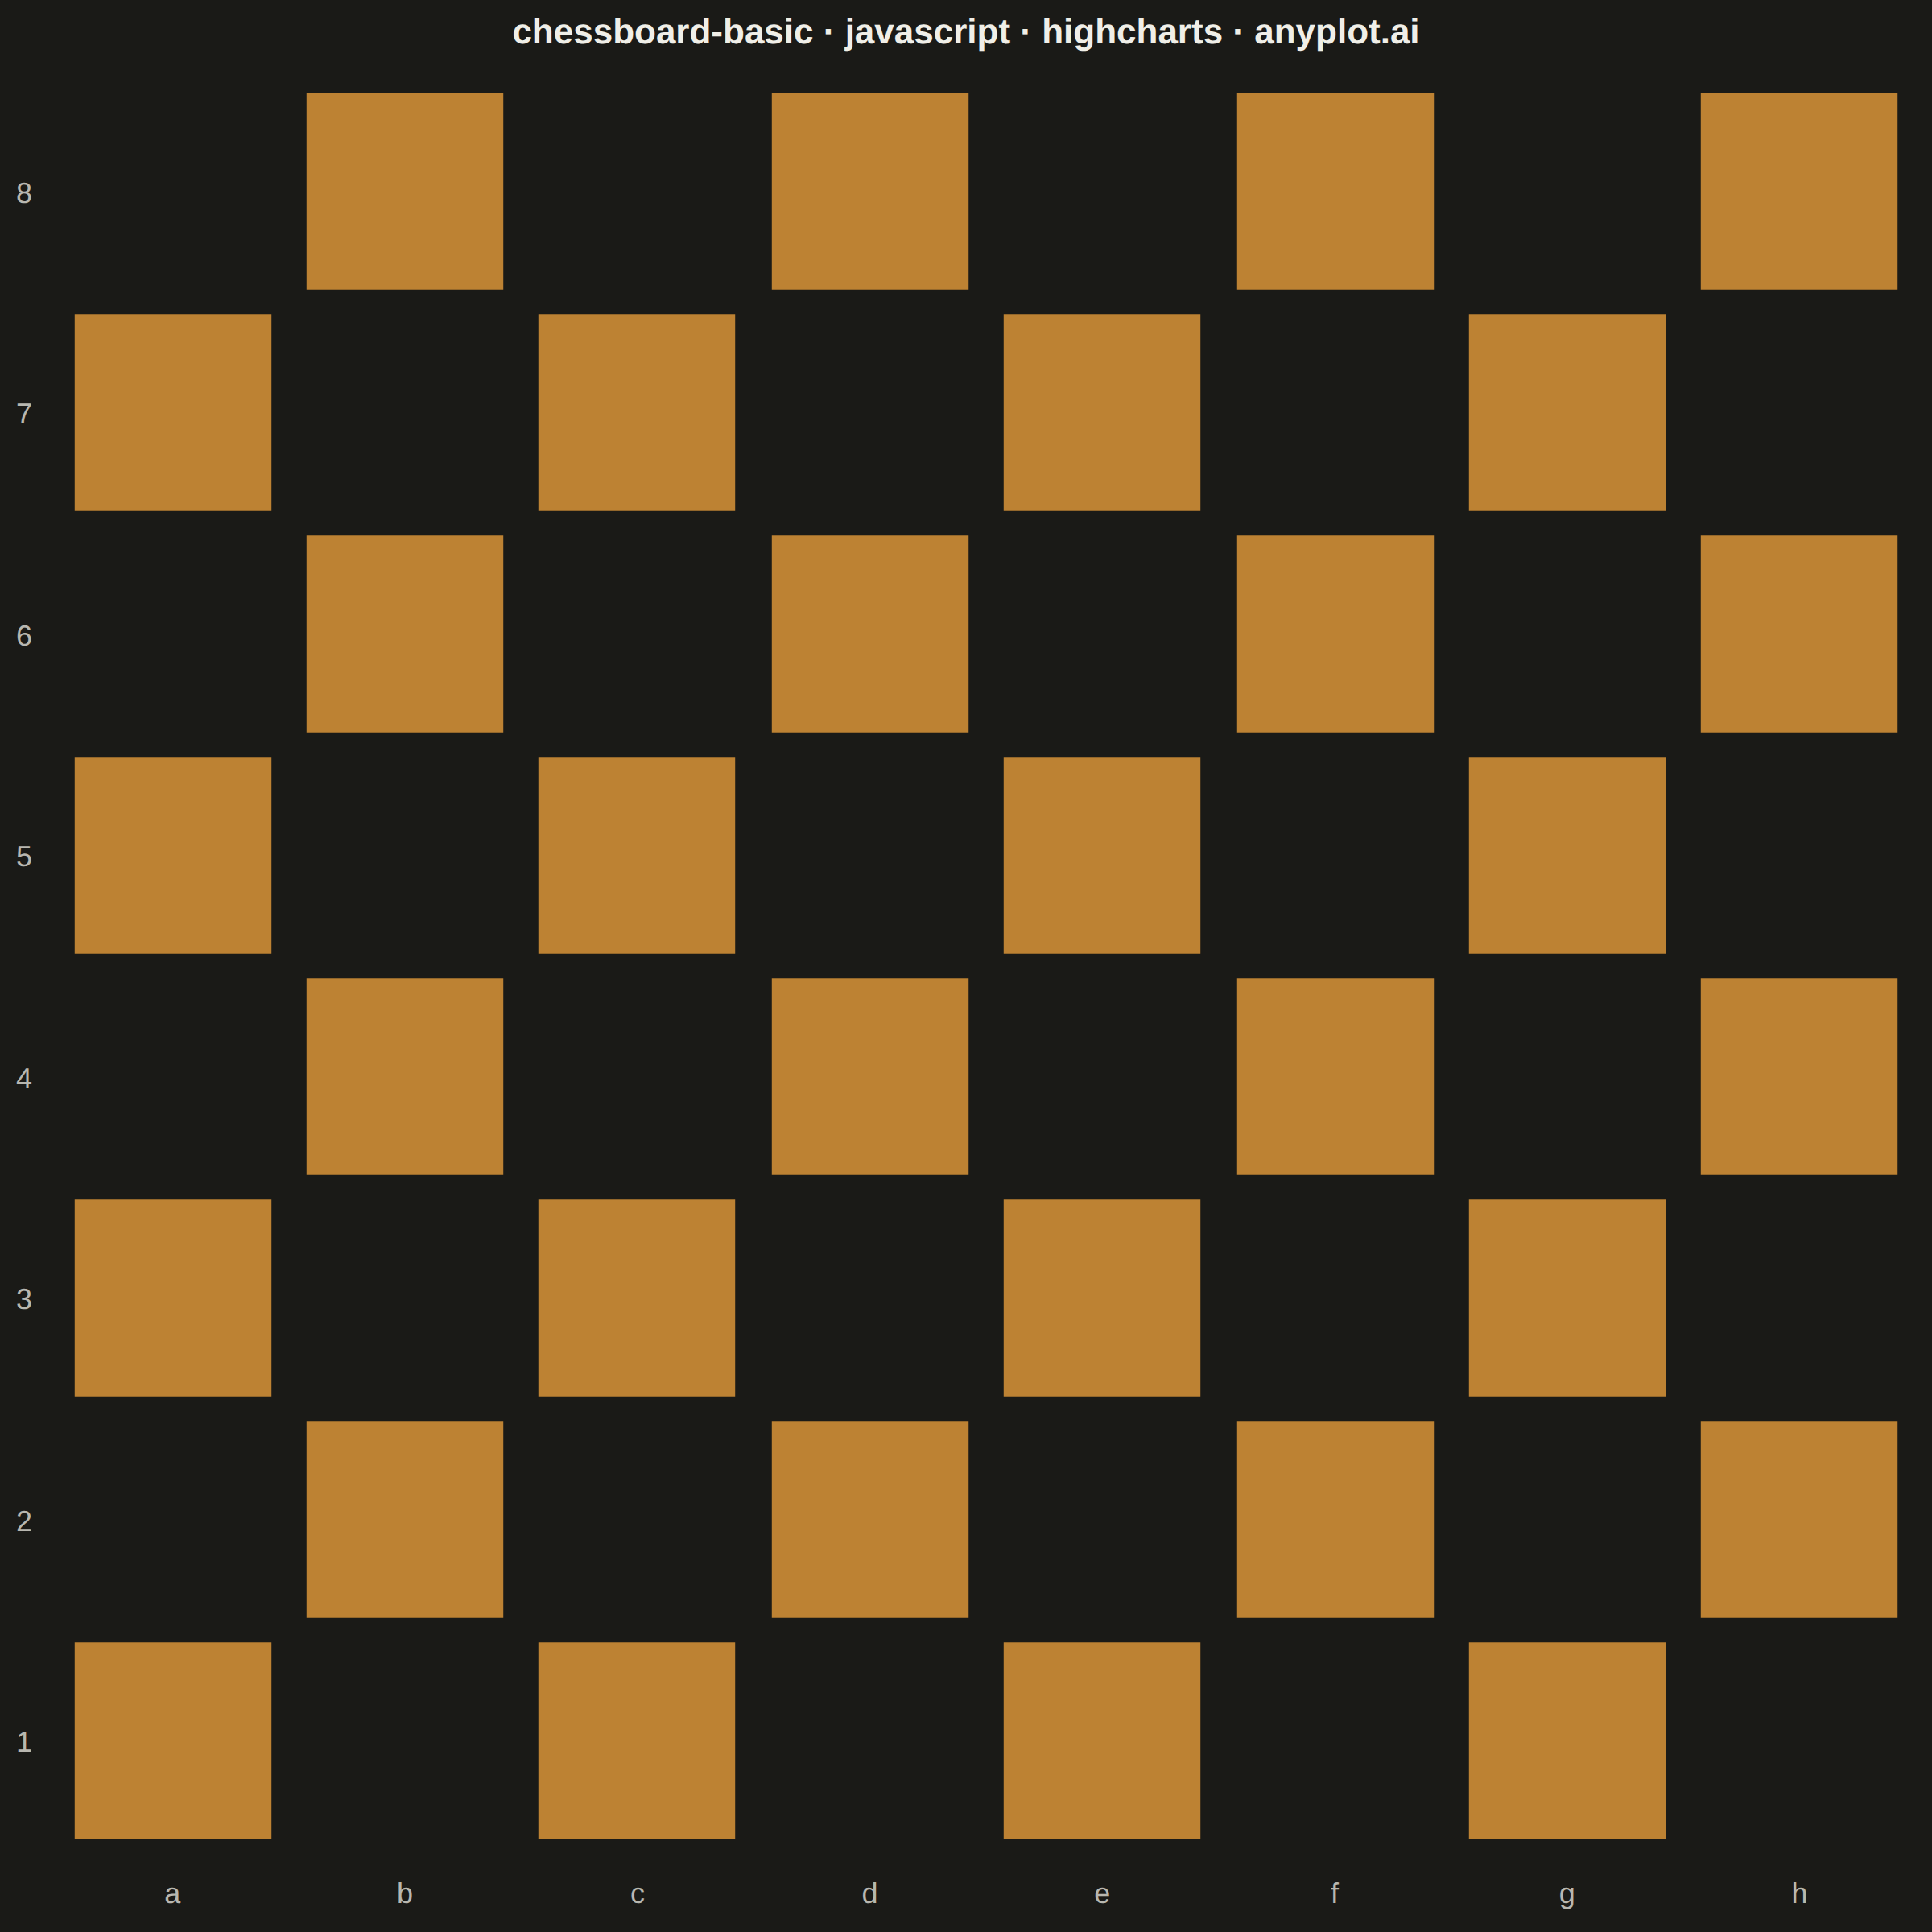
A classic 8x8 chess board with alternating light and dark squares, labeled with standard algebraic notation (columns a-h, rows 1-8). This clean grid visualization serves as a foundation for chess diagrams, game position displays, and educational chess materials.
// anyplot.ai
// chessboard-basic: Chess Board Grid Visualization
// Library: highcharts 12.6.0 | JavaScript 22.23.2
// Quality: 88/100 | Created: 2026-09-01
//# anyplot-orientation: square
// anyplot.ai
// chessboard-basic: Chess Board Grid Visualization
// Library: Highcharts 12.6.0 | Node 22
// License: Highcharts — commercial license, free for non-commercial use (highcharts.com/license)
// Quality: pending | Created: 2026-09-01

const t = window.ANYPLOT_TOKENS;

// --- Data (in-memory, deterministic) ----------------------------------------
const files = ["a", "b", "c", "d", "e", "f", "g", "h"];
const ranks = ["1", "2", "3", "4", "5", "6", "7", "8"];

// Only the dark squares are rendered as points — the light squares are the
// plain page background showing through, so the two-tone contrast comes from
// the surface rather than a second invented data color. Standard chess
// coloring puts light squares on h1 and a8, so a square is dark when the
// file index + rank index is even.
const darkSquares = [];
for (let file = 0; file < 8; file++) {
  for (let rank = 0; rank < 8; rank++) {
    if ((file + rank) % 2 === 0) {
      darkSquares.push({ x: file, y: rank, name: files[file] + ranks[rank] });
    }
  }
}

// --- Chart -------------------------------------------------------------------
Highcharts.chart("container", {
  chart: {
    type: "scatter",
    backgroundColor: "transparent",
    animation: false,
    style: { fontFamily: "inherit" },
    events: {
      load: function () {
        // Square markers are sized in pixels, not data units, so the exact
        // tile size is only known once the plot area is laid out. Category
        // axes reserve 0.5 units of padding on each side by default, so each
        // of the 8 cells spans plotSize / 9 pixels — size the marker radius
        // to that so adjacent squares tile edge-to-edge with no gaps.
        const cell = Math.min(this.plotSizeX, this.plotSizeY) / 9;
        this.series[0].points.forEach((point) => {
          point.update({ marker: { radius: cell / 2 } }, false);
        });
        this.redraw();
      },
    },
  },
  credits: { enabled: false },
  colors: t.palette,
  title: {
    text: "chessboard-basic · javascript · highcharts · anyplot.ai",
    style: { color: t.ink, fontSize: "22px", fontWeight: "600" },
  },
  xAxis: {
    categories: files,
    lineWidth: 0,
    tickLength: 0,
    gridLineWidth: 0,
    labels: { style: { color: t.inkSoft, fontSize: "18px" } },
  },
  yAxis: {
    categories: ranks,
    lineWidth: 0,
    tickLength: 0,
    gridLineWidth: 0,
    title: { text: null },
    labels: { style: { color: t.inkSoft, fontSize: "18px" } },
  },
  legend: { enabled: false },
  tooltip: {
    backgroundColor: t.elevatedBg,
    style: { color: t.ink, fontSize: "14px" },
    formatter: function () {
      return "Square " + this.point.name;
    },
  },
  plotOptions: {
    series: { animation: false, states: { hover: { enabled: false } } },
  },
  series: [
    {
      name: "Dark squares",
      data: darkSquares,
      // Semantic exception (default-style-guide.md): wood -> ochre, not the
      // ordinal-first brand green, so the board reads as an authentic chess
      // board rather than an abstract checker grid.
      color: t.palette[3],
      marker: { symbol: "square", radius: 40, lineWidth: 0 },
    },
  ],
});
Runnable source as JSON, for any HTTP client: https://api.anyplot.ai/specs/chessboard-basic/highcharts/code. Any spec id and library id listed in llms-full.txt fit the same URL shape; every URL below is complete and callable.
{
  "spec_id": "chessboard-basic",
  "language": "javascript",
  "library": "highcharts",
  "page": "https://anyplot.ai/chessboard-basic/javascript/highcharts",
  "hub": "https://anyplot.ai/chessboard-basic",
  "code_json": "https://api.anyplot.ai/specs/chessboard-basic/highcharts/code",
  "spec_json": "https://api.anyplot.ai/specs/chessboard-basic",
  "render_light_png": "https://storage.googleapis.com/anyplot-images/plots/chessboard-basic/javascript/highcharts/plot-light.png",
  "render_dark_png": "https://storage.googleapis.com/anyplot-images/plots/chessboard-basic/javascript/highcharts/plot-dark.png",
  "interactive_light_html": "https://storage.googleapis.com/anyplot-images/plots/chessboard-basic/javascript/highcharts/plot-light.html",
  "interactive_dark_html": "https://storage.googleapis.com/anyplot-images/plots/chessboard-basic/javascript/highcharts/plot-dark.html",
  "quality_score": 88.0,
  "license": "MIT",
  "guide": "https://anyplot.ai/llms.txt"
}
Part of Chess Board Grid Visualization on anyplot.ai.