The same plot in 14 other libraries — JavaScript: Chart.js, D3.js, Apache ECharts, Highcharts; Python: Altair, Bokeh, lets-plot, Matplotlib, Plotly, plotnine, Pygal, Seaborn; R: ggplot2; Julia: Makie.jl. Compare all 15 side by side: Chess Board Grid Visualization in Python, R, Julia and JavaScript.
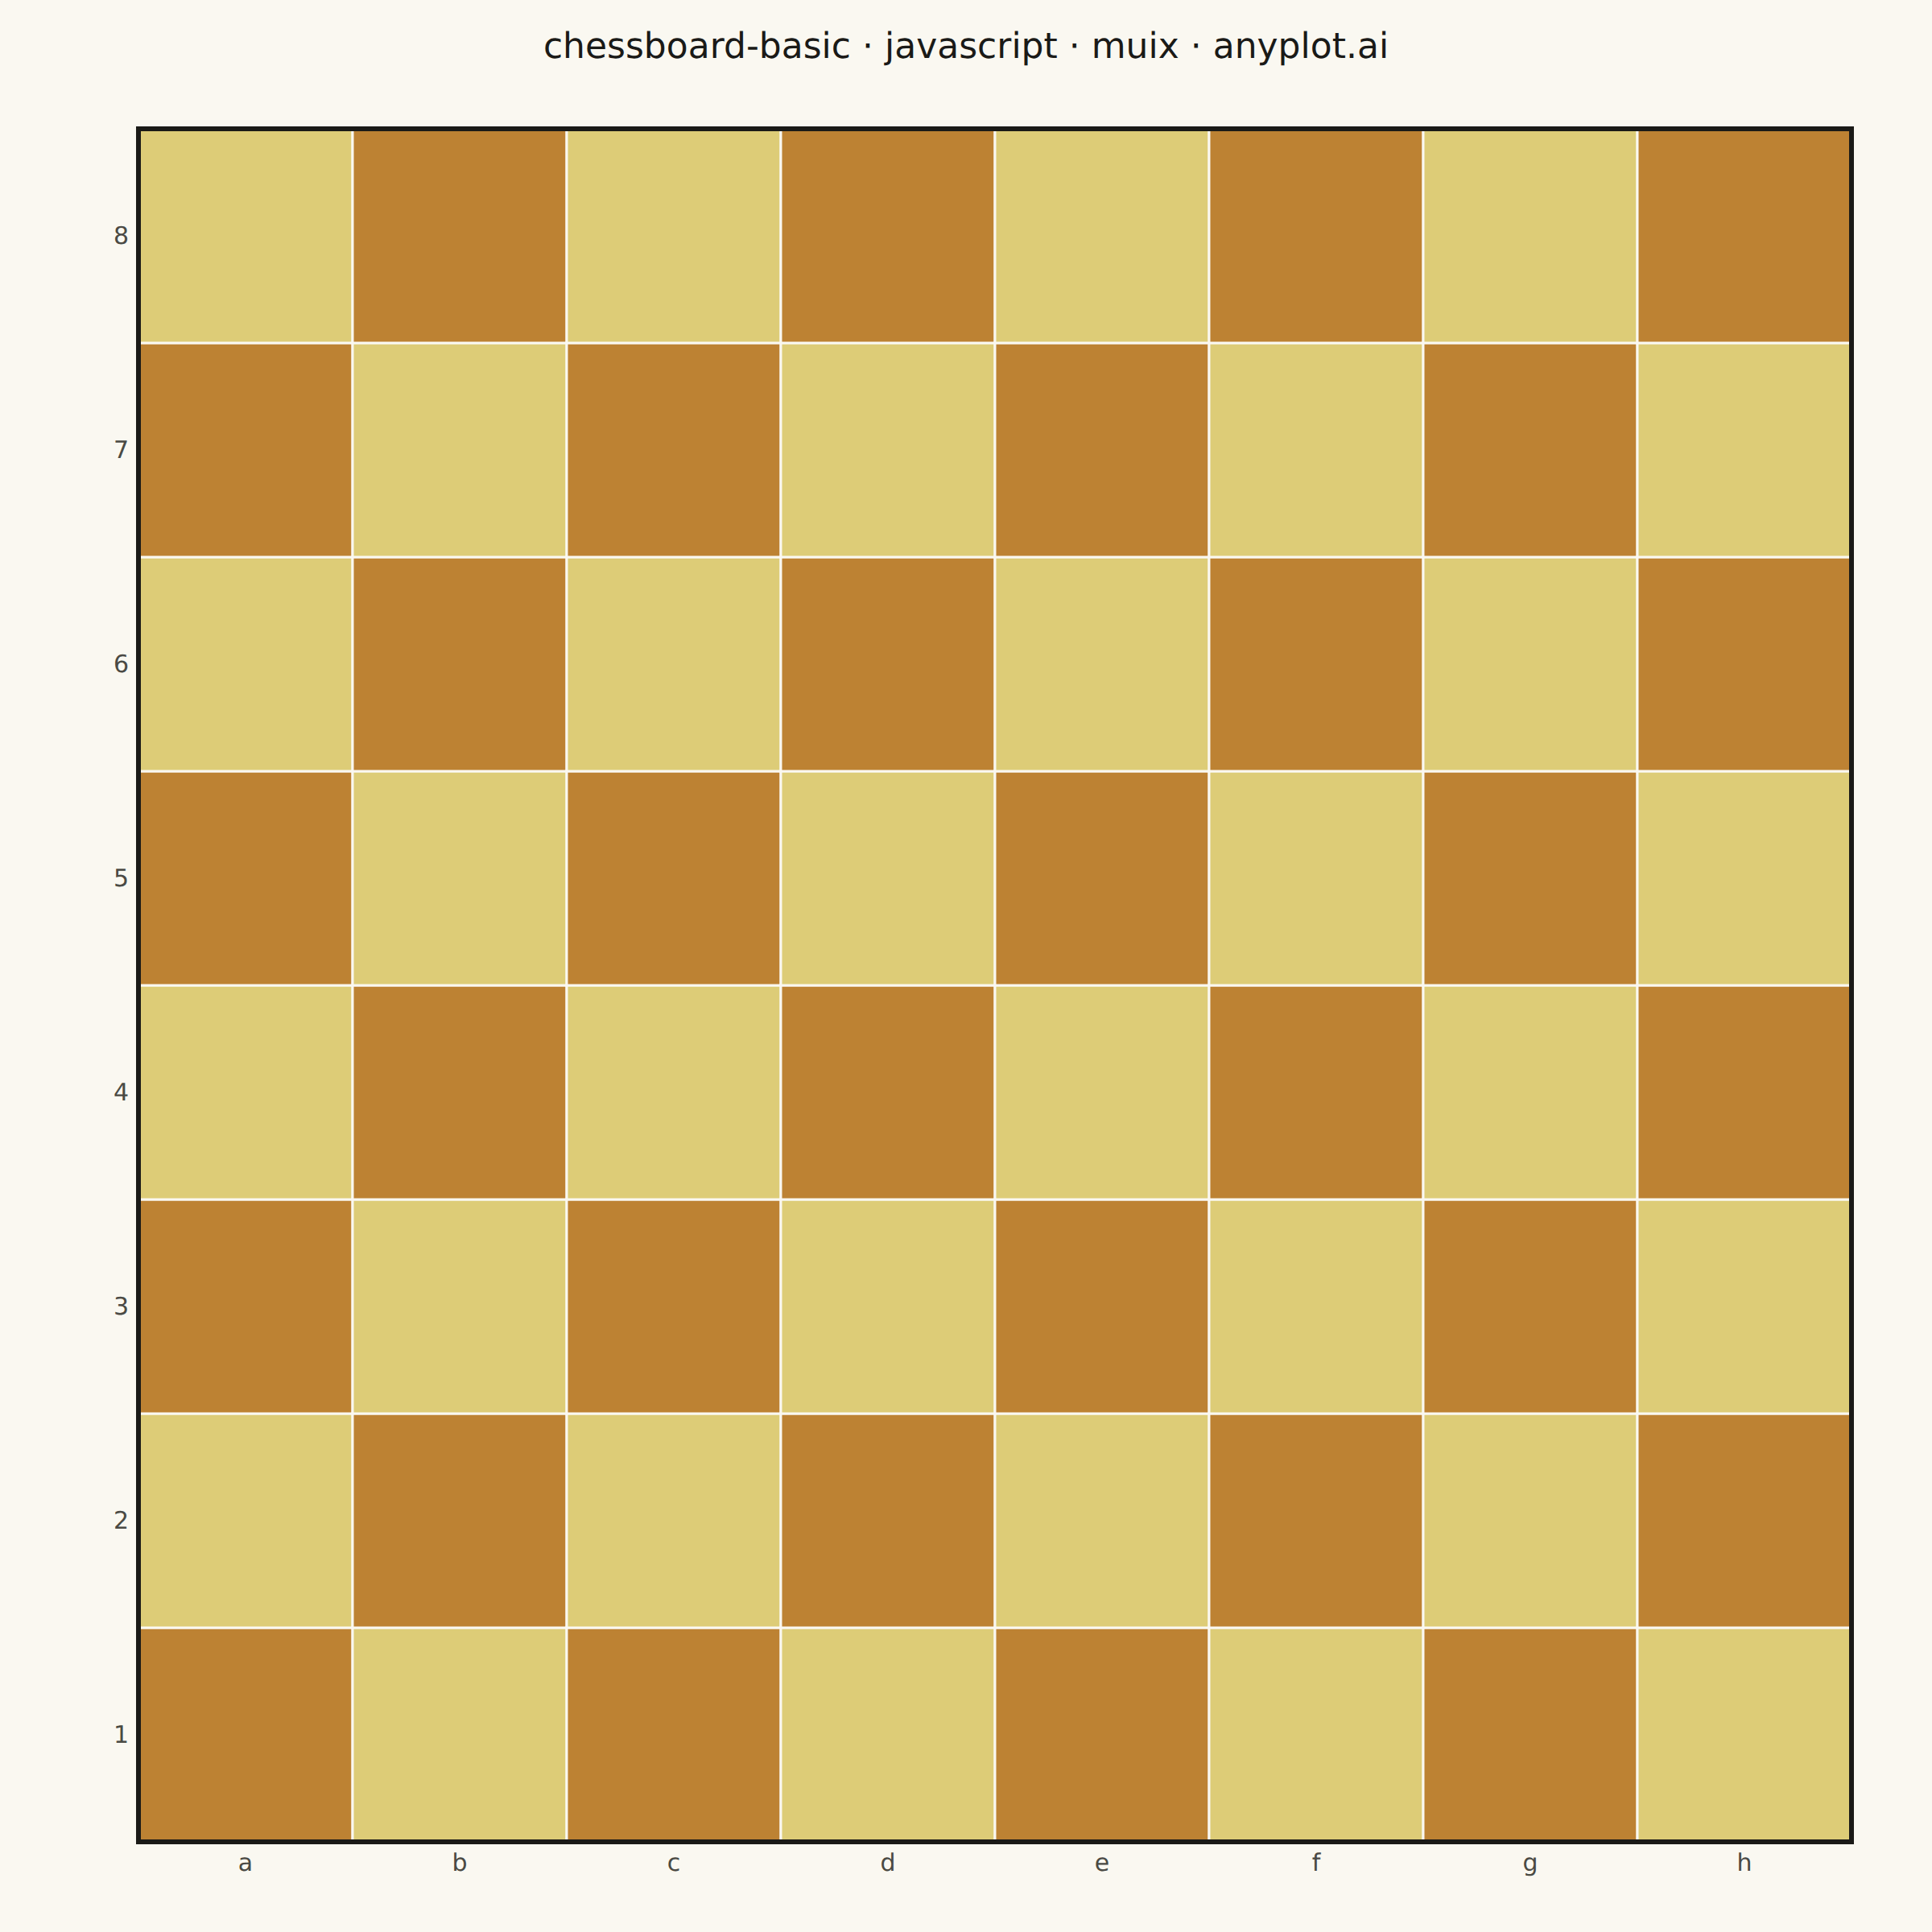
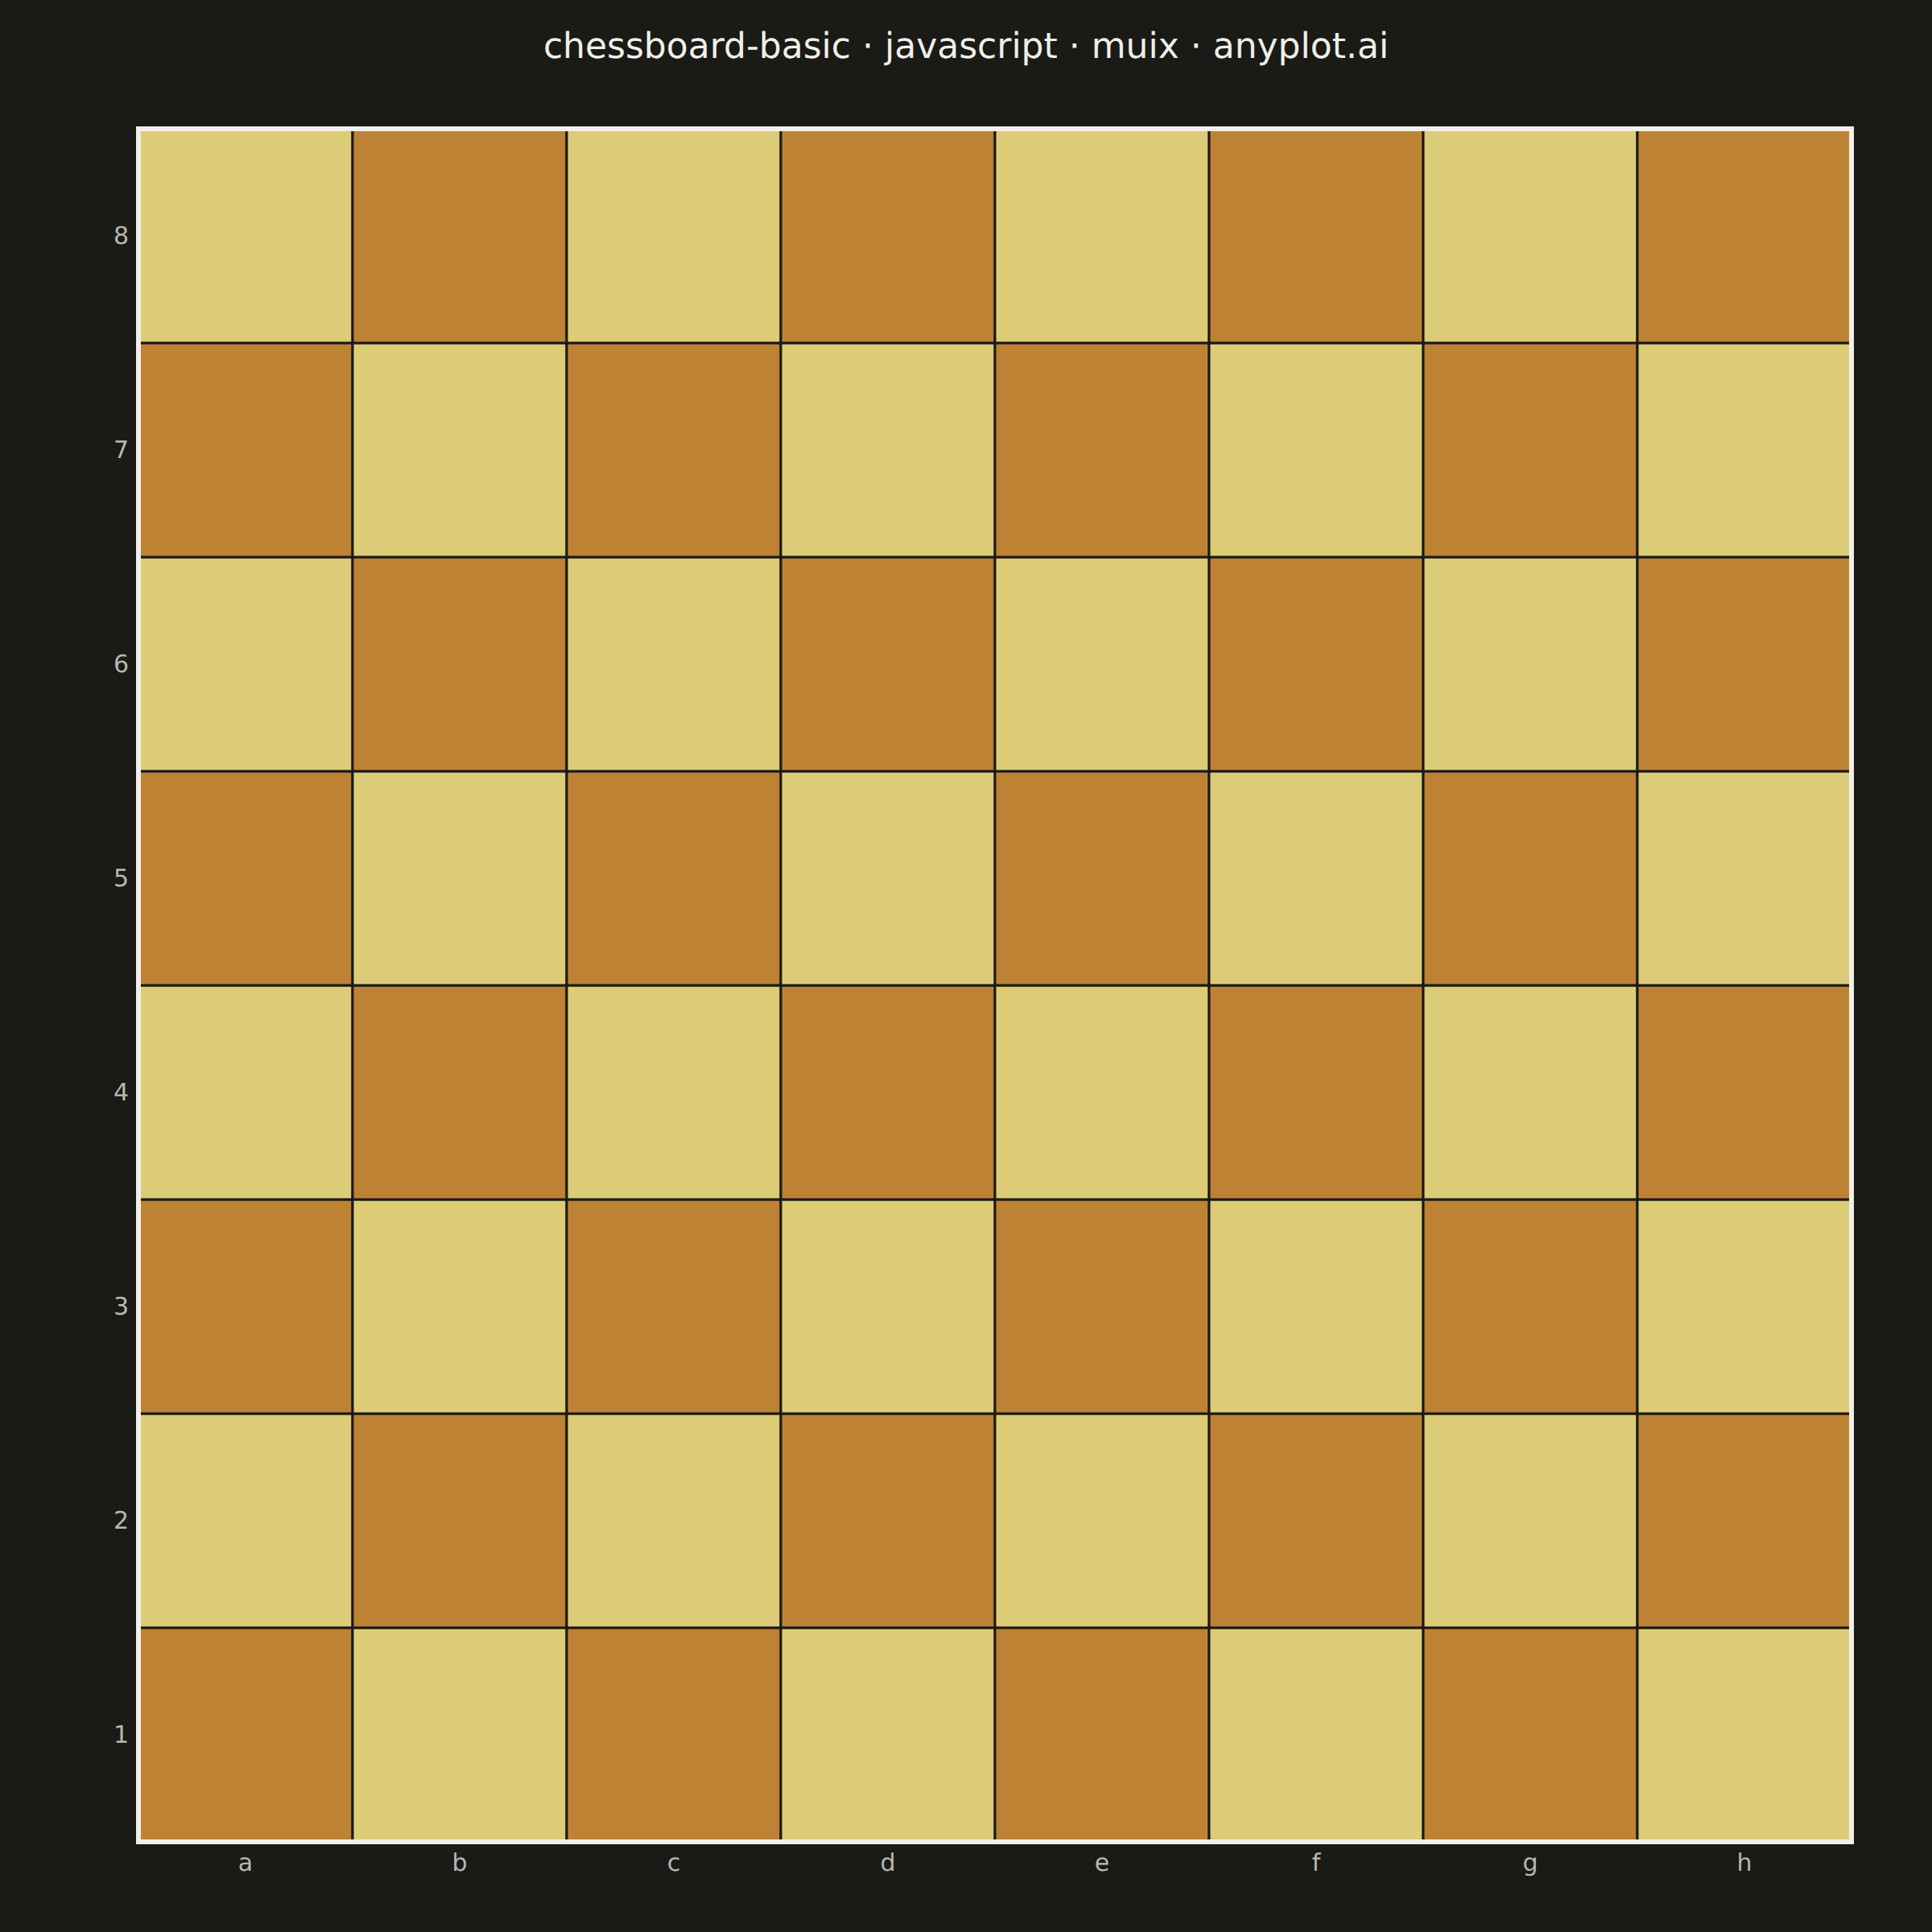
A classic 8x8 chess board with alternating light and dark squares, labeled with standard algebraic notation (columns a-h, rows 1-8). This clean grid visualization serves as a foundation for chess diagrams, game position displays, and educational chess materials.
// anyplot.ai
// chessboard-basic: Chess Board Grid Visualization
// Library: muix 7.29.1 | JavaScript 22.23.2
// Quality: 90/100 | Created: 2026-09-01
//# anyplot-orientation: square
// anyplot.ai
// chessboard-basic: Chess Board Grid Visualization
// Library: MUI X Charts | React | Node 22
// License: @mui/x-charts — MIT (community). Pro/Premium are out of scope.
// Quality: pending | Created: 2026-09-01

import { ChartContainer } from "@mui/x-charts/ChartContainer";
import { ScatterPlot } from "@mui/x-charts/ScatterChart";
import { ChartsXAxis } from "@mui/x-charts/ChartsXAxis";
import { ChartsYAxis } from "@mui/x-charts/ChartsYAxis";

const t = window.ANYPLOT_TOKENS;
const FONT = "system-ui, -apple-system, sans-serif";
const TITLE = "chessboard-basic · javascript · muix · anyplot.ai";

// Classic wood-board colors, drawn from the Imprint palette's semantic
// exception (wood → ochre) plus the amber anchor for the lighter square —
// both fixed across themes, like real board colors are.
const DARK_SQUARE = t.palette[3]; // "#BD8233" — ochre, wood
const LIGHT_SQUARE = t.amber; // "#DDCC77" — warm light wood

const COLUMNS = ["a", "b", "c", "d", "e", "f", "g", "h"];
const RANKS_TOP_TO_BOTTOM = ["8", "7", "6", "5", "4", "3", "2", "1"];

// 64 squares — a1 is dark, h1 is light (white's near-right corner), matching
// standard chess-diagram convention. Square parity: (file index + rank - 1)
// odd -> light square.
const squares = [];
COLUMNS.forEach((file, fileIdx) => {
  for (let rank = 1; rank <= 8; rank += 1) {
    const light = (fileIdx + rank - 1) % 2 === 1;
    squares.push({ id: `${file}${rank}`, x: file, y: String(rank), light });
  }
});

// Custom scatter mark: opaque squares tiling the band grid exactly (no gaps),
// colored by the precomputed light/dark parity rather than a data value.
function BoardSquares({ series, xScale, yScale }) {
  const cellW = xScale.bandwidth();
  const cellH = yScale.bandwidth();
  return (
    <g>
      {series.data.map((pt) => (
        <rect
          key={pt.id}
          x={xScale(pt.x) ?? 0}
          y={yScale(pt.y) ?? 0}
          width={cellW}
          height={cellH}
          fill={pt.light ? LIGHT_SQUARE : DARK_SQUARE}
          stroke={t.pageBg}
          strokeWidth={1.5}
        />
      ))}
    </g>
  );
}

export default function Chart() {
  const W = window.ANYPLOT_SIZE.width;
  const H = window.ANYPLOT_SIZE.height;

  // Reserve space for the title (top), rank labels (left) and file labels
  // (bottom), then size the board to the largest square that fits the
  // remaining area so every one of the 64 cells is a true square.
  const TITLE_SPACE = 60;
  const PAD_TOP = 20;
  const PAD_RIGHT = 24;
  const AXIS_LEFT = 60;
  const AXIS_BOTTOM = 56;

  const availW = W - AXIS_LEFT - PAD_RIGHT;
  const availH = H - TITLE_SPACE - PAD_TOP - AXIS_BOTTOM;
  const board = Math.min(availW, availH);

  const margin = {
    left: AXIS_LEFT + (availW - board) / 2,
    right: PAD_RIGHT + (availW - board) / 2,
    top: TITLE_SPACE + PAD_TOP + (availH - board) / 2,
    bottom: AXIS_BOTTOM + (availH - board) / 2,
  };

  return (
    <ChartContainer
      width={W}
      height={H}
      margin={margin}
      skipAnimation
      series={[
        {
          type: "scatter",
          id: "board",
          data: squares,
          color: DARK_SQUARE,
        },
      ]}
      xAxis={[
        {
          scaleType: "band",
          data: COLUMNS,
          categoryGapRatio: 0,
          disableTicks: true,
          tickLabelStyle: { fontSize: 15, fill: t.inkSoft, fontFamily: FONT },
        },
      ]}
      yAxis={[
        {
          scaleType: "band",
          data: RANKS_TOP_TO_BOTTOM,
          categoryGapRatio: 0,
          disableTicks: true,
          tickLabelStyle: { fontSize: 15, fill: t.inkSoft, fontFamily: FONT },
        },
      ]}
    >
      {/* Chart title */}
      <text
        x={W / 2}
        y={36}
        textAnchor="middle"
        fontSize={22}
        fontWeight="500"
        fill={t.ink}
        fontFamily={FONT}
      >
        {TITLE}
      </text>

      {/* Checkerboard squares, tiled edge-to-edge across the 8x8 band grid */}
      <ScatterPlot slots={{ scatter: BoardSquares }} />

      {/* Outer board frame */}
      <rect
        x={margin.left}
        y={margin.top}
        width={board}
        height={board}
        fill="none"
        stroke={t.ink}
        strokeWidth={3}
      />

      {/* File labels (a-h) at the bottom, rank labels (1-8) on the left */}
      <ChartsXAxis disableLine tickLabelStyle={{ fontSize: 15, fill: t.inkSoft, fontFamily: FONT }} />
      <ChartsYAxis disableLine tickLabelStyle={{ fontSize: 15, fill: t.inkSoft, fontFamily: FONT }} />
    </ChartContainer>
  );
}
Runnable source as JSON, for any HTTP client: https://api.anyplot.ai/specs/chessboard-basic/muix/code. Any spec id and library id listed in llms-full.txt fit the same URL shape; every URL below is complete and callable.
{
  "spec_id": "chessboard-basic",
  "language": "javascript",
  "library": "muix",
  "page": "https://anyplot.ai/chessboard-basic/javascript/muix",
  "hub": "https://anyplot.ai/chessboard-basic",
  "code_json": "https://api.anyplot.ai/specs/chessboard-basic/muix/code",
  "spec_json": "https://api.anyplot.ai/specs/chessboard-basic",
  "render_light_png": "https://storage.googleapis.com/anyplot-images/plots/chessboard-basic/javascript/muix/plot-light.png",
  "render_dark_png": "https://storage.googleapis.com/anyplot-images/plots/chessboard-basic/javascript/muix/plot-dark.png",
  "interactive_light_html": "https://storage.googleapis.com/anyplot-images/plots/chessboard-basic/javascript/muix/plot-light.html",
  "interactive_dark_html": "https://storage.googleapis.com/anyplot-images/plots/chessboard-basic/javascript/muix/plot-dark.html",
  "quality_score": 90.0,
  "license": "MIT",
  "guide": "https://anyplot.ai/llms.txt"
}
Part of Chess Board Grid Visualization on anyplot.ai.