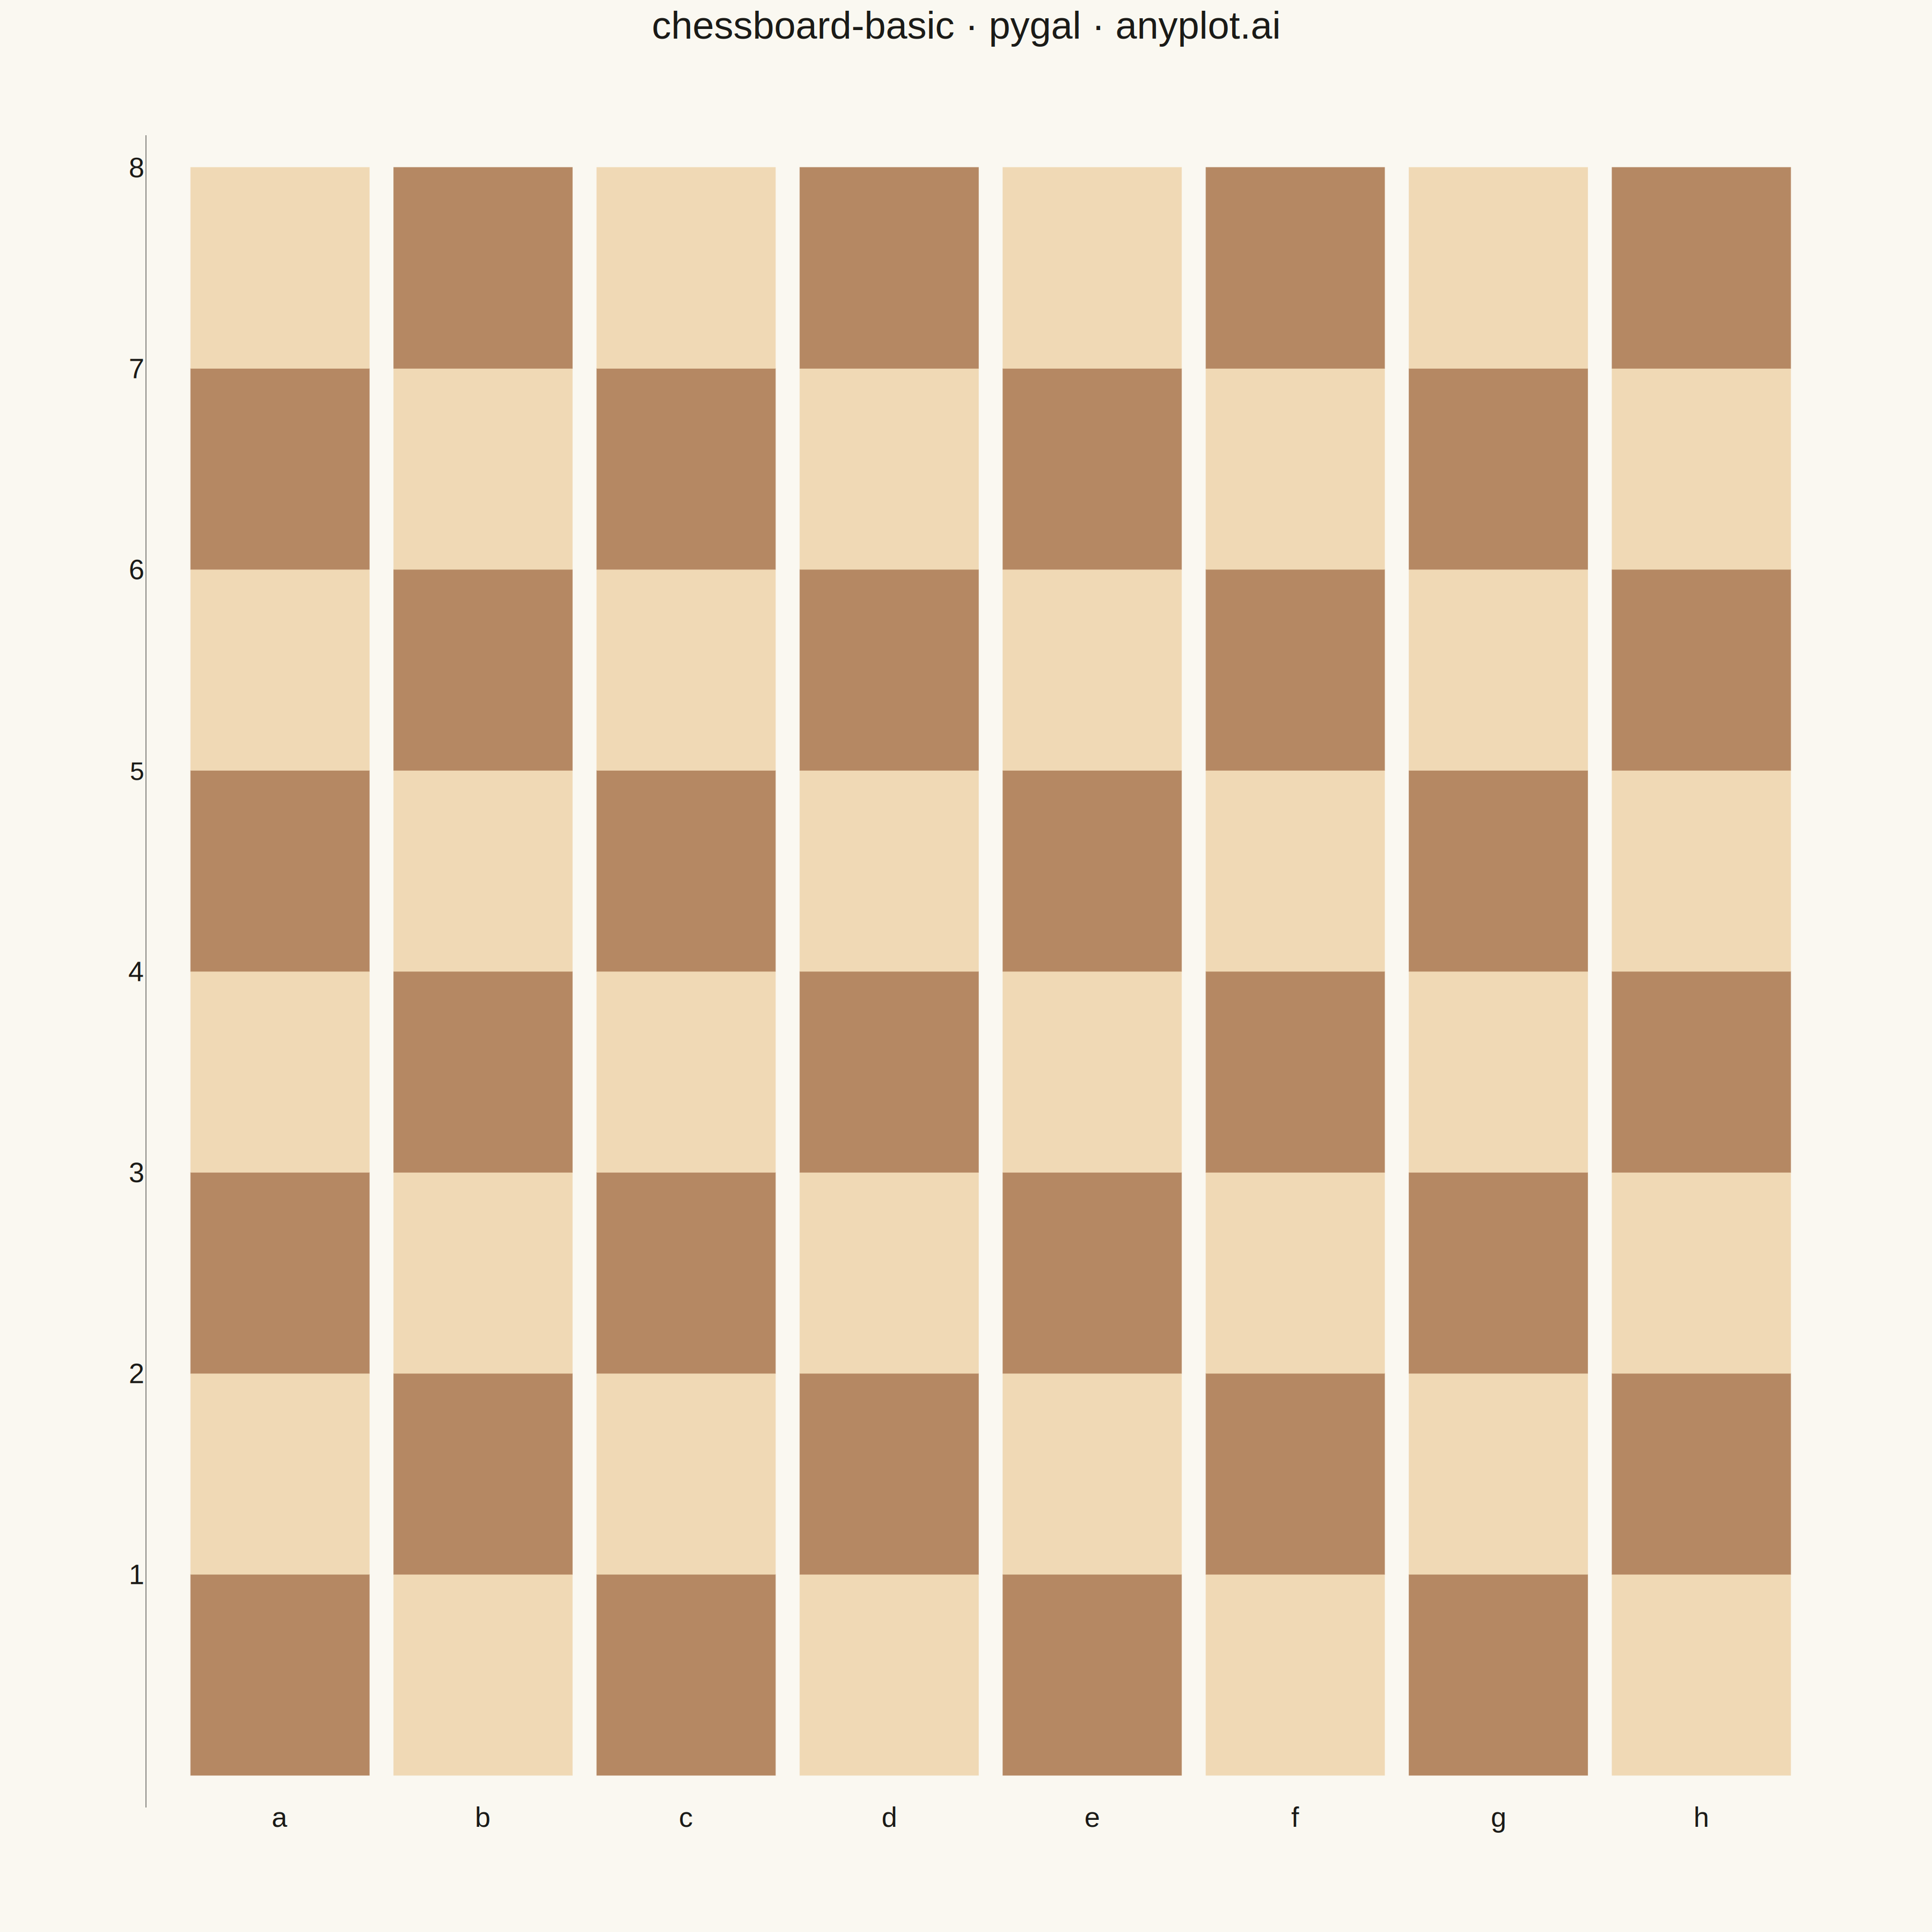
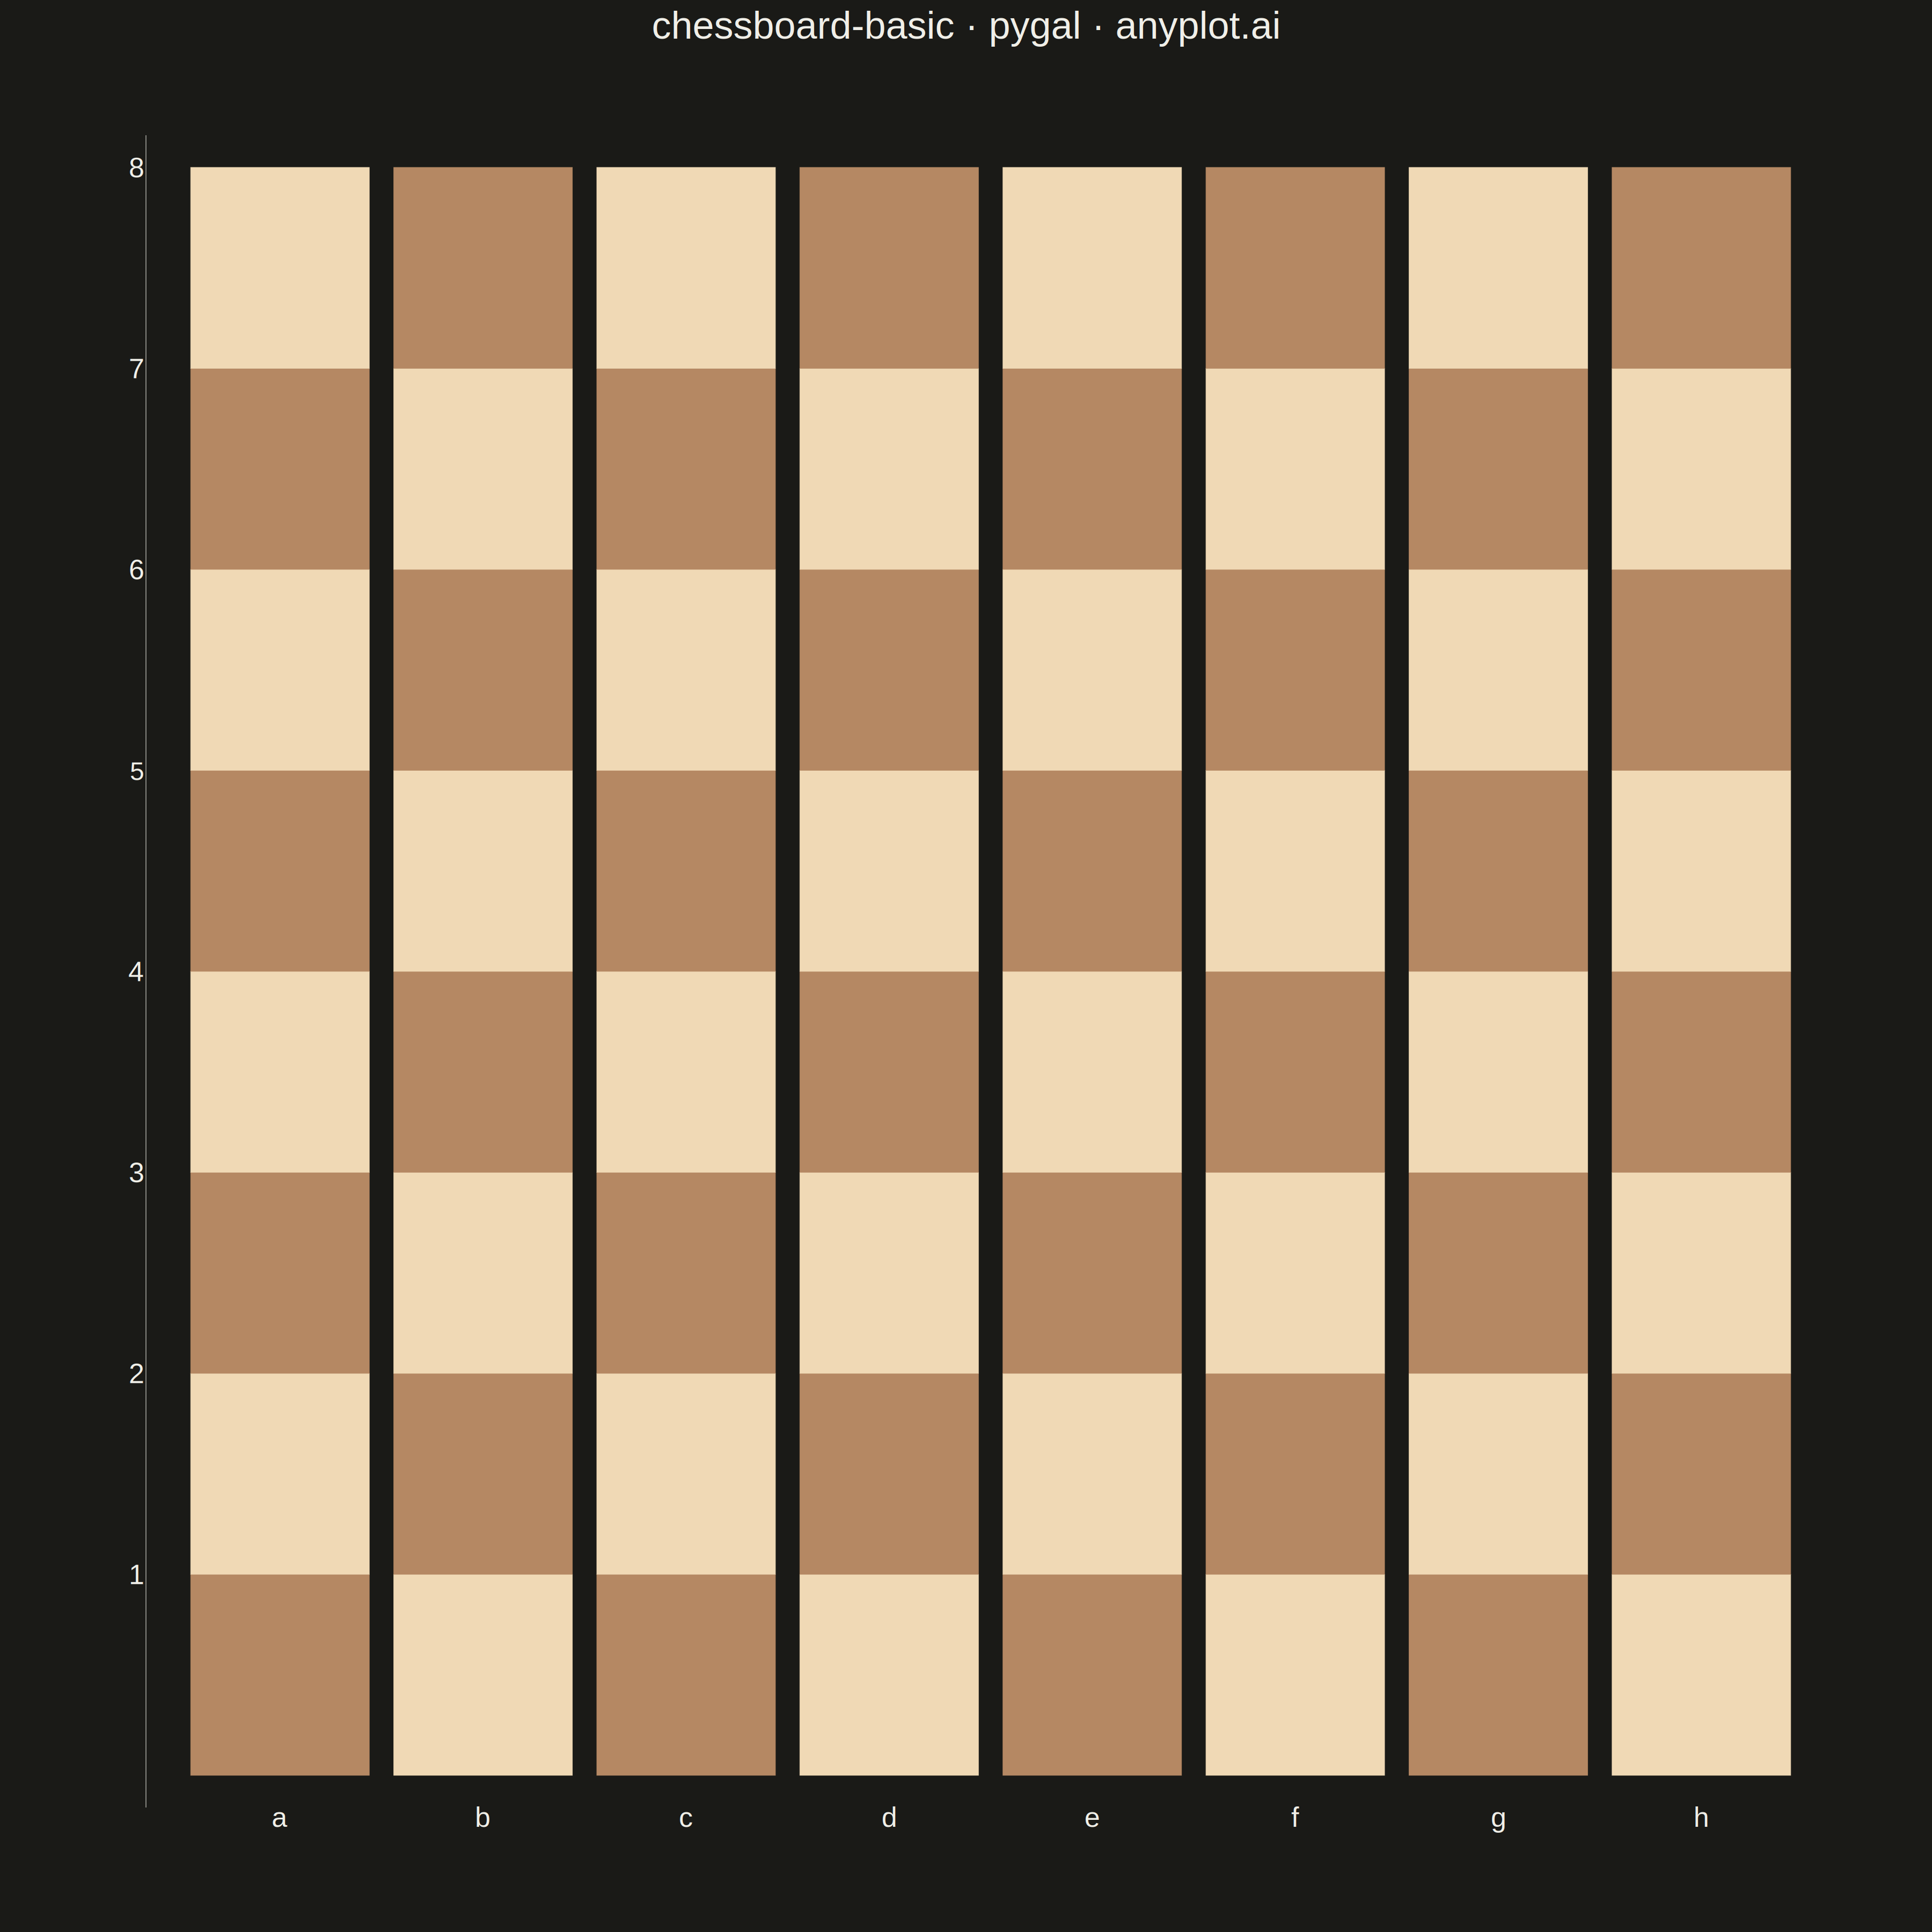
A classic 8x8 chess board with alternating light and dark squares, labeled with standard algebraic notation (columns a-h, rows 1-8). This clean grid visualization serves as a foundation for chess diagrams, game position displays, and educational chess materials.
""" anyplot.ai
chessboard-basic: Chess Board Grid Visualization
Library: pygal 3.1.0 | Python 3.13.13
Quality: 85/100 | Updated: 2026-05-17
"""

import pygal
from pygal.style import Style


# Chess board configuration
columns = ["a", "b", "c", "d", "e", "f", "g", "h"]

# Classic chess board colors
light_color = "#F0D9B5"  # Cream/tan for light squares
dark_color = "#B58863"  # Brown for dark squares

# Create the board using stacked bars
# Each row is a horizontal bar with 8 stacked colored segments
board = pygal.StackedBar(
    style=Style(
        background="#FFFFFF",
        plot_background="#FFFFFF",
        foreground="#333333",
        foreground_strong="#333333",
        foreground_subtle="#555555",
        title_font_size=72,
        label_font_size=52,
        major_label_font_size=48,
        legend_font_size=0,
        value_font_size=0,
        font_family="Arial",
        opacity=1.0,
        opacity_hover=1.0,
        transition="0s",
    ),
    width=3600,
    height=3600,
    title="chessboard-basic · pygal · pyplots.ai",
    show_legend=False,
    show_y_guides=False,
    show_x_guides=False,
    spacing=0,
    margin=180,
    margin_left=220,
    print_values=False,
    truncate_label=-1,
    y_labels=[1, 2, 3, 4, 5, 6, 7, 8],
    min_scale=1,
)

# X-axis labels (columns a-h at bottom)
board.x_labels = columns

# For StackedBar, each add() creates a layer in the stack
# We need 8 layers, each representing one "row" of the chessboard
# The first add() is at the bottom, last at top

# Build data for each row from row 1 (bottom) to row 8 (top)
for row_num in range(1, 9):
    row_data = []
    for col_idx in range(8):
        # Standard chess: a1 is dark (col_idx=0, row=1: 0+1=1 odd -> dark)
        # h1 is light (col_idx=7, row=1: 7+1=8 even -> light)
        is_light = (col_idx + row_num) % 2 == 0

        color = light_color if is_light else dark_color
        row_data.append({"value": 1, "color": color})

    board.add(str(row_num), row_data)

# Render to files
board.render_to_file("plot.svg")
board.render_to_png("plot.png")
board.render_to_file("plot.html")
Runnable source as JSON, for any HTTP client: https://api.anyplot.ai/specs/chessboard-basic/pygal/code. Any spec id and library id listed in llms-full.txt fit the same URL shape; every URL below is complete and callable.
{
  "spec_id": "chessboard-basic",
  "language": "python",
  "library": "pygal",
  "page": "https://anyplot.ai/chessboard-basic/python/pygal",
  "hub": "https://anyplot.ai/chessboard-basic",
  "code_json": "https://api.anyplot.ai/specs/chessboard-basic/pygal/code",
  "spec_json": "https://api.anyplot.ai/specs/chessboard-basic",
  "render_light_png": "https://storage.googleapis.com/anyplot-images/plots/chessboard-basic/python/pygal/plot-light.png",
  "render_dark_png": "https://storage.googleapis.com/anyplot-images/plots/chessboard-basic/python/pygal/plot-dark.png",
  "interactive_light_html": "https://storage.googleapis.com/anyplot-images/plots/chessboard-basic/python/pygal/plot-light.html",
  "interactive_dark_html": "https://storage.googleapis.com/anyplot-images/plots/chessboard-basic/python/pygal/plot-dark.html",
  "quality_score": 85.0,
  "license": "MIT",
  "guide": "https://anyplot.ai/llms.txt"
}
Part of Chess Board Grid Visualization on anyplot.ai.