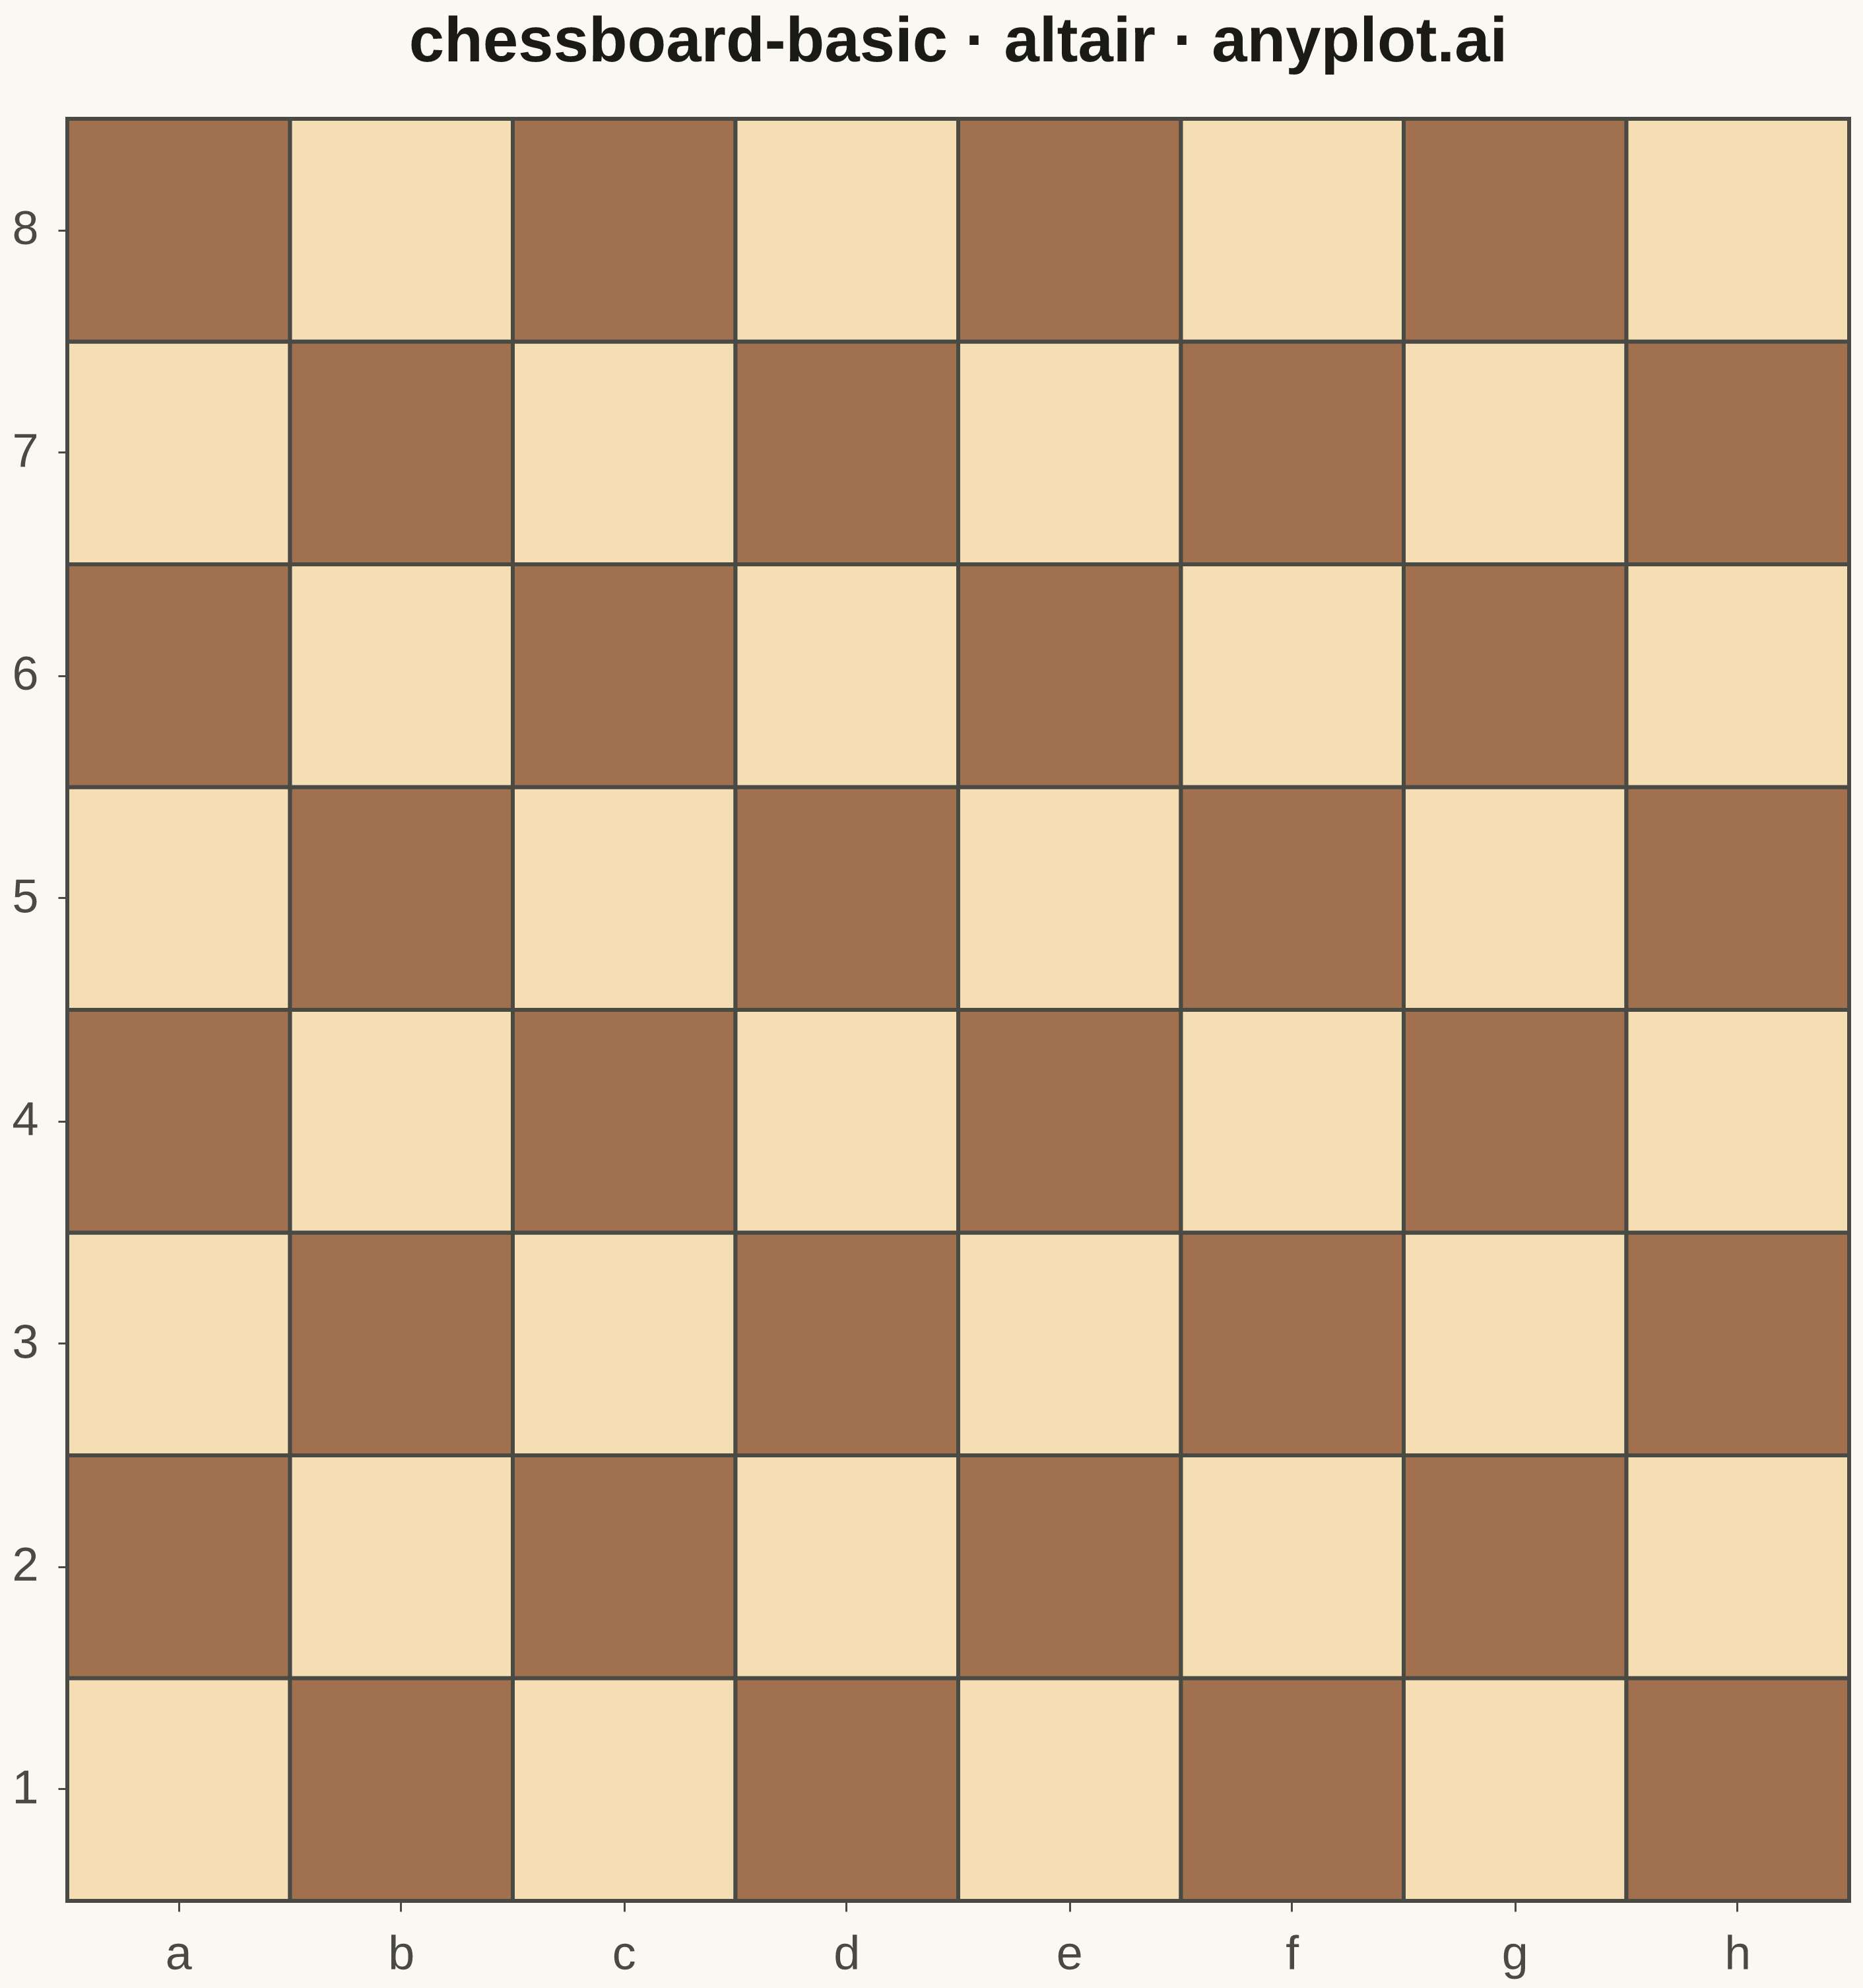
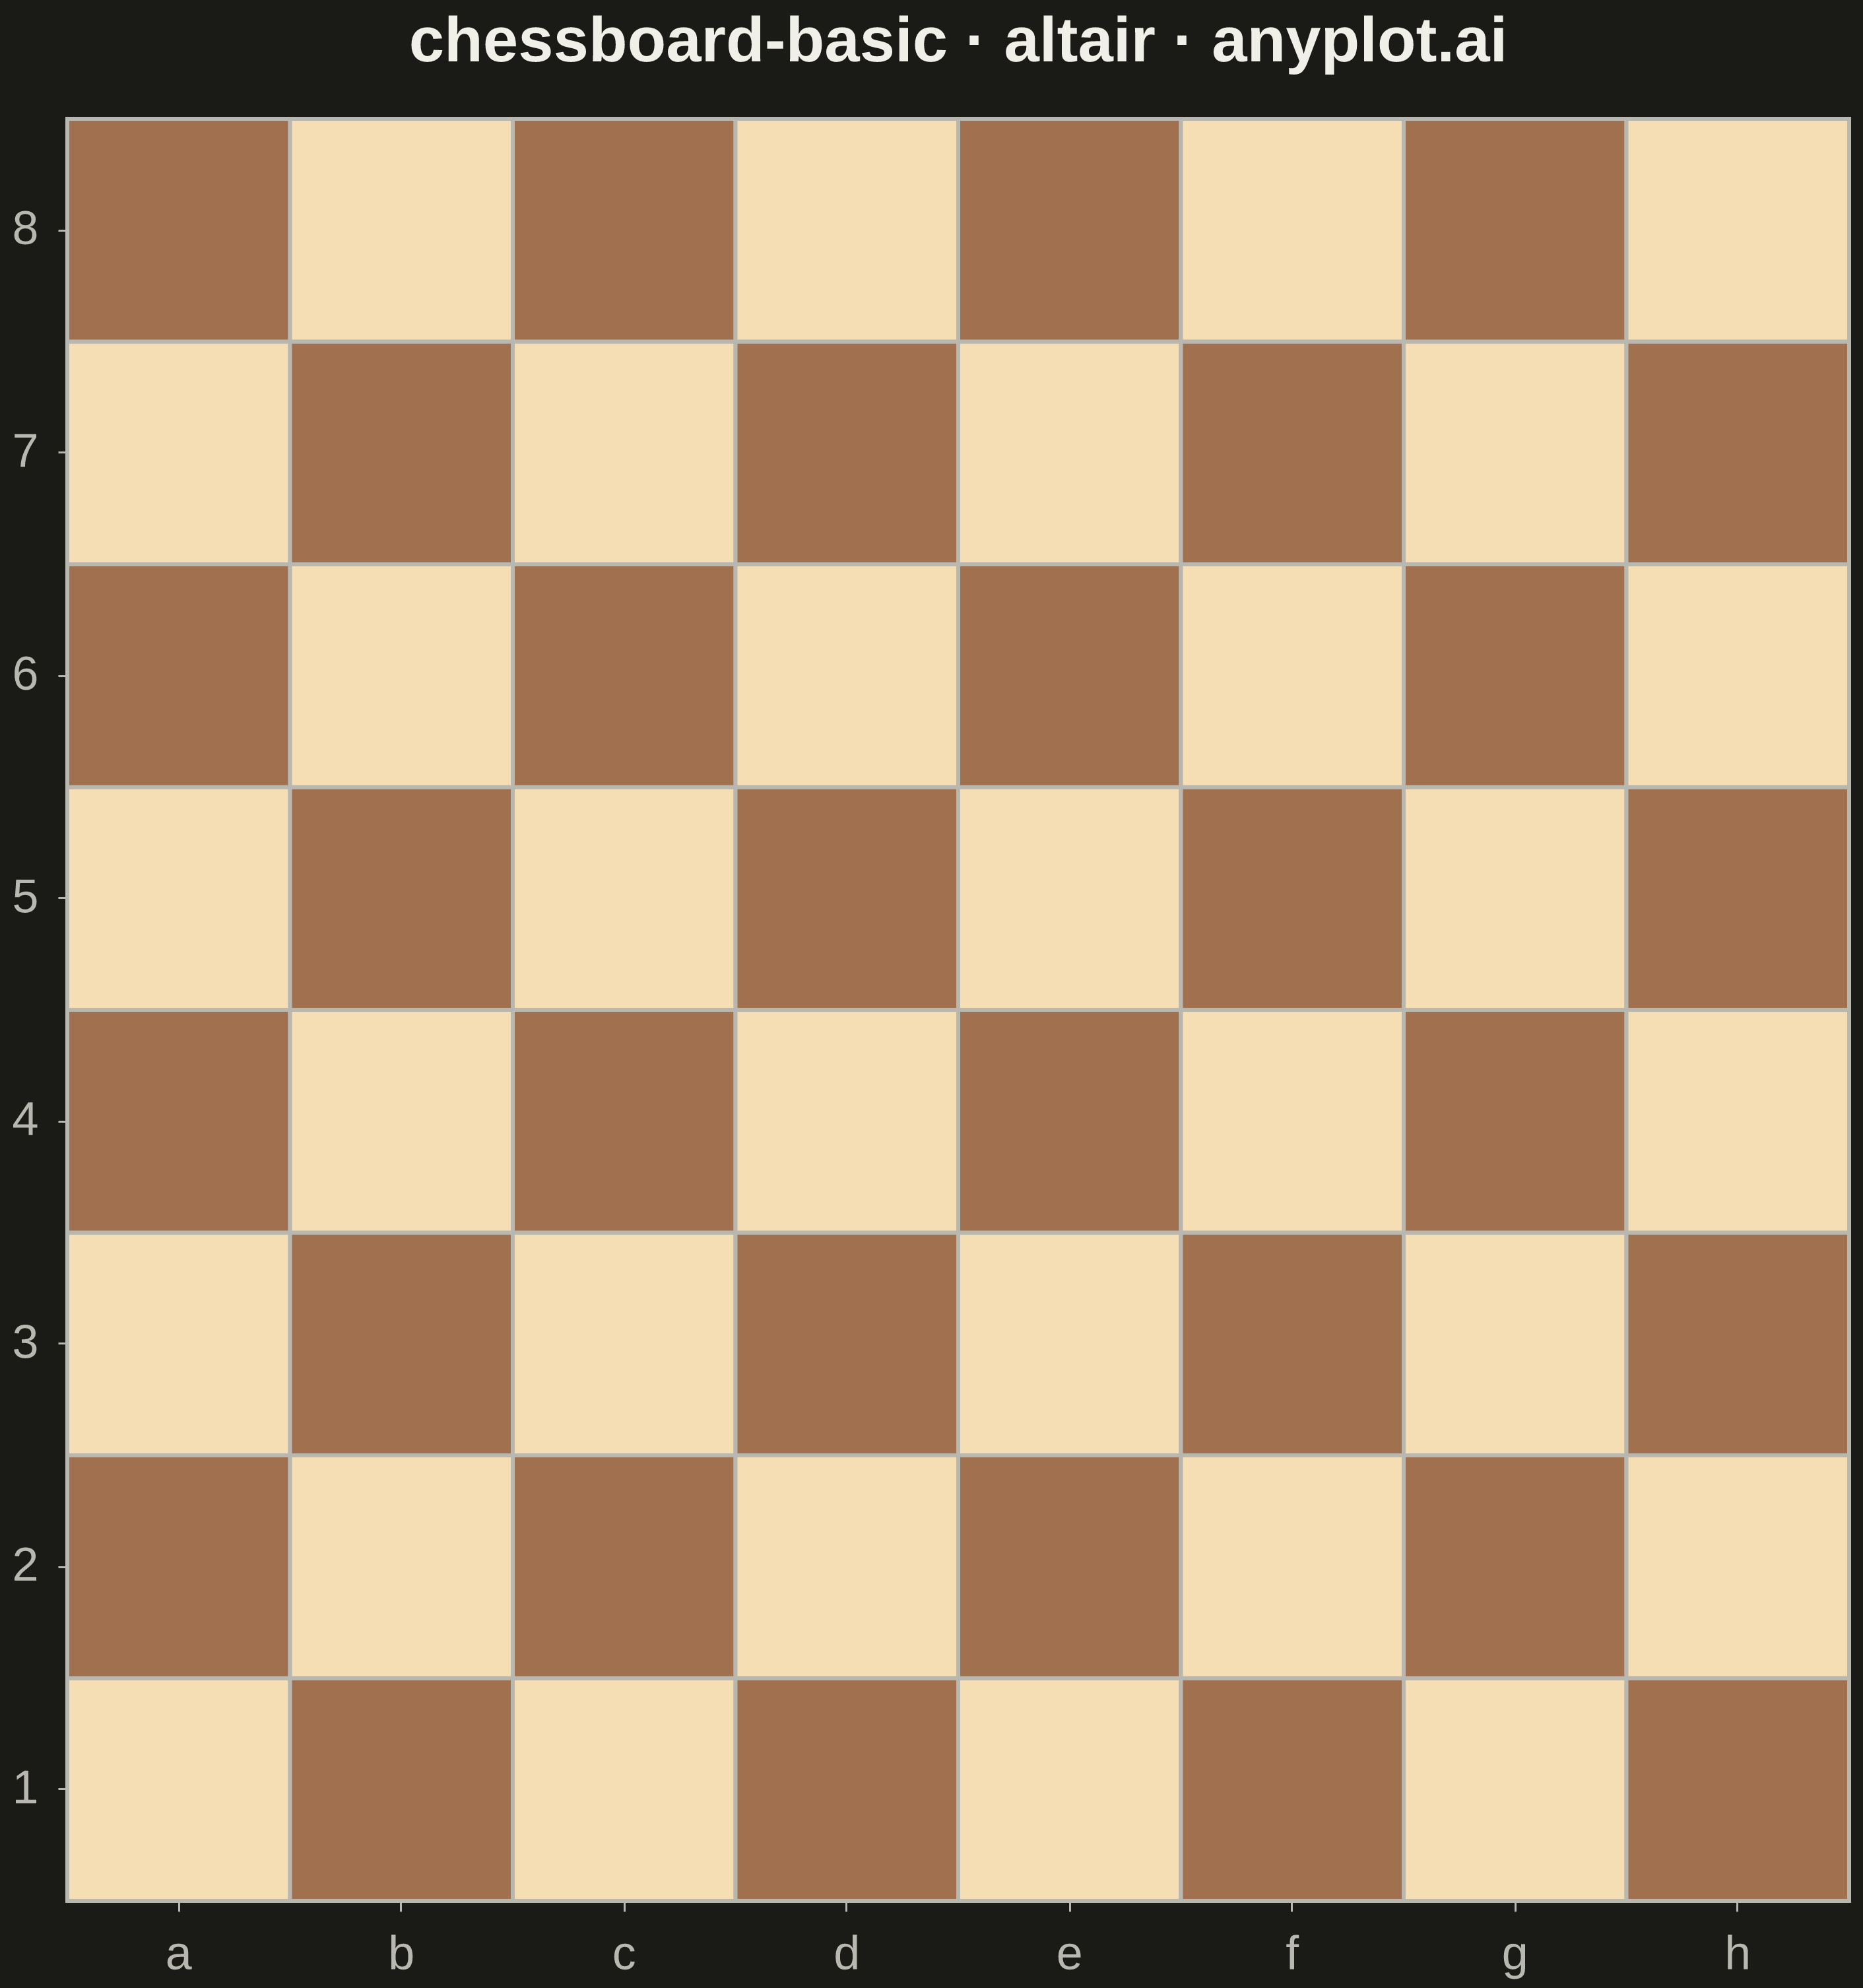
A classic 8x8 chess board with alternating light and dark squares, labeled with standard algebraic notation (columns a-h, rows 1-8). This clean grid visualization serves as a foundation for chess diagrams, game position displays, and educational chess materials.
""" anyplot.ai
chessboard-basic: Chess Board Grid Visualization
Library: altair 6.1.0 | Python 3.13.13
Quality: 95/100 | Updated: 2026-05-17
"""

import os
import sys


# Change to script directory before importing to allow proper imports
script_dir = os.path.dirname(os.path.abspath(__file__))
os.chdir(script_dir)

# Remove current directory from import path temporarily
saved_path = sys.path[:]
sys.path = [p for p in sys.path if p not in ("", ".", script_dir)]

try:
    import pandas as pd
    from altair import Axis, Chart, Color, Scale, Title, X, Y
finally:
    sys.path = saved_path

# Theme tokens
THEME = os.getenv("ANYPLOT_THEME", "light")
PAGE_BG = "#FAF8F1" if THEME == "light" else "#1A1A17"
ELEVATED_BG = "#FFFDF6" if THEME == "light" else "#242420"
INK = "#1A1A17" if THEME == "light" else "#F0EFE8"
INK_SOFT = "#4A4A44" if THEME == "light" else "#B8B7B0"

# Data - Create 8x8 chess board
columns = list("abcdefgh")
rows = list(range(1, 9))

# Generate all 64 squares with color assignments
# Light squares at h1 and a8 corners (standard chess convention)
data = []
for col_idx, col in enumerate(columns):
    for row in rows:
        # Chess coloring: (col_idx + row) even = dark, odd = light
        is_light = (col_idx + row) % 2 == 1
        data.append({"column": col, "row": row, "color": "light" if is_light else "dark", "x": col_idx, "y": row - 1})

df = pd.DataFrame(data)

# Create chart with rect marks for squares
# Chess square colors work on both light and dark backgrounds
chart = (
    Chart(df)
    .mark_rect(stroke=INK_SOFT, strokeWidth=2)
    .encode(
        x=X(
            "column:O",
            axis=Axis(
                title=None, labelFontSize=24, labelAngle=0, orient="bottom", labelPadding=10, labelColor=INK_SOFT
            ),
            sort=columns,
        ),
        y=Y(
            "row:O",
            axis=Axis(title=None, labelFontSize=24, labelPadding=10, labelColor=INK_SOFT),
            sort=list(range(8, 0, -1)),  # 8 at top, 1 at bottom
        ),
        color=Color(
            "color:N",
            scale=Scale(
                domain=["light", "dark"],
                range=["#F5DEB3", "#A0704F"],  # Wheat / Medium brown (visible on both themes)
            ),
            legend=None,
        ),
    )
    .properties(
        width=900,
        height=900,
        background=PAGE_BG,
        title=Title("chessboard-basic · altair · anyplot.ai", fontSize=32, anchor="middle", offset=20, color=INK),
    )
    .configure_view(strokeWidth=2, stroke=INK_SOFT, fill=PAGE_BG)
    .configure_axis(domainColor=INK_SOFT, tickColor=INK_SOFT, gridColor=INK_SOFT, gridOpacity=0.0)
)

# Save outputs
chart.save(f"plot-{THEME}.png", scale_factor=3.0)
chart.save(f"plot-{THEME}.html")
Runnable source as JSON, for any HTTP client: https://api.anyplot.ai/specs/chessboard-basic/altair/code. Any spec id and library id listed in llms-full.txt fit the same URL shape; every URL below is complete and callable.
{
  "spec_id": "chessboard-basic",
  "language": "python",
  "library": "altair",
  "page": "https://anyplot.ai/chessboard-basic/python/altair",
  "hub": "https://anyplot.ai/chessboard-basic",
  "code_json": "https://api.anyplot.ai/specs/chessboard-basic/altair/code",
  "spec_json": "https://api.anyplot.ai/specs/chessboard-basic",
  "render_light_png": "https://storage.googleapis.com/anyplot-images/plots/chessboard-basic/python/altair/plot-light.png",
  "render_dark_png": "https://storage.googleapis.com/anyplot-images/plots/chessboard-basic/python/altair/plot-dark.png",
  "interactive_light_html": "https://storage.googleapis.com/anyplot-images/plots/chessboard-basic/python/altair/plot-light.html",
  "interactive_dark_html": "https://storage.googleapis.com/anyplot-images/plots/chessboard-basic/python/altair/plot-dark.html",
  "quality_score": 95.0,
  "license": "MIT",
  "guide": "https://anyplot.ai/llms.txt"
}
Part of Chess Board Grid Visualization on anyplot.ai.