The same plot in 13 other libraries — Python: Altair, Bokeh, Matplotlib, Plotly, Pygal, Seaborn; R: ggplot2; Julia: Makie.jl; JavaScript: Chart.js, D3.js, Apache ECharts, Highcharts, MUI X Charts. Compare all 14 side by side: 3D Contour Plot in Python, R, Julia and JavaScript.
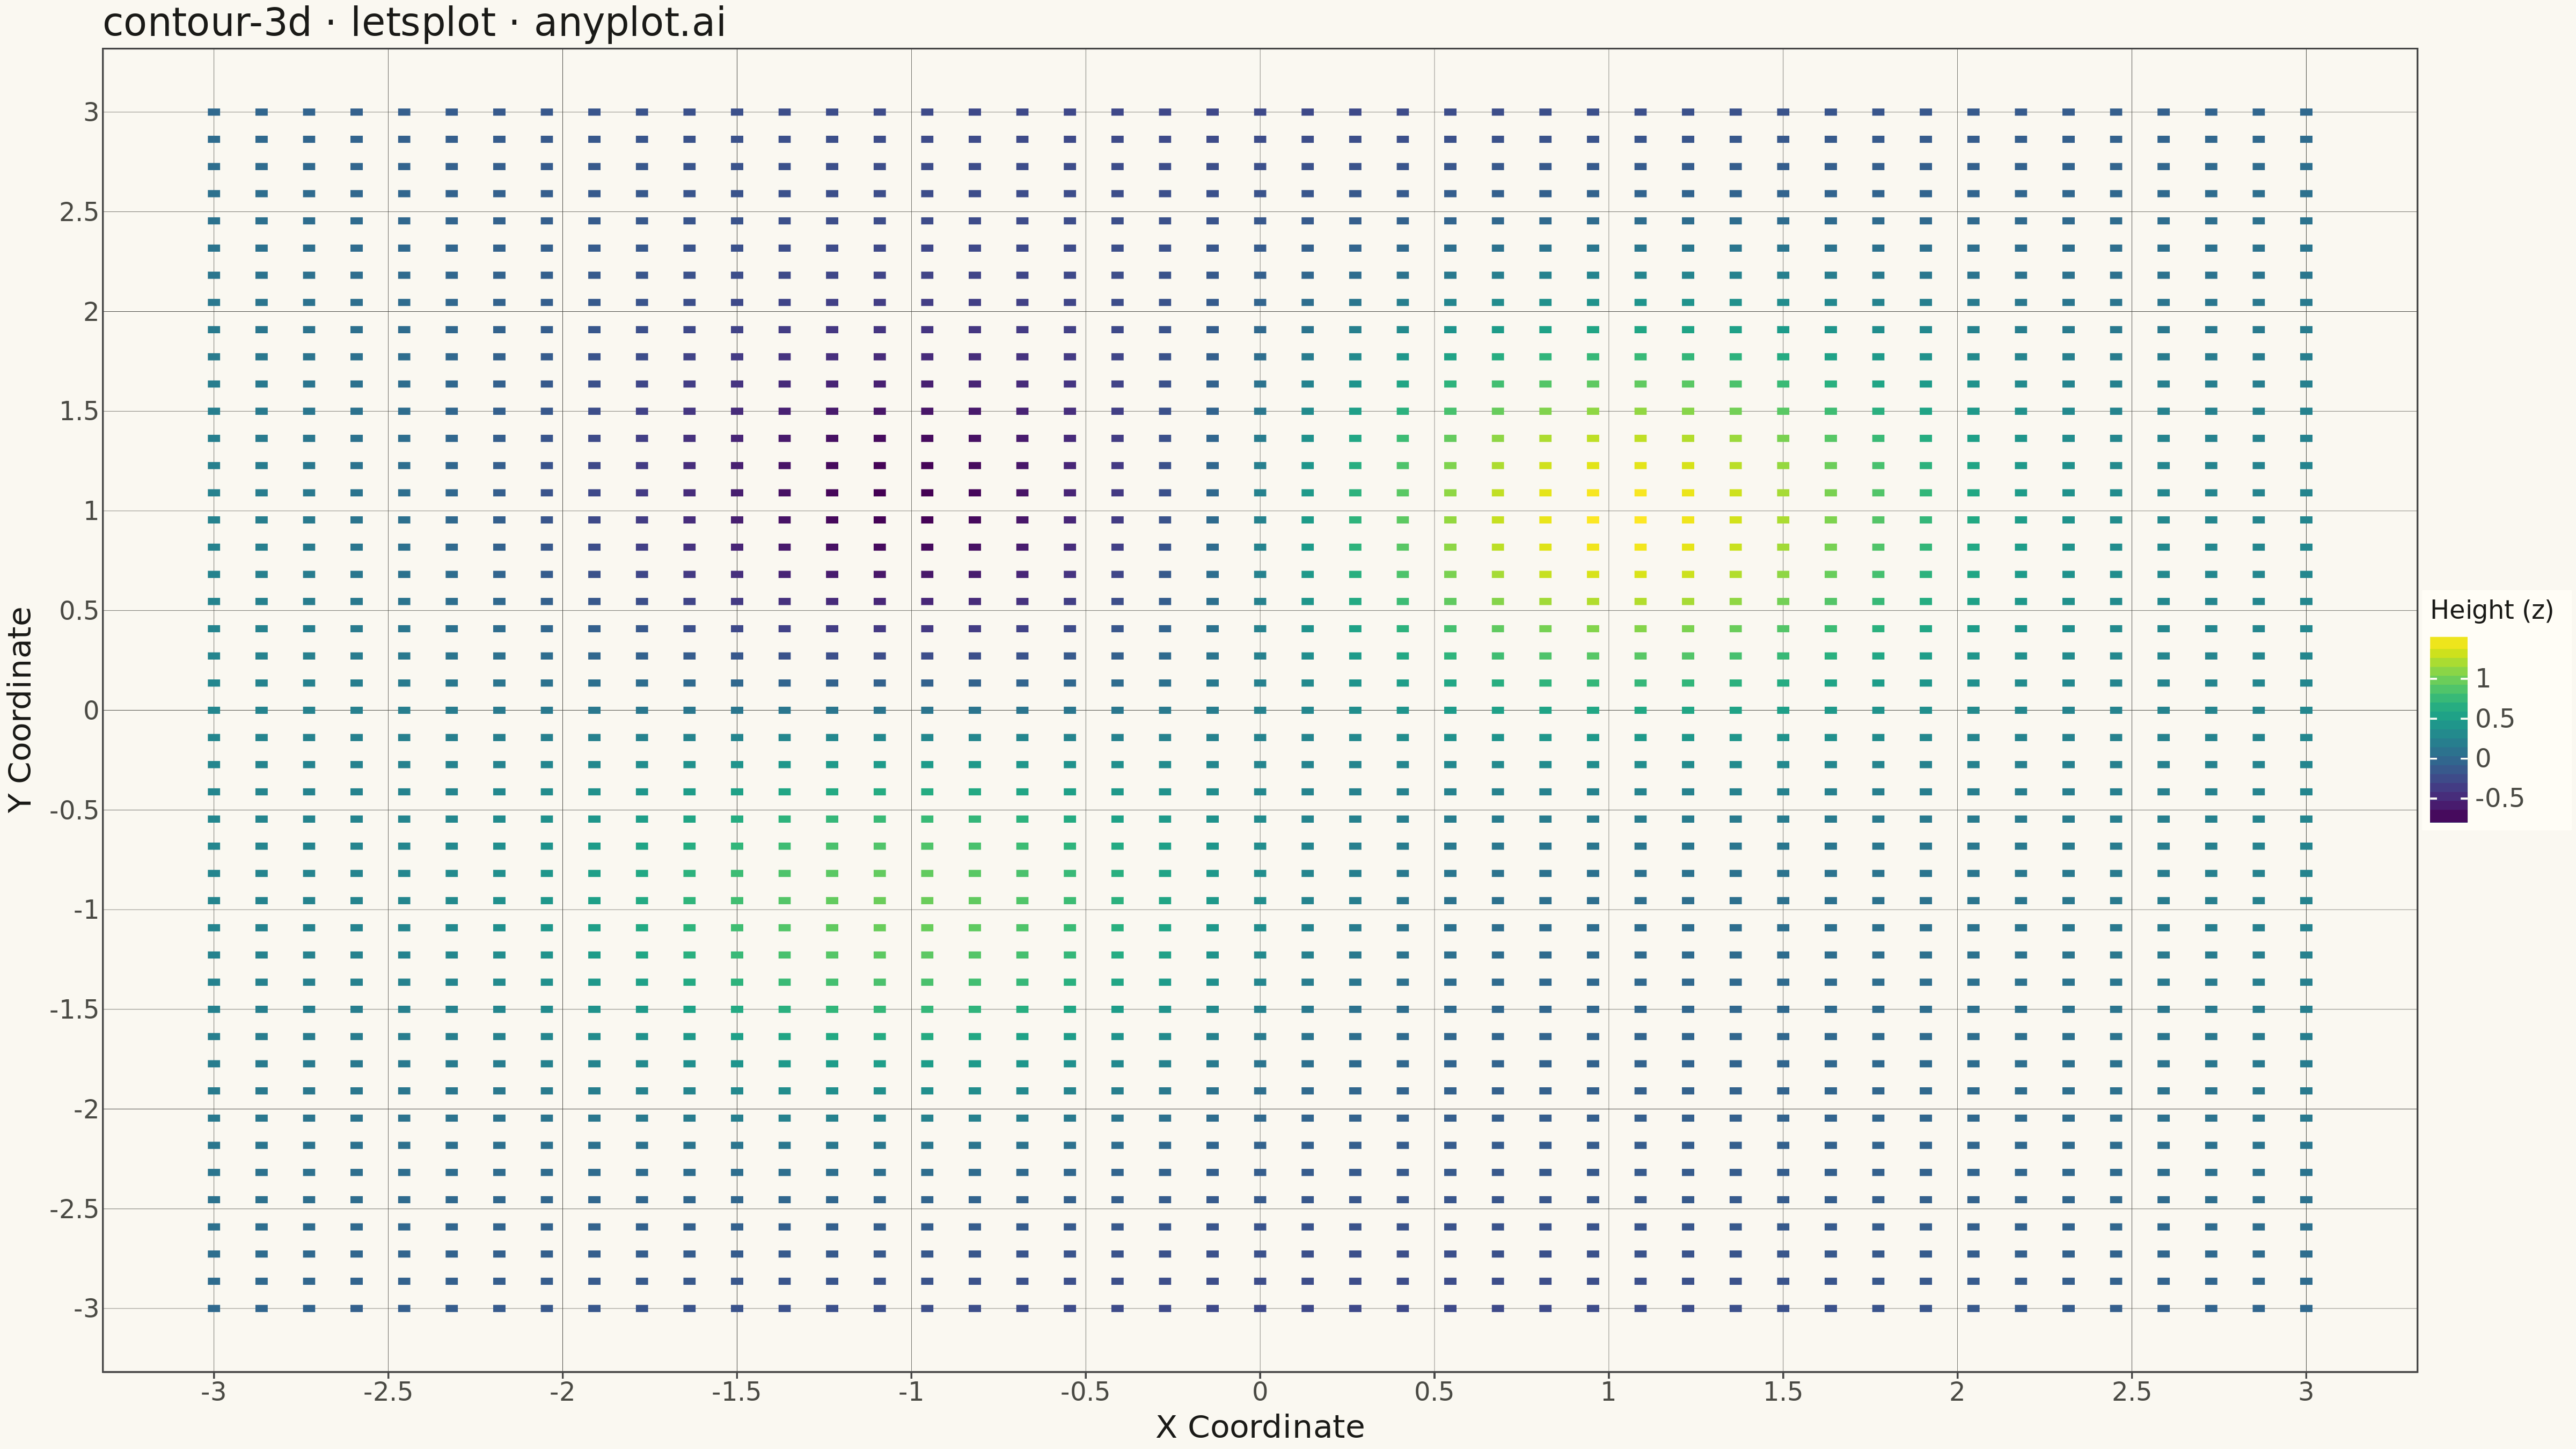
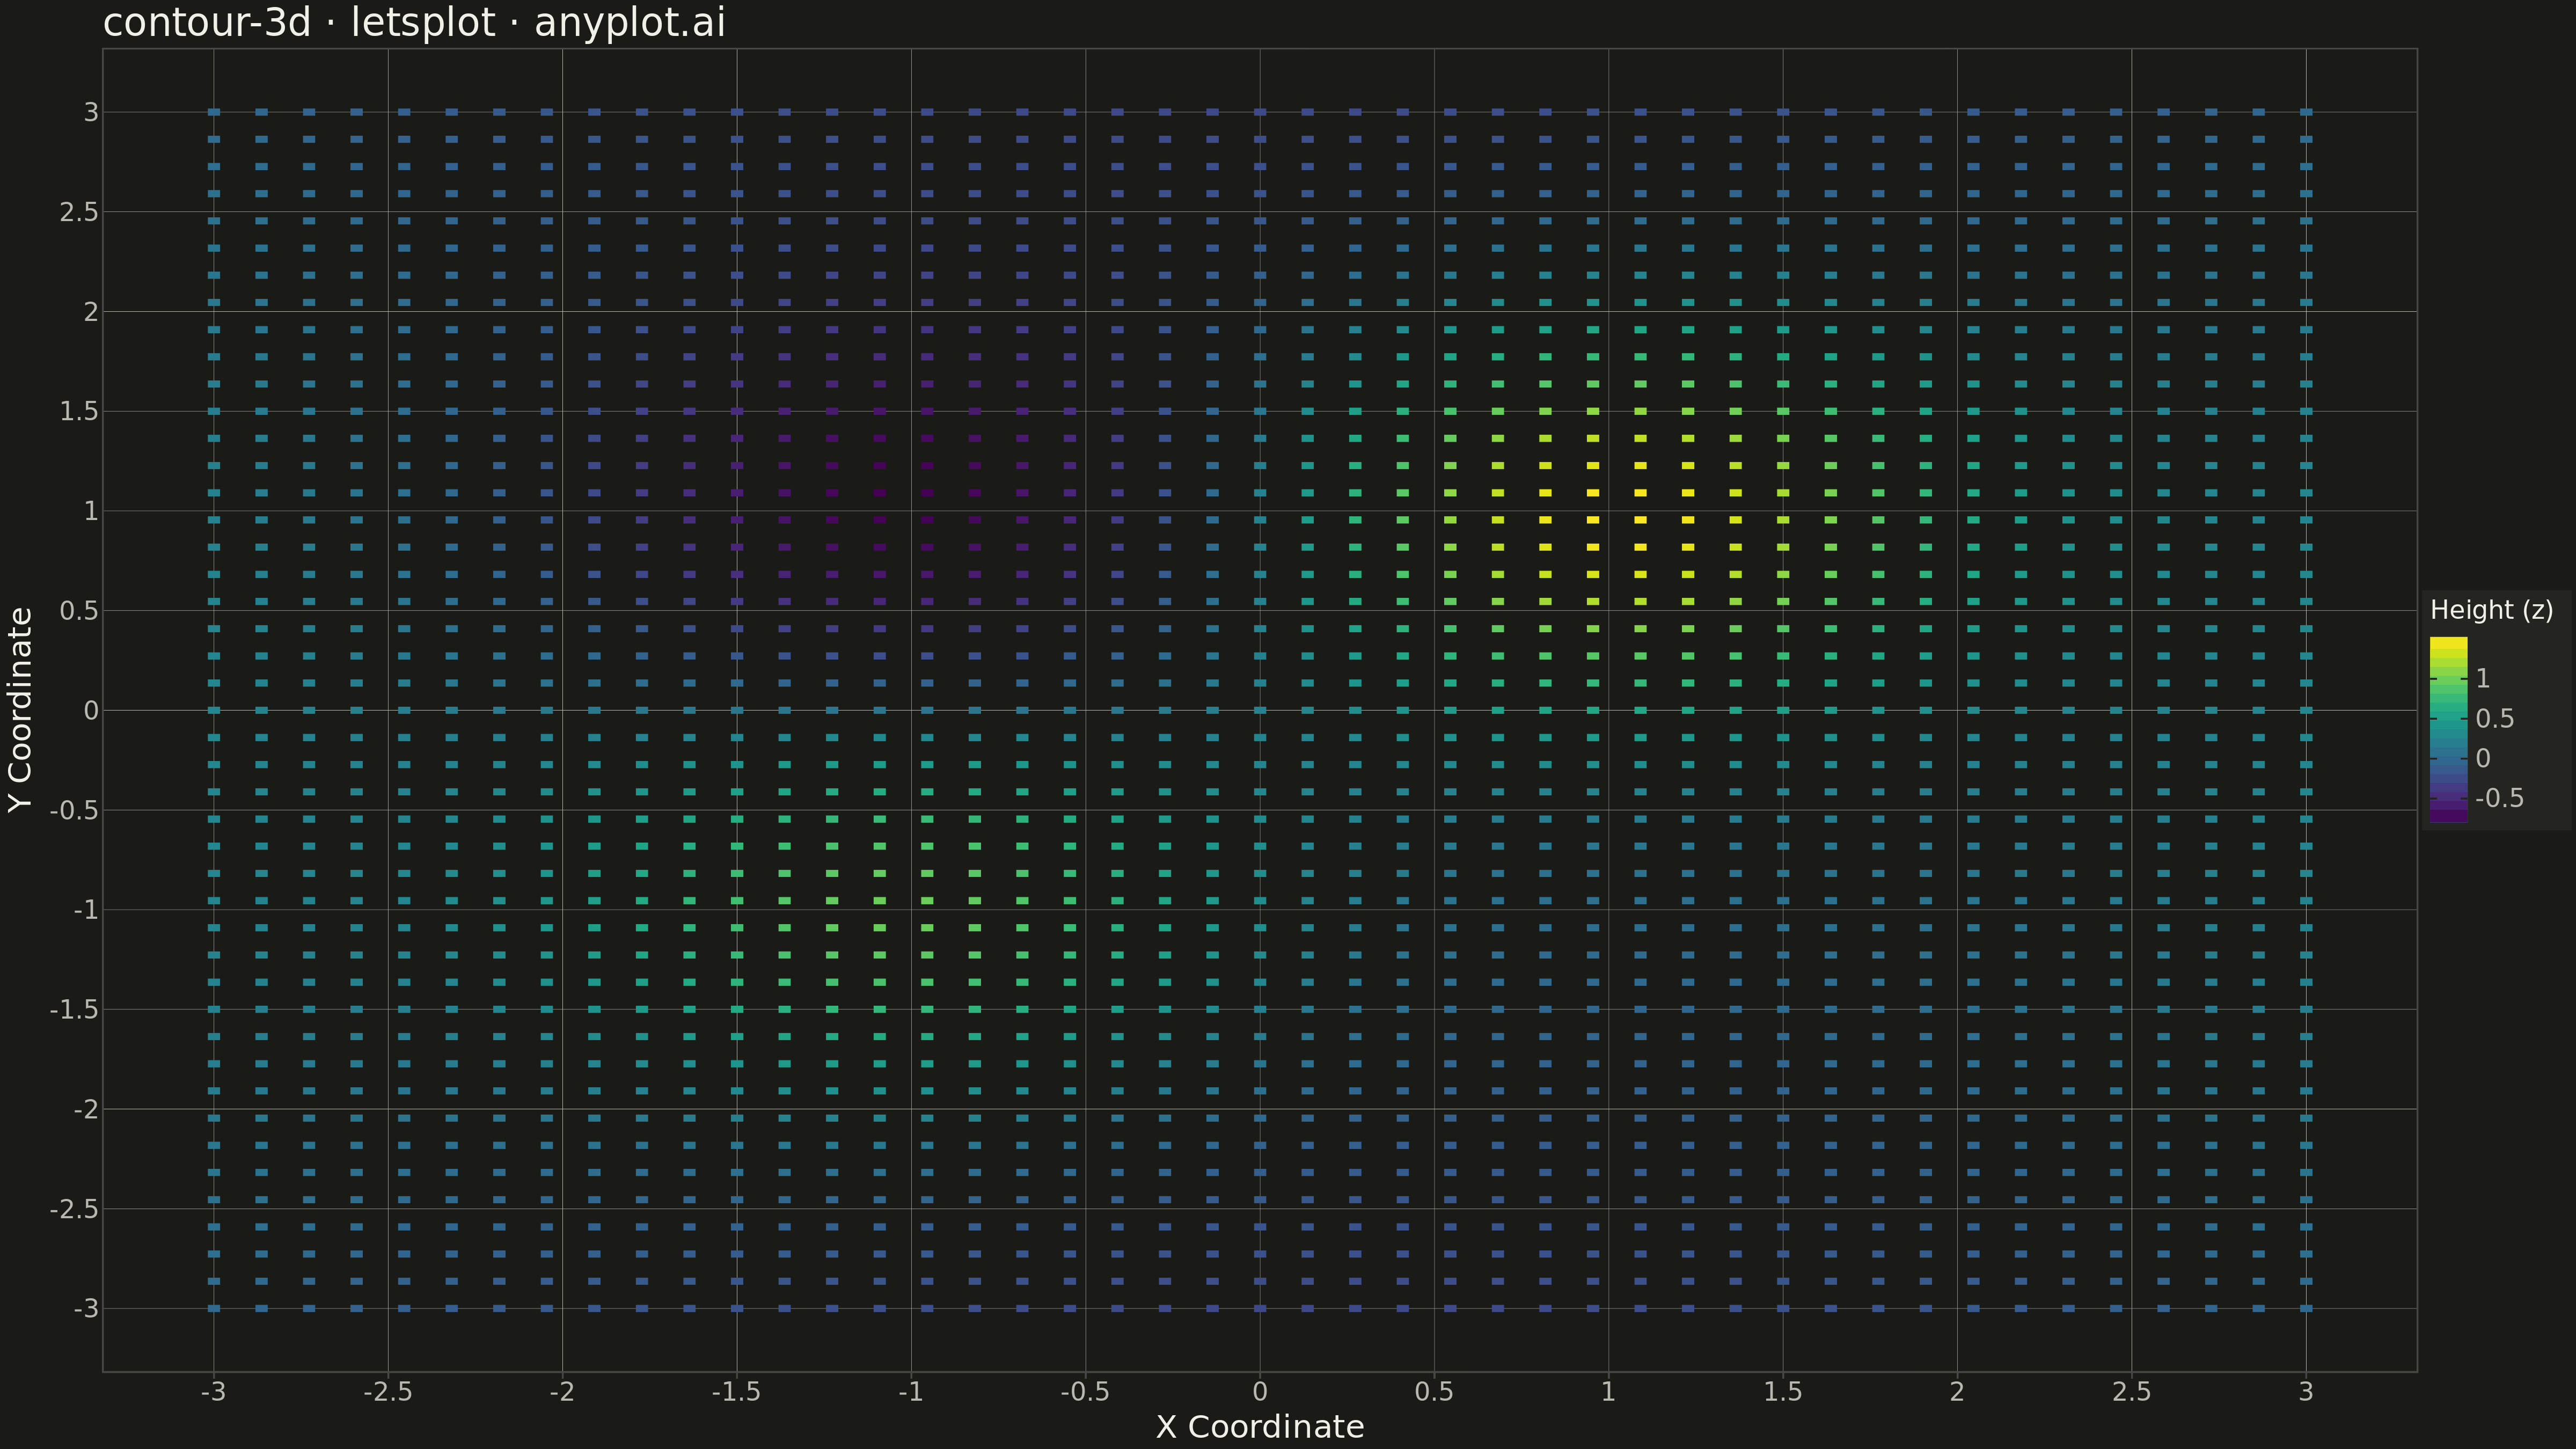
A 3D contour plot displays contour lines or filled contour bands on a three-dimensional surface, showing isolines of a function of two variables in 3D space. Unlike 2D contour plots that flatten the visualization, 3D contour plots preserve the surface geometry while highlighting level curves, making it easier to understand both the overall shape and specific value regions simultaneously. This visualization combines the spatial intuition of 3D surfaces with the precision of contour-based value identification.
""" anyplot.ai
contour-3d: 3D Contour Plot
Library: letsplot 4.9.0 | Python 3.13.13
Quality: 83/100 | Created: 2026-05-16
"""

import os
import shutil
from pathlib import Path

import numpy as np
import pandas as pd
from lets_plot import *


LetsPlot.setup_html()

# Theme tokens
THEME = os.getenv("ANYPLOT_THEME", "light")
PAGE_BG = "#FAF8F1" if THEME == "light" else "#1A1A17"
ELEVATED_BG = "#FFFDF6" if THEME == "light" else "#242420"
INK = "#1A1A17" if THEME == "light" else "#F0EFE8"
INK_SOFT = "#4A4A44" if THEME == "light" else "#B8B7B0"

# Data - mathematical surface with interesting contour features
n = 45  # Grid size for clear visualization
x = np.linspace(-3, 3, n)
y = np.linspace(-3, 3, n)
X, Y = np.meshgrid(x, y)

# Create surface with multiple peaks and valleys
Z = (
    1.5 * np.exp(-((X - 1) ** 2 + (Y - 1) ** 2))
    + 1.0 * np.exp(-((X + 1) ** 2 + (Y + 1) ** 2))
    - 0.8 * np.exp(-((X + 1) ** 2 + (Y - 1) ** 2))
    + 0.3 * (X**2 - Y**2) * 0.1
)

# Prepare data for letsplot
data = []
for i in range(len(x)):
    for j in range(len(y)):
        data.append({"x": X[j, i], "y": Y[j, i], "z": Z[j, i]})
df = pd.DataFrame(data)

# Create contour-style visualization using tile with fine grid
plot = (
    ggplot(df, aes("x", "y", fill="z"))
    + geom_tile(width=0.15, height=0.15)
    + scale_fill_viridis()
    + labs(x="X Coordinate", y="Y Coordinate", fill="Height (z)", title="contour-3d · letsplot · anyplot.ai")
    + ggsize(1600, 900)
    + theme(
        plot_background=element_rect(fill=PAGE_BG, color=PAGE_BG),
        panel_background=element_rect(fill=PAGE_BG),
        panel_grid_major=element_line(color=INK_SOFT, size=0.2),
        panel_grid_minor=element_blank(),
        axis_title=element_text(color=INK, size=20),
        axis_text=element_text(color=INK_SOFT, size=16),
        plot_title=element_text(color=INK, size=24),
        legend_background=element_rect(fill=ELEVATED_BG, color=INK_SOFT),
        legend_text=element_text(color=INK_SOFT, size=16),
        legend_title=element_text(color=INK, size=16),
    )
)

ggsave(plot, f"plot-{THEME}.png", scale=3)
ggsave(plot, f"plot-{THEME}.html")

# letsplot creates files in lets-plot-images/ subdirectory; move them to root
for ext in [".png", ".html"]:
    src = Path(f"lets-plot-images/plot-{THEME}{ext}")
    dst = Path(f"plot-{THEME}{ext}")
    if src.exists():
        shutil.move(str(src), str(dst))
Runnable source as JSON, for any HTTP client: https://api.anyplot.ai/specs/contour-3d/letsplot/code. Any spec id and library id listed in llms-full.txt fit the same URL shape; every URL below is complete and callable.
{
  "spec_id": "contour-3d",
  "language": "python",
  "library": "letsplot",
  "page": "https://anyplot.ai/contour-3d/python/letsplot",
  "hub": "https://anyplot.ai/contour-3d",
  "code_json": "https://api.anyplot.ai/specs/contour-3d/letsplot/code",
  "spec_json": "https://api.anyplot.ai/specs/contour-3d",
  "render_light_png": "https://storage.googleapis.com/anyplot-images/plots/contour-3d/python/letsplot/plot-light.png",
  "render_dark_png": "https://storage.googleapis.com/anyplot-images/plots/contour-3d/python/letsplot/plot-dark.png",
  "interactive_light_html": "https://storage.googleapis.com/anyplot-images/plots/contour-3d/python/letsplot/plot-light.html",
  "interactive_dark_html": "https://storage.googleapis.com/anyplot-images/plots/contour-3d/python/letsplot/plot-dark.html",
  "quality_score": 83.0,
  "license": "MIT",
  "guide": "https://anyplot.ai/llms.txt"
}
Part of 3D Contour Plot on anyplot.ai.