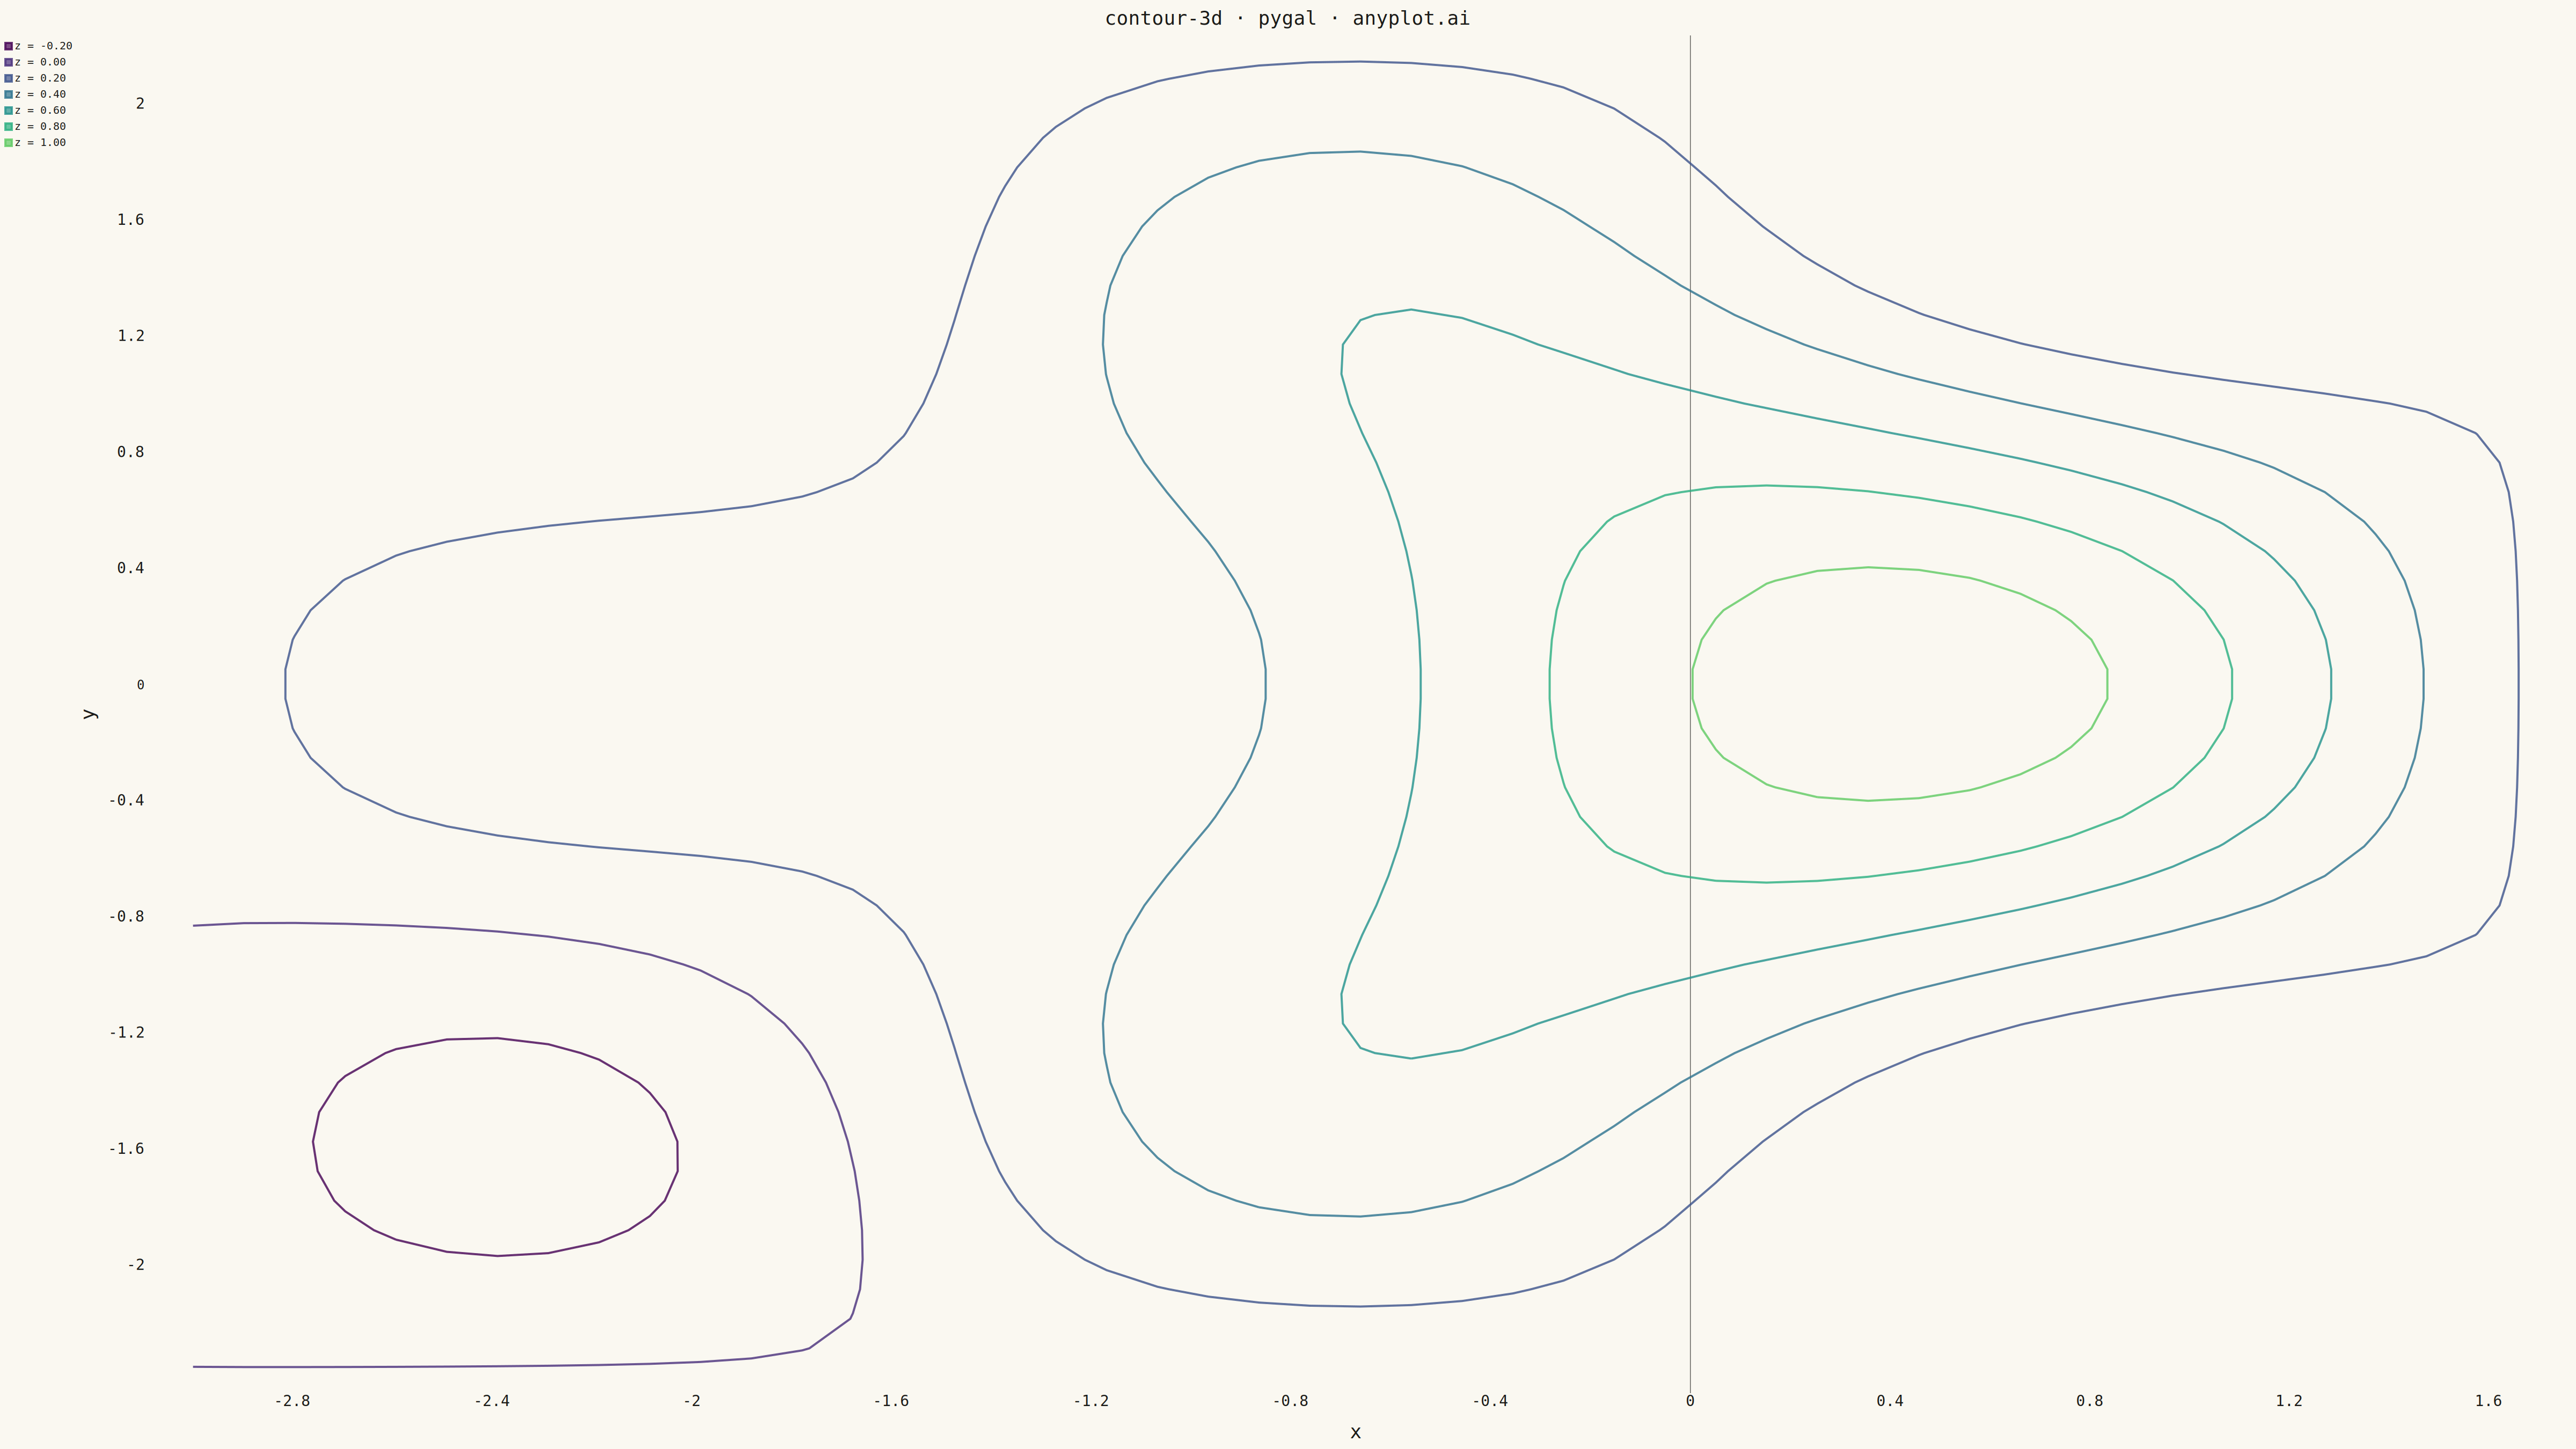
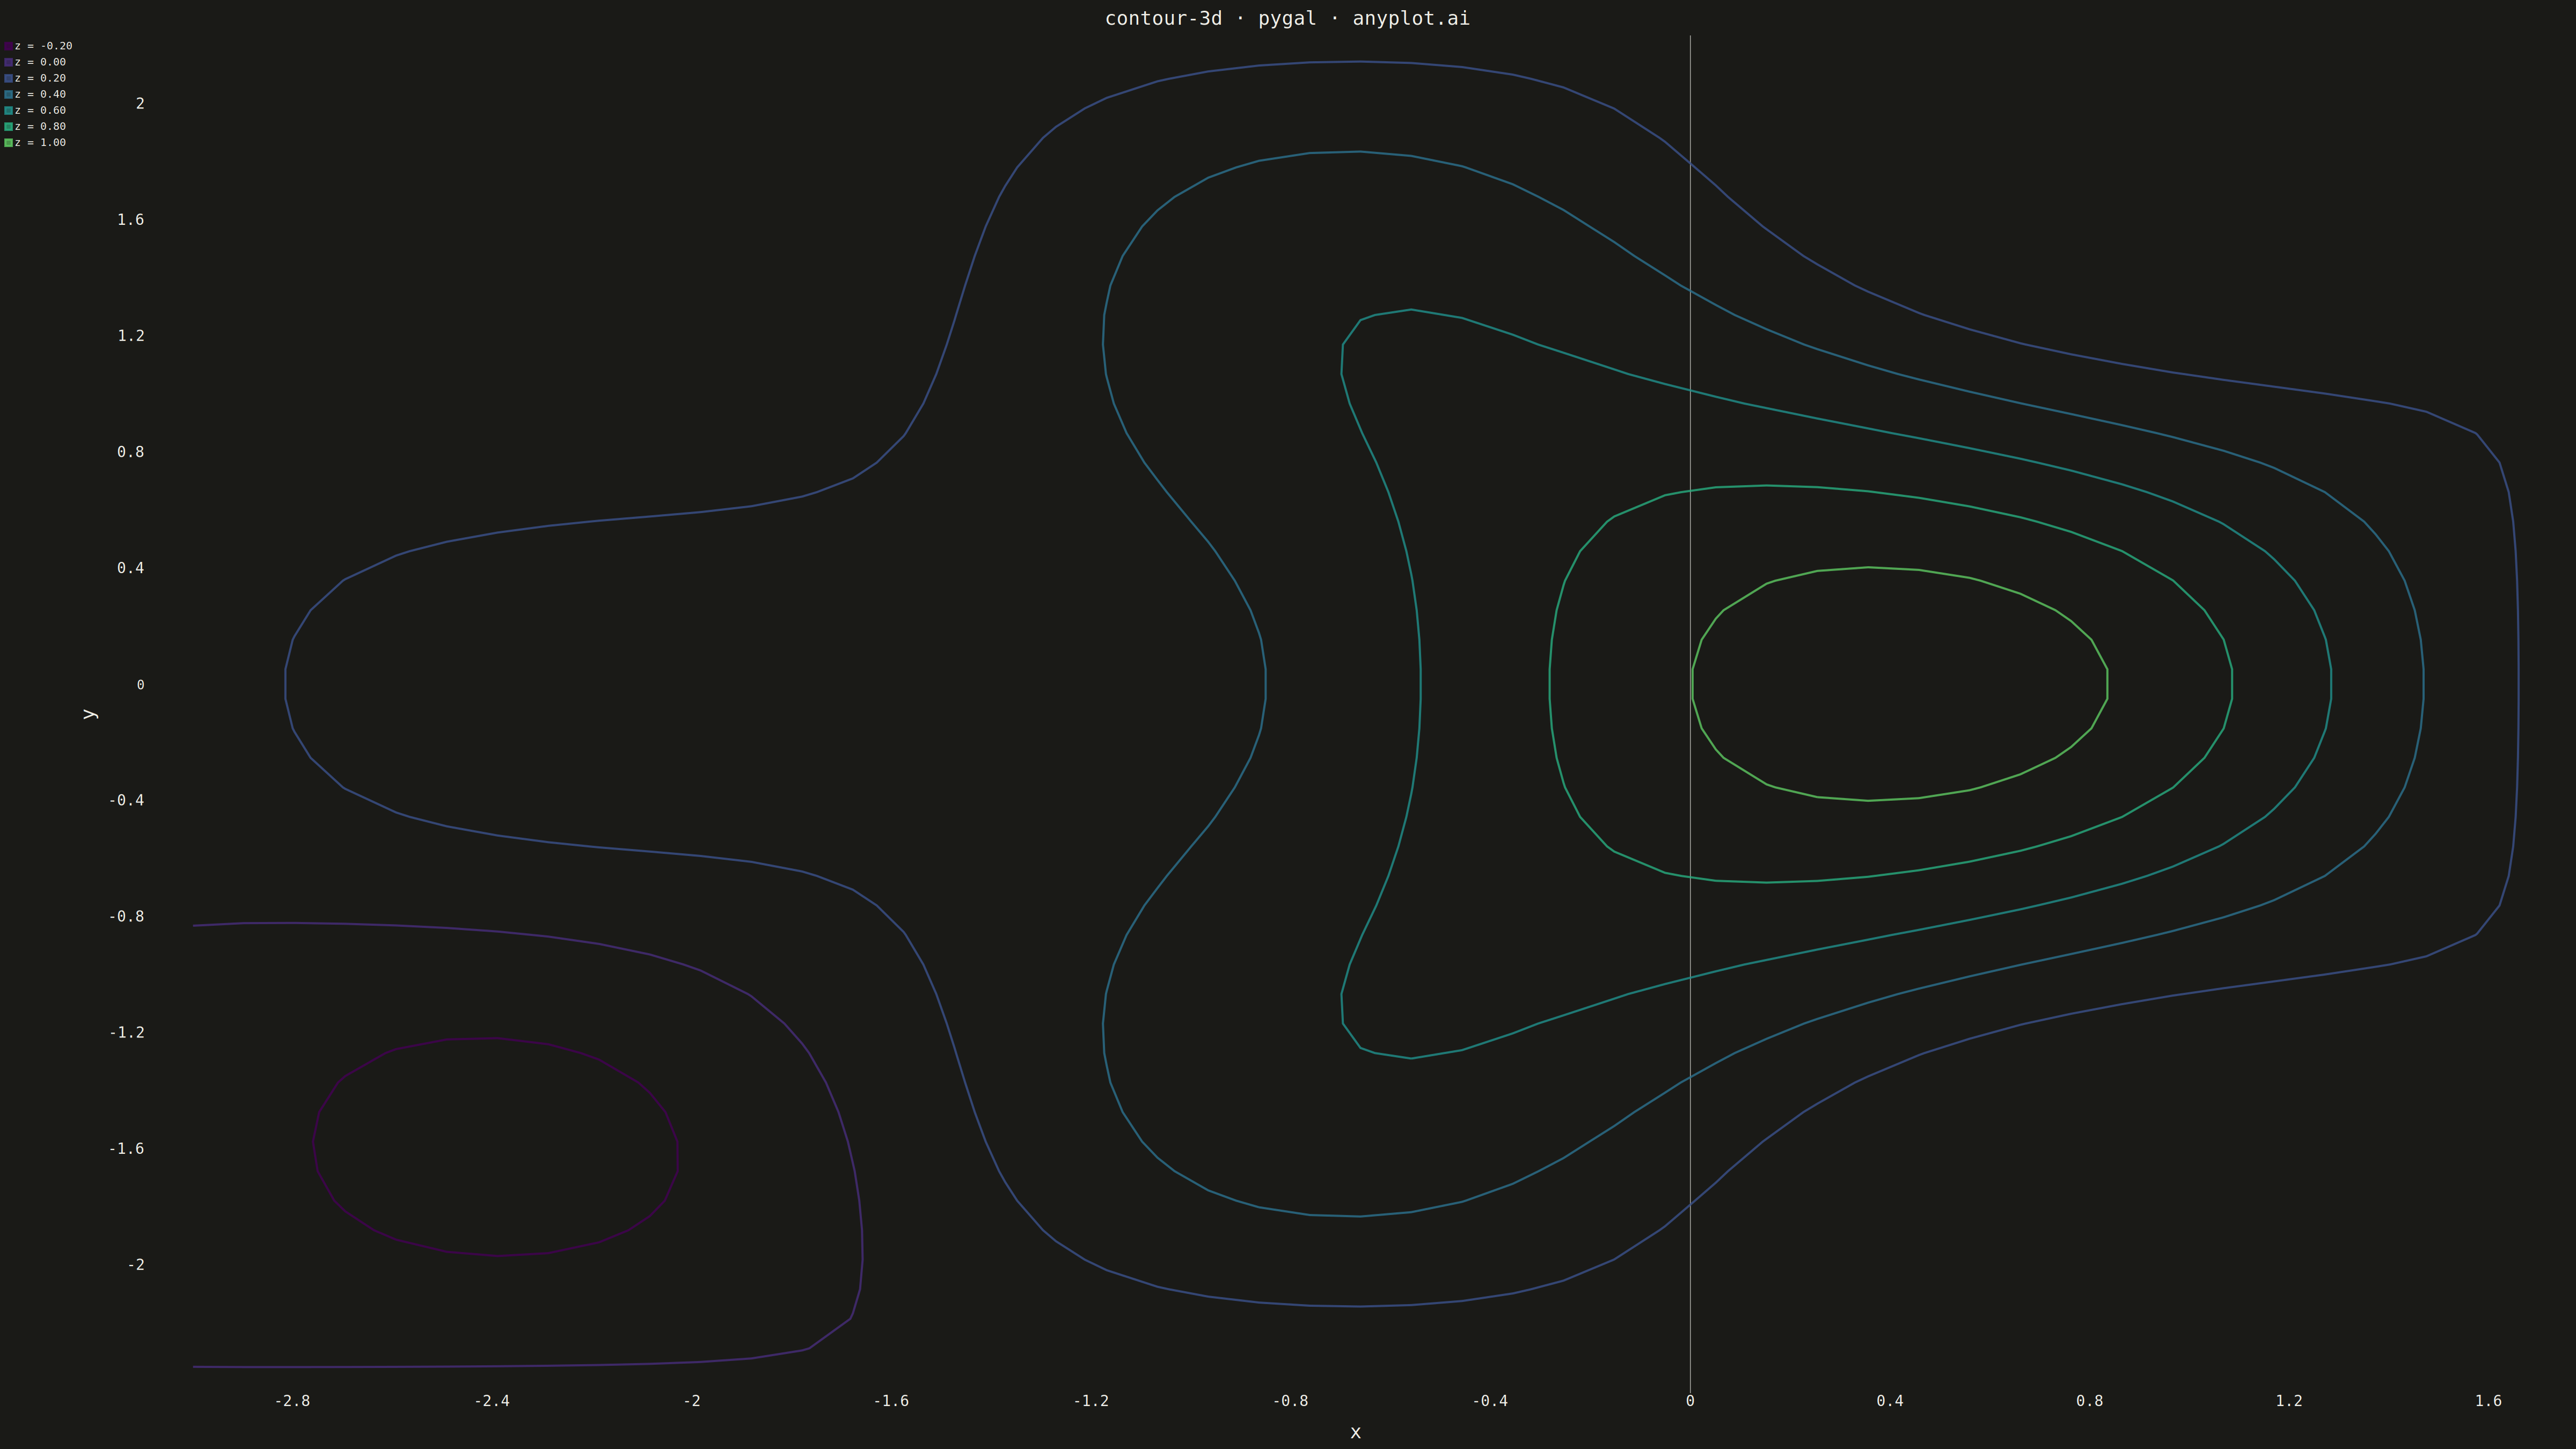
The same plot in 13 other libraries — Python: Altair, Bokeh, lets-plot, Matplotlib, Plotly, Seaborn; R: ggplot2; Julia: Makie.jl; JavaScript: Chart.js, D3.js, Apache ECharts, Highcharts, MUI X Charts. Compare all 14 side by side: 3D Contour Plot in Python, R, Julia and JavaScript.
A 3D contour plot displays contour lines or filled contour bands on a three-dimensional surface, showing isolines of a function of two variables in 3D space. Unlike 2D contour plots that flatten the visualization, 3D contour plots preserve the surface geometry while highlighting level curves, making it easier to understand both the overall shape and specific value regions simultaneously. This visualization combines the spatial intuition of 3D surfaces with the precision of contour-based value identification.
""" anyplot.ai
contour-3d: 3D Contour Plot
Library: pygal 3.1.0 | Python 3.13.13
Quality: 66/100 | Created: 2026-05-16
"""

import os
import sys


# Exclude the 'python' directory from sys.path — prevents local implementation files
# (matplotlib.py, pygal.py, etc.) from shadowing the installed packages they implement.
sys.path = [p for p in sys.path if not p.endswith("python")]

import matplotlib.cm as cm
import matplotlib.colors as mcolors
import matplotlib.pyplot as plt
import numpy as np
import pygal
from pygal.style import Style


THEME = os.getenv("ANYPLOT_THEME", "light")
PAGE_BG = "#FAF8F1" if THEME == "light" else "#1A1A17"
INK = "#1A1A17" if THEME == "light" else "#F0EFE8"
INK_MUTED = "#6B6A63" if THEME == "light" else "#A8A79F"

np.random.seed(42)
x = np.linspace(-3, 3, 60)
y = np.linspace(-3, 3, 60)
X, Y = np.meshgrid(x, y)
Z = np.exp(-(X**2 + Y**2) / 2) + 0.3 * np.sin(2 * X) * np.cos(2 * Y)

# Use matplotlib as a computational backend to extract contour paths
fig, ax = plt.subplots()
contour_set = ax.contour(X, Y, Z, levels=8)
plt.close(fig)

actual_levels = contour_set.levels
n_levels = len(actual_levels)

# Sequential viridis palette: dark purple (low z) → yellow (high z)
viridis_colors = tuple(mcolors.to_hex(cm.viridis(i / max(n_levels - 1, 1))) for i in range(n_levels))

custom_style = Style(
    background=PAGE_BG,
    plot_background=PAGE_BG,
    foreground=INK,
    foreground_strong=INK,
    foreground_subtle=INK_MUTED,
    colors=viridis_colors,
    title_font_size=36,
    label_font_size=28,
    major_label_font_size=24,
    legend_font_size=20,
    stroke_width=4,
)

chart = pygal.XY(
    width=4800,
    height=2700,
    title="contour-3d · pygal · anyplot.ai",
    x_title="x",
    y_title="y",
    style=custom_style,
    show_legend=True,
    show_dots=False,
    show_x_guides=False,
    show_y_guides=False,
)

for z_level, segs in zip(actual_levels, contour_set.allsegs, strict=False):
    label = f"z = {z_level:.2f}"
    valid_segs = [seg for seg in segs if len(seg) > 1]
    if not valid_segs:
        continue
    # Use only the longest segment per level to avoid jump-line artifacts
    main_seg = max(valid_segs, key=len)
    points = [{"value": (float(p[0]), float(p[1])), "label": label} for p in main_seg]
    chart.add(label, points, show_dots=False)

chart.render_to_file(f"plot-{THEME}.svg")
chart.render_to_png(f"plot-{THEME}.png")

with open(f"plot-{THEME}.html", "wb") as f:
    f.write(chart.render())
Runnable source as JSON, for any HTTP client: https://api.anyplot.ai/specs/contour-3d/pygal/code. Any spec id and library id listed in llms-full.txt fit the same URL shape; every URL below is complete and callable.
{
  "spec_id": "contour-3d",
  "language": "python",
  "library": "pygal",
  "page": "https://anyplot.ai/contour-3d/python/pygal",
  "hub": "https://anyplot.ai/contour-3d",
  "code_json": "https://api.anyplot.ai/specs/contour-3d/pygal/code",
  "spec_json": "https://api.anyplot.ai/specs/contour-3d",
  "render_light_png": "https://storage.googleapis.com/anyplot-images/plots/contour-3d/python/pygal/plot-light.png",
  "render_dark_png": "https://storage.googleapis.com/anyplot-images/plots/contour-3d/python/pygal/plot-dark.png",
  "interactive_light_html": "https://storage.googleapis.com/anyplot-images/plots/contour-3d/python/pygal/plot-light.html",
  "interactive_dark_html": "https://storage.googleapis.com/anyplot-images/plots/contour-3d/python/pygal/plot-dark.html",
  "quality_score": 66.0,
  "license": "MIT",
  "guide": "https://anyplot.ai/llms.txt"
}
Part of 3D Contour Plot on anyplot.ai.