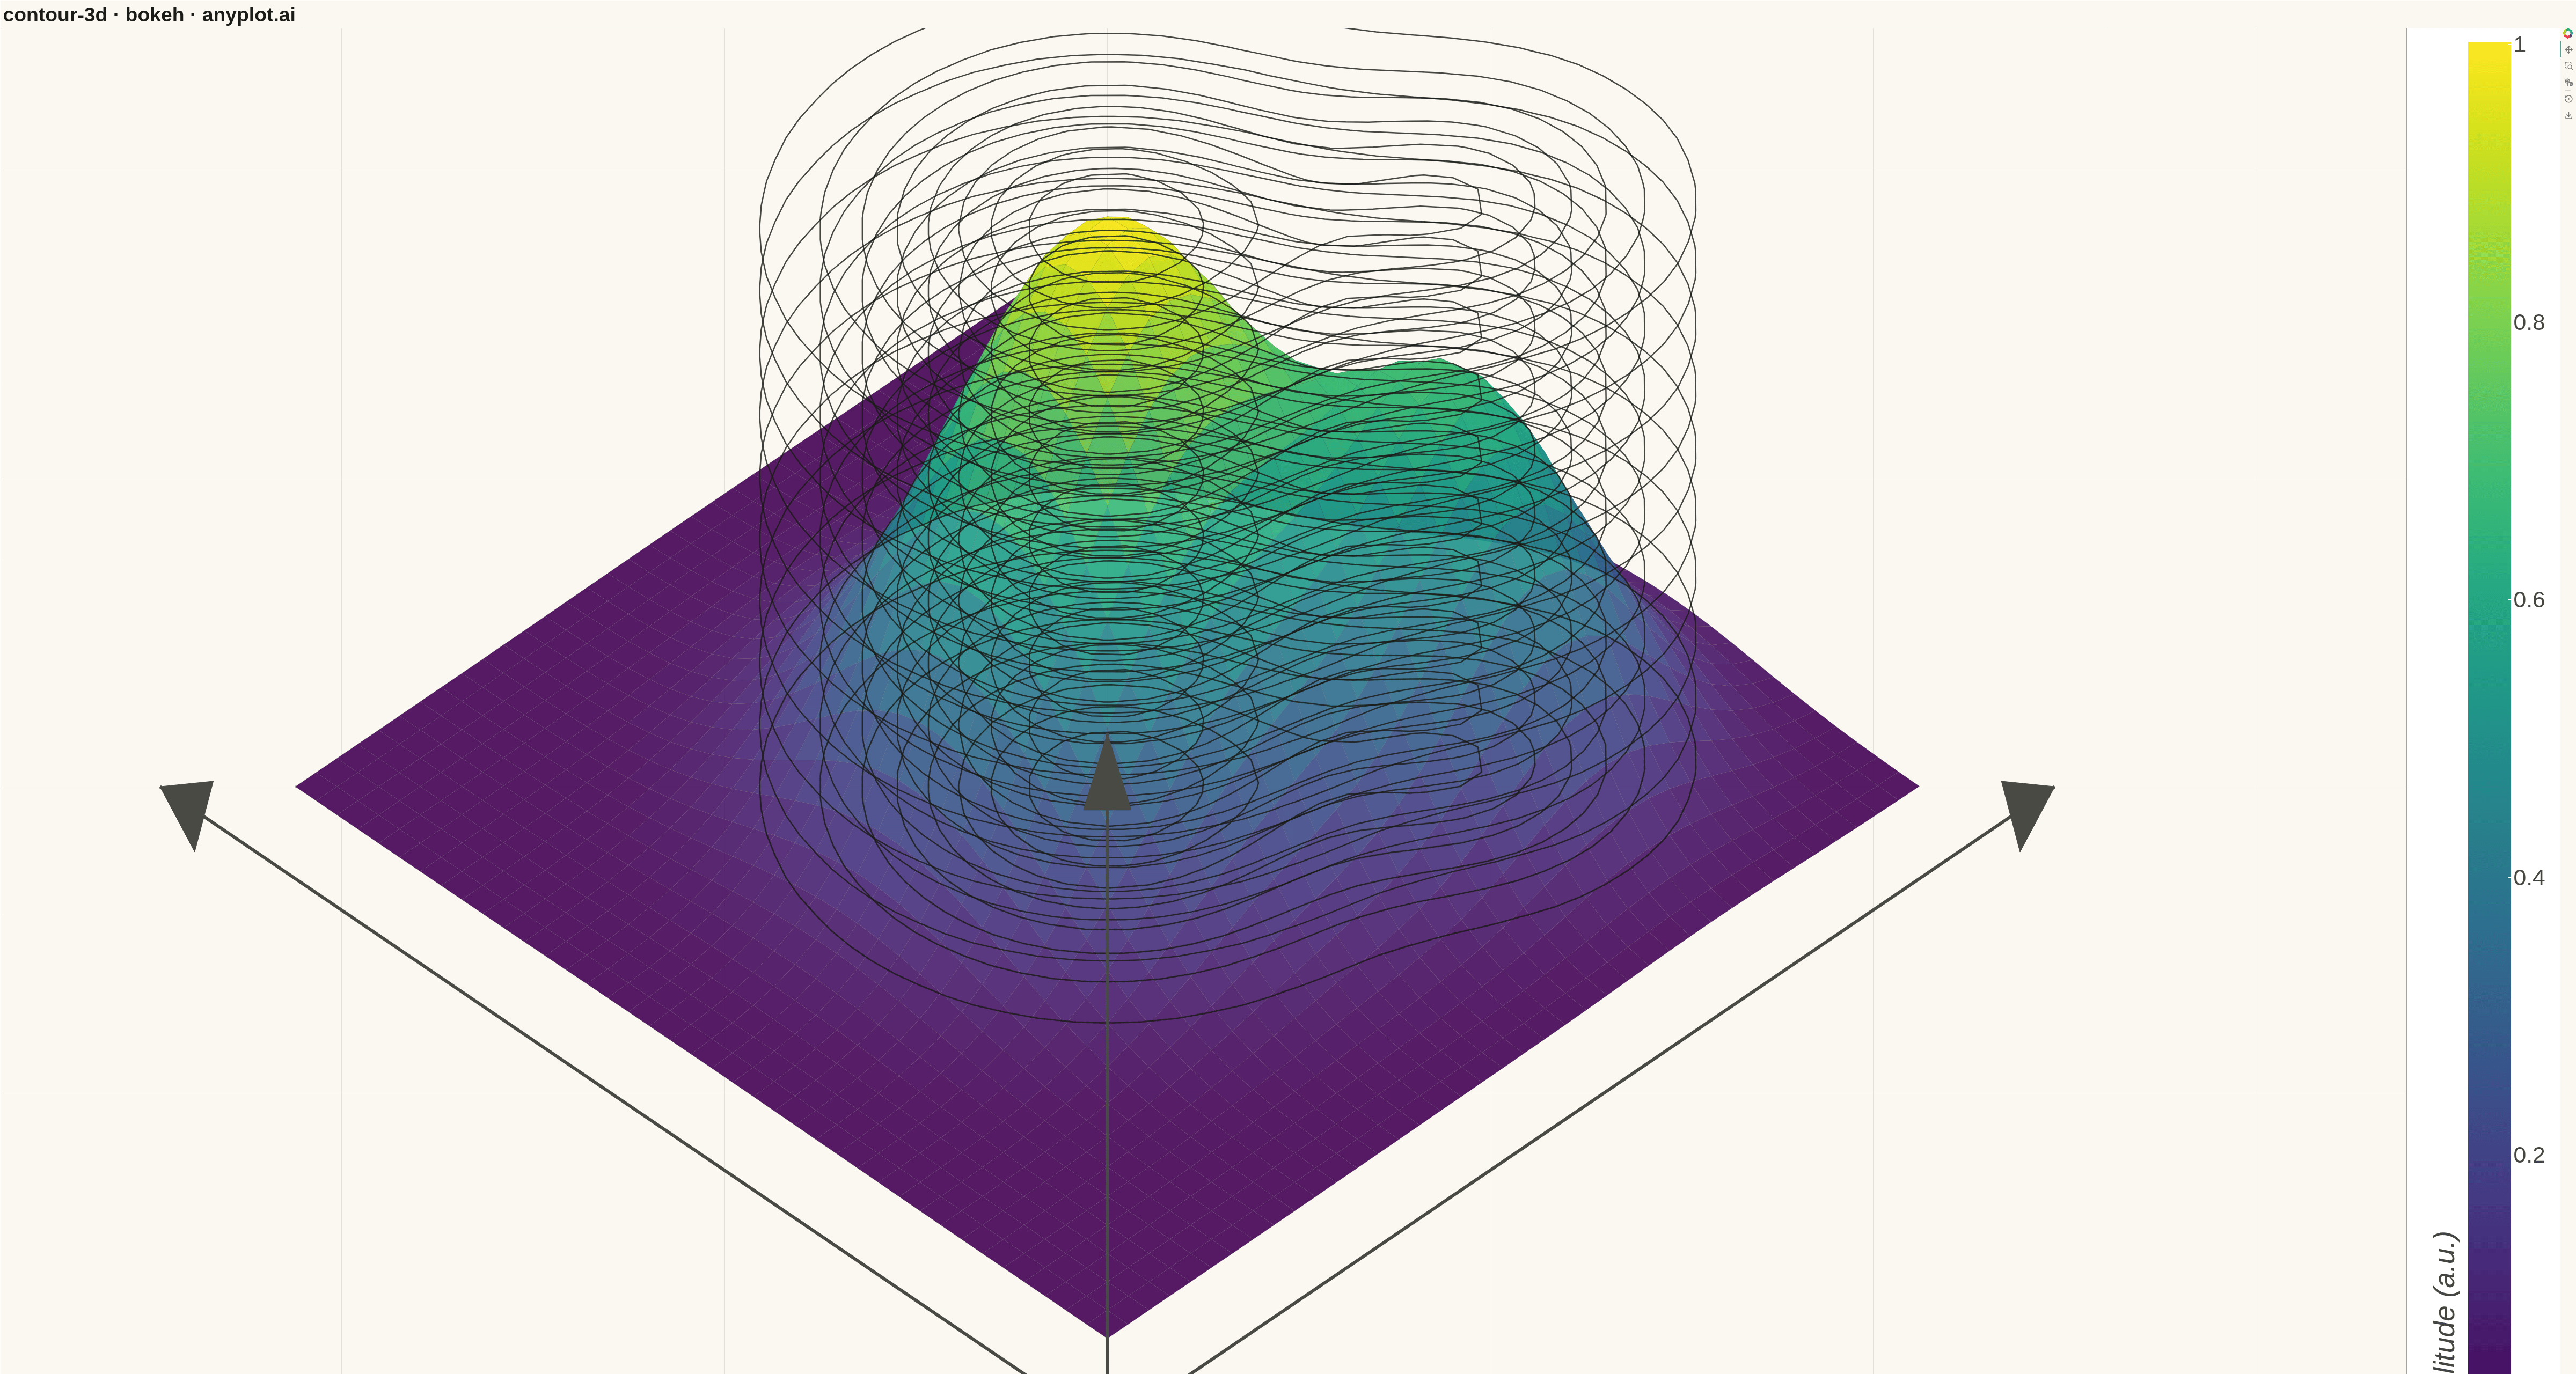
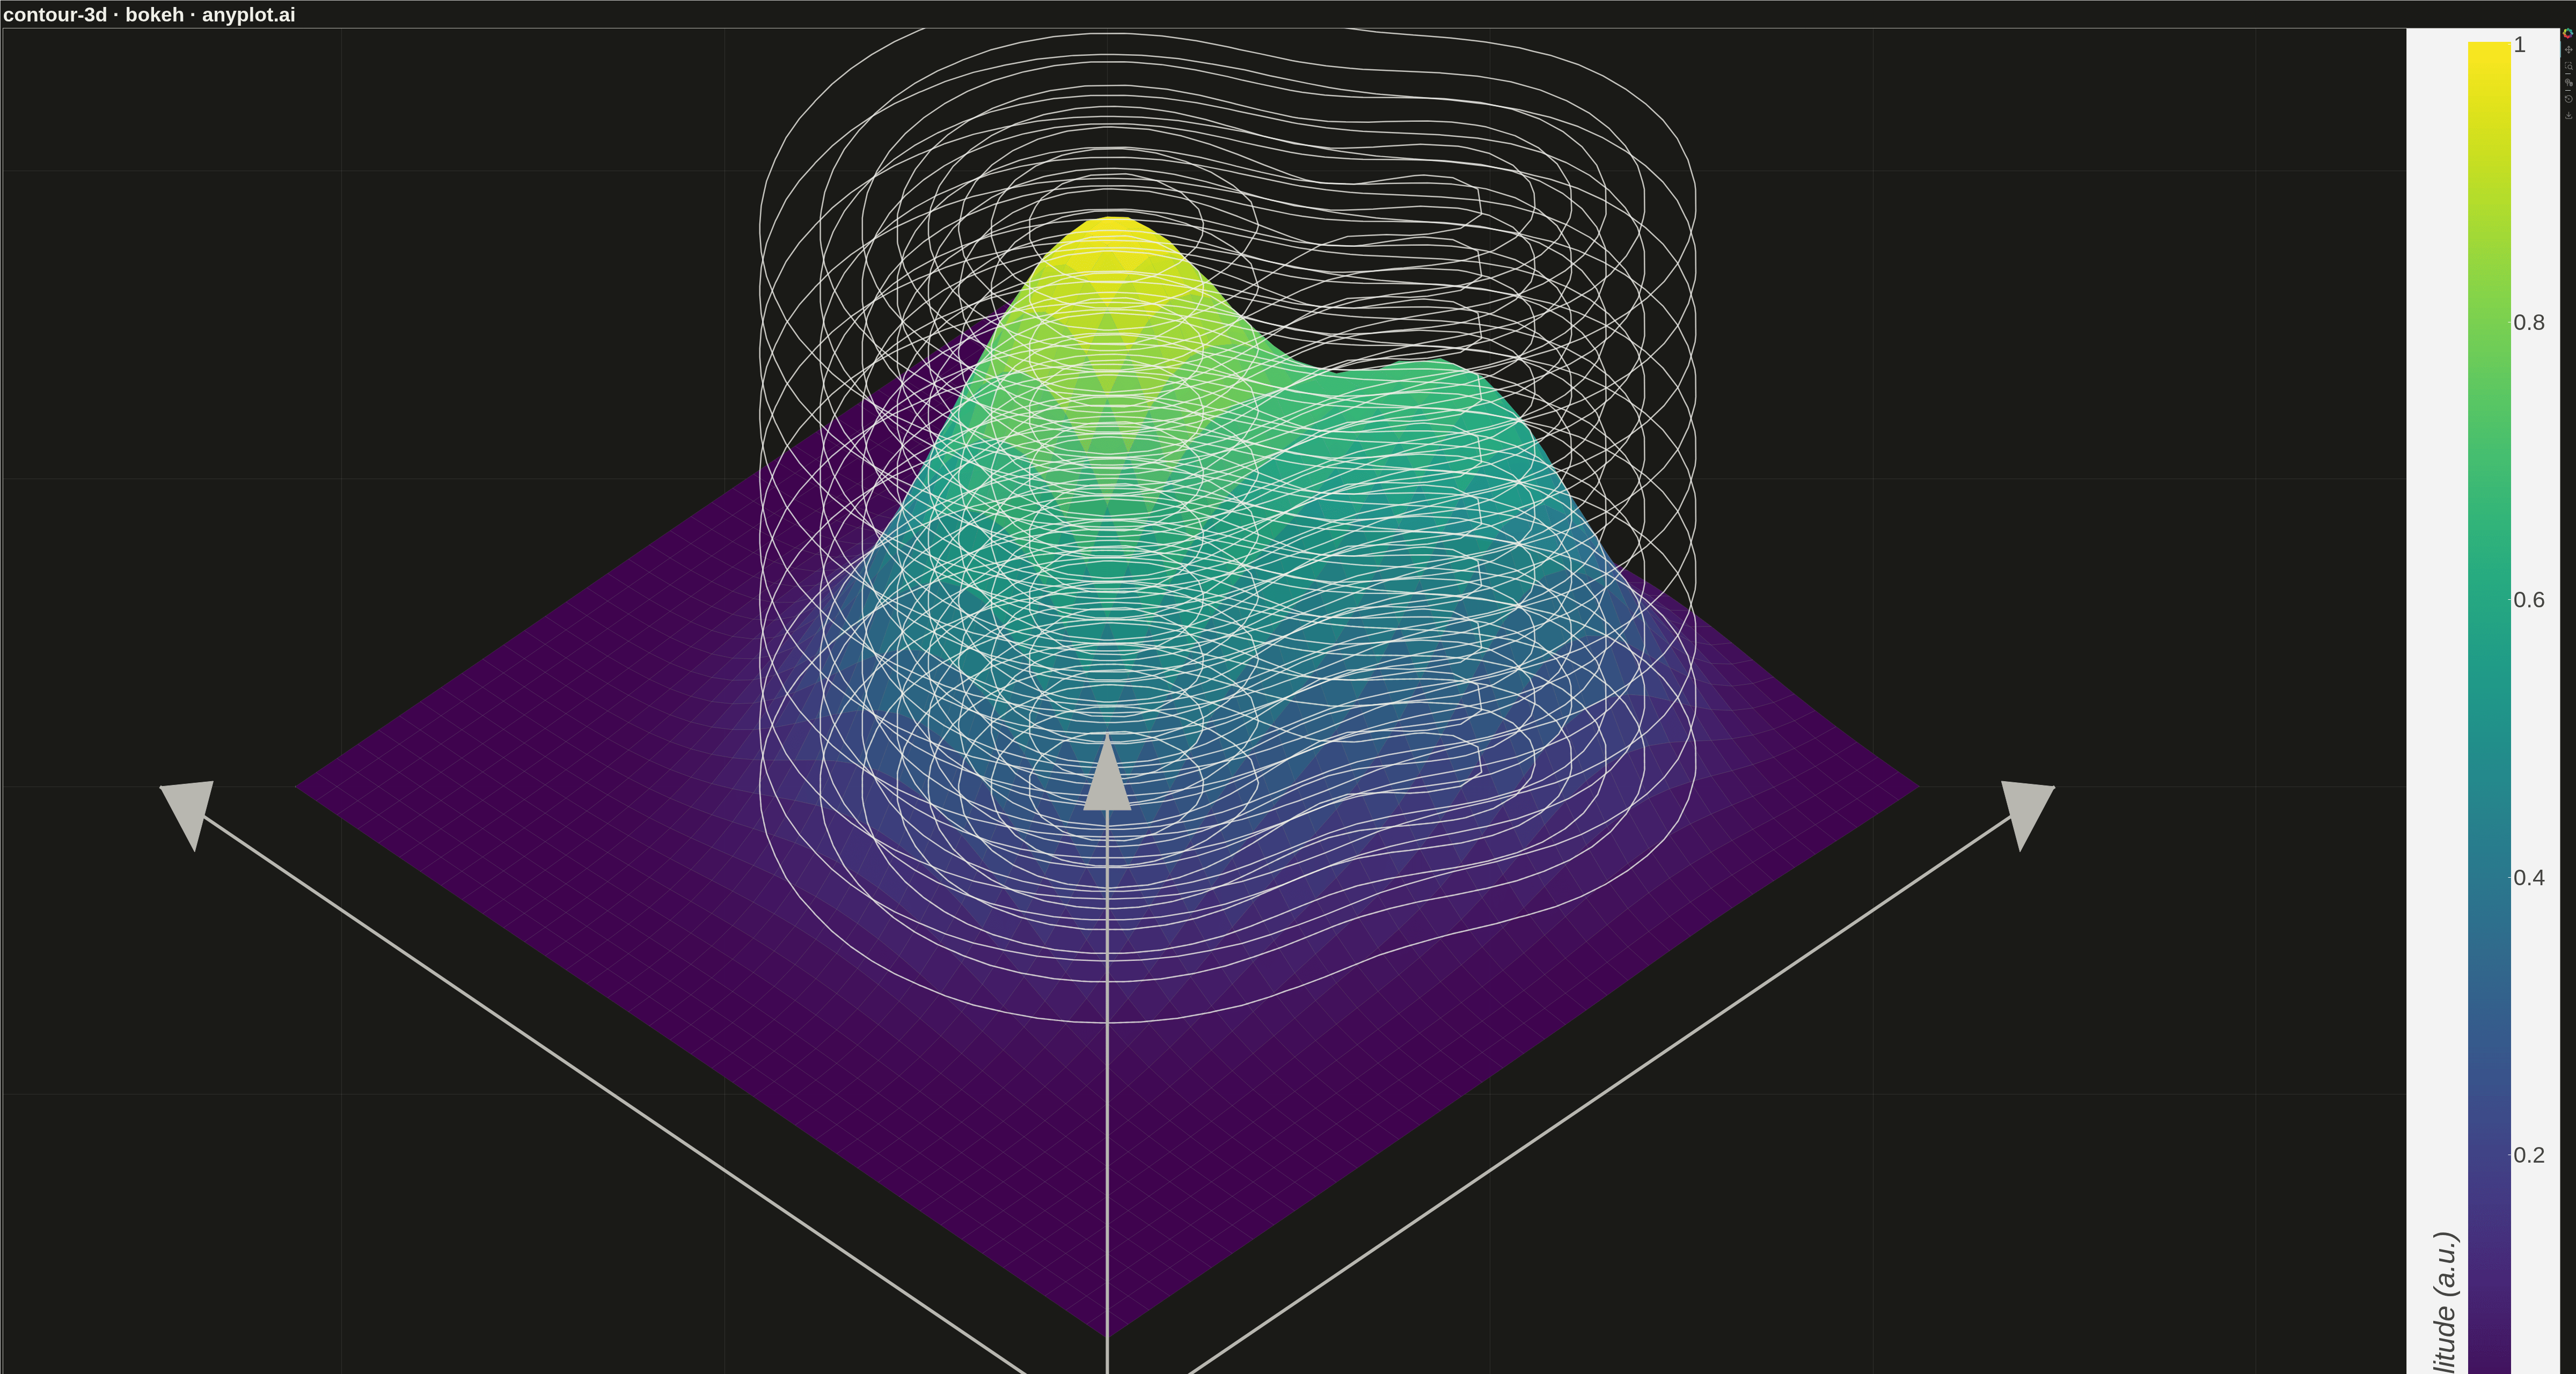
A 3D contour plot displays contour lines or filled contour bands on a three-dimensional surface, showing isolines of a function of two variables in 3D space. Unlike 2D contour plots that flatten the visualization, 3D contour plots preserve the surface geometry while highlighting level curves, making it easier to understand both the overall shape and specific value regions simultaneously. This visualization combines the spatial intuition of 3D surfaces with the precision of contour-based value identification.
""" anyplot.ai
contour-3d: 3D Contour Plot
Library: bokeh 3.9.0 | Python 3.13.13
Quality: 93/100 | Updated: 2026-05-16
"""

import os
import sys
import time
from pathlib import Path


script_dir = os.path.dirname(os.path.abspath(__file__))
if sys.path and (sys.path[0] == "" or sys.path[0] == script_dir):
    sys.path.pop(0)

os.chdir(script_dir)

import matplotlib.pyplot as plt
import numpy as np
from bokeh.io import output_file, save
from bokeh.models import ColorBar, LinearColorMapper, Range1d
from bokeh.palettes import Viridis256
from bokeh.plotting import figure
from selenium import webdriver
from selenium.webdriver.chrome.options import Options


THEME = os.getenv("ANYPLOT_THEME", "light")
PAGE_BG = "#FAF8F1" if THEME == "light" else "#1A1A17"
ELEVATED_BG = "#FFFDF6" if THEME == "light" else "#242420"
INK = "#1A1A17" if THEME == "light" else "#F0EFE8"
INK_SOFT = "#4A4A44" if THEME == "light" else "#B8B7B0"

np.random.seed(42)

n_points = 40
x = np.linspace(-3, 3, n_points)
y = np.linspace(-3, 3, n_points)
X, Y = np.meshgrid(x, y)

Z = 1.0 * np.exp(-(X**2 + Y**2) / 1.5) + 0.6 * np.exp(-((X - 1.5) ** 2 + (Y + 1.2) ** 2) / 0.8)

z_min, z_max = Z.min(), Z.max()

elev_rad = np.radians(25)
azim_rad = np.radians(45)
cos_azim = np.cos(azim_rad)
sin_azim = np.sin(azim_rad)
sin_elev = np.sin(elev_rad)
cos_elev = np.cos(elev_rad)

Z_scaled = (Z - z_min) / (z_max - z_min) * 2

X_proj = np.zeros_like(X)
Z_proj = np.zeros_like(X)
Depth = np.zeros_like(X)

for i in range(n_points):
    for j in range(n_points):
        x_3d, y_3d, z_3d = X[i, j], Y[i, j], Z_scaled[i, j]
        x_rot = x_3d * cos_azim - y_3d * sin_azim
        y_rot = x_3d * sin_azim + y_3d * cos_azim
        X_proj[i, j] = x_rot
        Z_proj[i, j] = y_rot * sin_elev + z_3d * cos_elev
        Depth[i, j] = y_rot * cos_elev - z_3d * sin_elev

n_levels = 10
levels = np.linspace(z_min, z_max, n_levels)

color_mapper = LinearColorMapper(palette=Viridis256, low=z_min, high=z_max)

surface_quads = []
for i in range(n_points - 1):
    for j in range(n_points - 1):
        xs = [X_proj[i, j], X_proj[i + 1, j], X_proj[i + 1, j + 1], X_proj[i, j + 1]]
        ys = [Z_proj[i, j], Z_proj[i + 1, j], Z_proj[i + 1, j + 1], Z_proj[i, j + 1]]

        avg_depth = (Depth[i, j] + Depth[i + 1, j] + Depth[i + 1, j + 1] + Depth[i, j + 1]) / 4
        avg_z = (Z[i, j] + Z[i + 1, j] + Z[i + 1, j + 1] + Z[i, j + 1]) / 4

        idx = int((avg_z - z_min) / (z_max - z_min) * 255)
        idx = max(0, min(255, idx))
        color = Viridis256[idx]

        surface_quads.append((avg_depth, xs, ys, color))

surface_quads.sort(key=lambda q: q[0], reverse=True)

fig_temp, ax_temp = plt.subplots()
contour_set = ax_temp.contour(x, y, Z, levels=levels)
plt.close(fig_temp)

contour_lines_3d = []
base_contours = []

for level_idx, level in enumerate(levels):
    z_height = (level - z_min) / (z_max - z_min) * 2

    paths = contour_set.get_paths()
    for path in paths:
        vertices = path.vertices
        if len(vertices) > 1:
            line_xs = []
            line_ys = []
            line_depths = []
            for pt in vertices:
                x_pt, y_pt = pt
                x_rot = x_pt * cos_azim - y_pt * sin_azim
                y_rot = x_pt * sin_azim + y_pt * cos_azim
                line_xs.append(x_rot)
                line_ys.append(y_rot * sin_elev + z_height * cos_elev)
                line_depths.append(y_rot * cos_elev - z_height * sin_elev)

            if len(line_xs) > 1:
                avg_depth = np.mean(line_depths)
                contour_lines_3d.append((avg_depth, line_xs, line_ys))

            line_xs_base = []
            line_ys_base = []
            line_depths_base = []
            for pt in vertices:
                x_pt, y_pt = pt
                x_rot = x_pt * cos_azim - y_pt * sin_azim
                y_rot = x_pt * sin_azim + y_pt * cos_azim
                line_xs_base.append(x_rot)
                line_ys_base.append(y_rot * sin_elev)
                line_depths_base.append(y_rot * cos_elev)

            if len(line_xs_base) > 1:
                avg_depth = np.mean(line_depths_base)
                idx = int(level_idx * 255 / (n_levels - 1))
                color = Viridis256[idx]
                base_contours.append((avg_depth, line_xs_base, line_ys_base, color))

p = figure(
    width=4800,
    height=2700,
    title="contour-3d · bokeh · anyplot.ai",
    toolbar_location="right",
    tools="pan,wheel_zoom,box_zoom,reset,save",
)

p.xaxis.visible = False
p.yaxis.visible = False

for _depth, xs, ys, color in sorted(base_contours, key=lambda c: c[0], reverse=True):
    p.line(x=xs, y=ys, line_color=color, line_width=3.5, line_alpha=0.65, line_dash="dashed")

for _depth, xs, ys, color in surface_quads:
    p.patch(x=xs, y=ys, fill_color=color, line_color=INK_SOFT, line_width=0.5, line_alpha=0.3, alpha=0.9)

for _depth, xs, ys in sorted(contour_lines_3d, key=lambda c: c[0], reverse=False):
    p.line(x=xs, y=ys, line_color=INK, line_width=2.5, line_alpha=0.8)

all_x_coords = [x for quad in surface_quads for x in quad[1]]
all_y_coords = [y for quad in surface_quads for y in quad[2]]

x_min_plot, x_max_plot = min(all_x_coords), max(all_x_coords)
y_min_plot, y_max_plot = min(all_y_coords), max(all_y_coords)

x_pad = (x_max_plot - x_min_plot) * 0.15
y_pad = (y_max_plot - y_min_plot) * 0.12

p.x_range = Range1d(x_min_plot - x_pad * 1.2, x_max_plot + x_pad * 2.0)
p.y_range = Range1d(y_min_plot - y_pad * 0.8, y_max_plot + y_pad * 1.4)

ox, oy, oz = -3.5, -3.5, 0
origin_x = ox * cos_azim - oy * sin_azim
origin_y = (ox * sin_azim + oy * cos_azim) * sin_elev + oz * cos_elev

axis_color = INK_SOFT
axis_width = 6

ax, ay, az = 3.5, -3.5, 0
x_axis_end_x = ax * cos_azim - ay * sin_azim
x_axis_end_y = (ax * sin_azim + ay * cos_azim) * sin_elev + az * cos_elev
p.line(x=[origin_x, x_axis_end_x], y=[origin_y, x_axis_end_y], line_color=axis_color, line_width=axis_width)

bx, by, bz = -3.5, 3.5, 0
y_axis_end_x = bx * cos_azim - by * sin_azim
y_axis_end_y = (bx * sin_azim + by * cos_azim) * sin_elev + bz * cos_elev
p.line(x=[origin_x, y_axis_end_x], y=[origin_y, y_axis_end_y], line_color=axis_color, line_width=axis_width)

cx, cy, cz = -3.5, -3.5, 2.5
z_axis_end_x = cx * cos_azim - cy * sin_azim
z_axis_end_y = (cx * sin_azim + cy * cos_azim) * sin_elev + cz * cos_elev
p.line(x=[origin_x, z_axis_end_x], y=[origin_y, z_axis_end_y], line_color=axis_color, line_width=axis_width)

arrow_size = 0.25

x_dir = np.array([x_axis_end_x - origin_x, x_axis_end_y - origin_y])
x_dir = x_dir / np.linalg.norm(x_dir)
x_perp = np.array([-x_dir[1], x_dir[0]])
p.patch(
    x=[
        x_axis_end_x,
        x_axis_end_x - arrow_size * x_dir[0] + arrow_size * 0.5 * x_perp[0],
        x_axis_end_x - arrow_size * x_dir[0] - arrow_size * 0.5 * x_perp[0],
    ],
    y=[
        x_axis_end_y,
        x_axis_end_y - arrow_size * x_dir[1] + arrow_size * 0.5 * x_perp[1],
        x_axis_end_y - arrow_size * x_dir[1] - arrow_size * 0.5 * x_perp[1],
    ],
    fill_color=axis_color,
    line_color=axis_color,
)

y_dir = np.array([y_axis_end_x - origin_x, y_axis_end_y - origin_y])
y_dir = y_dir / np.linalg.norm(y_dir)
y_perp = np.array([-y_dir[1], y_dir[0]])
p.patch(
    x=[
        y_axis_end_x,
        y_axis_end_x - arrow_size * y_dir[0] + arrow_size * 0.5 * y_perp[0],
        y_axis_end_x - arrow_size * y_dir[0] - arrow_size * 0.5 * y_perp[0],
    ],
    y=[
        y_axis_end_y,
        y_axis_end_y - arrow_size * y_dir[1] + arrow_size * 0.5 * y_perp[1],
        y_axis_end_y - arrow_size * y_dir[1] - arrow_size * 0.5 * y_perp[1],
    ],
    fill_color=axis_color,
    line_color=axis_color,
)

z_dir = np.array([z_axis_end_x - origin_x, z_axis_end_y - origin_y])
z_dir = z_dir / np.linalg.norm(z_dir)
z_perp = np.array([-z_dir[1], z_dir[0]])
p.patch(
    x=[
        z_axis_end_x,
        z_axis_end_x - arrow_size * z_dir[0] + arrow_size * 0.5 * z_perp[0],
        z_axis_end_x - arrow_size * z_dir[0] - arrow_size * 0.5 * z_perp[0],
    ],
    y=[
        z_axis_end_y,
        z_axis_end_y - arrow_size * z_dir[1] + arrow_size * 0.5 * z_perp[1],
        z_axis_end_y - arrow_size * z_dir[1] - arrow_size * 0.5 * z_perp[1],
    ],
    fill_color=axis_color,
    line_color=axis_color,
)

color_bar = ColorBar(
    color_mapper=color_mapper,
    width=80,
    location=(0, 0),
    title="Amplitude (a.u.)",
    title_text_font_size="40pt",
    major_label_text_font_size="32pt",
    title_standoff=30,
    margin=50,
    padding=25,
)
p.add_layout(color_bar, "right")

p.title.text_font_size = "28pt"
p.title.text_color = INK

p.background_fill_color = PAGE_BG
p.border_fill_color = PAGE_BG
p.outline_line_color = INK_SOFT

p.xgrid.grid_line_color = INK
p.ygrid.grid_line_color = INK
p.xgrid.grid_line_alpha = 0.10
p.ygrid.grid_line_alpha = 0.10

if p.legend:
    p.legend.background_fill_color = ELEVATED_BG
    p.legend.border_line_color = INK_SOFT
    p.legend.label_text_color = INK_SOFT

output_file(f"plot-{THEME}.html")
save(p)

W, H = 4800, 2700
opts = Options()
for arg in (
    "--headless=new",
    "--no-sandbox",
    "--disable-dev-shm-usage",
    "--disable-gpu",
    f"--window-size={W},{H}",
    "--hide-scrollbars",
):
    opts.add_argument(arg)
driver = webdriver.Chrome(options=opts)
driver.set_window_size(W, H)
driver.get(f"file://{Path(f'plot-{THEME}.html').resolve()}")
time.sleep(3)
driver.save_screenshot(f"plot-{THEME}.png")
driver.quit()
Runnable source as JSON, for any HTTP client: https://api.anyplot.ai/specs/contour-3d/bokeh/code. Any spec id and library id listed in llms-full.txt fit the same URL shape; every URL below is complete and callable.
{
  "spec_id": "contour-3d",
  "language": "python",
  "library": "bokeh",
  "page": "https://anyplot.ai/contour-3d/python/bokeh",
  "hub": "https://anyplot.ai/contour-3d",
  "code_json": "https://api.anyplot.ai/specs/contour-3d/bokeh/code",
  "spec_json": "https://api.anyplot.ai/specs/contour-3d",
  "render_light_png": "https://storage.googleapis.com/anyplot-images/plots/contour-3d/python/bokeh/plot-light.png",
  "render_dark_png": "https://storage.googleapis.com/anyplot-images/plots/contour-3d/python/bokeh/plot-dark.png",
  "interactive_light_html": "https://storage.googleapis.com/anyplot-images/plots/contour-3d/python/bokeh/plot-light.html",
  "interactive_dark_html": "https://storage.googleapis.com/anyplot-images/plots/contour-3d/python/bokeh/plot-dark.html",
  "quality_score": 93.0,
  "license": "MIT",
  "guide": "https://anyplot.ai/llms.txt"
}
Part of 3D Contour Plot on anyplot.ai.