The same plot in 13 other libraries — JavaScript: Chart.js, D3.js, Highcharts, MUI X Charts; Python: Altair, Bokeh, lets-plot, Matplotlib, Plotly, Pygal, Seaborn; R: ggplot2; Julia: Makie.jl. Compare all 14 side by side: 3D Contour Plot in Python, R, Julia and JavaScript.
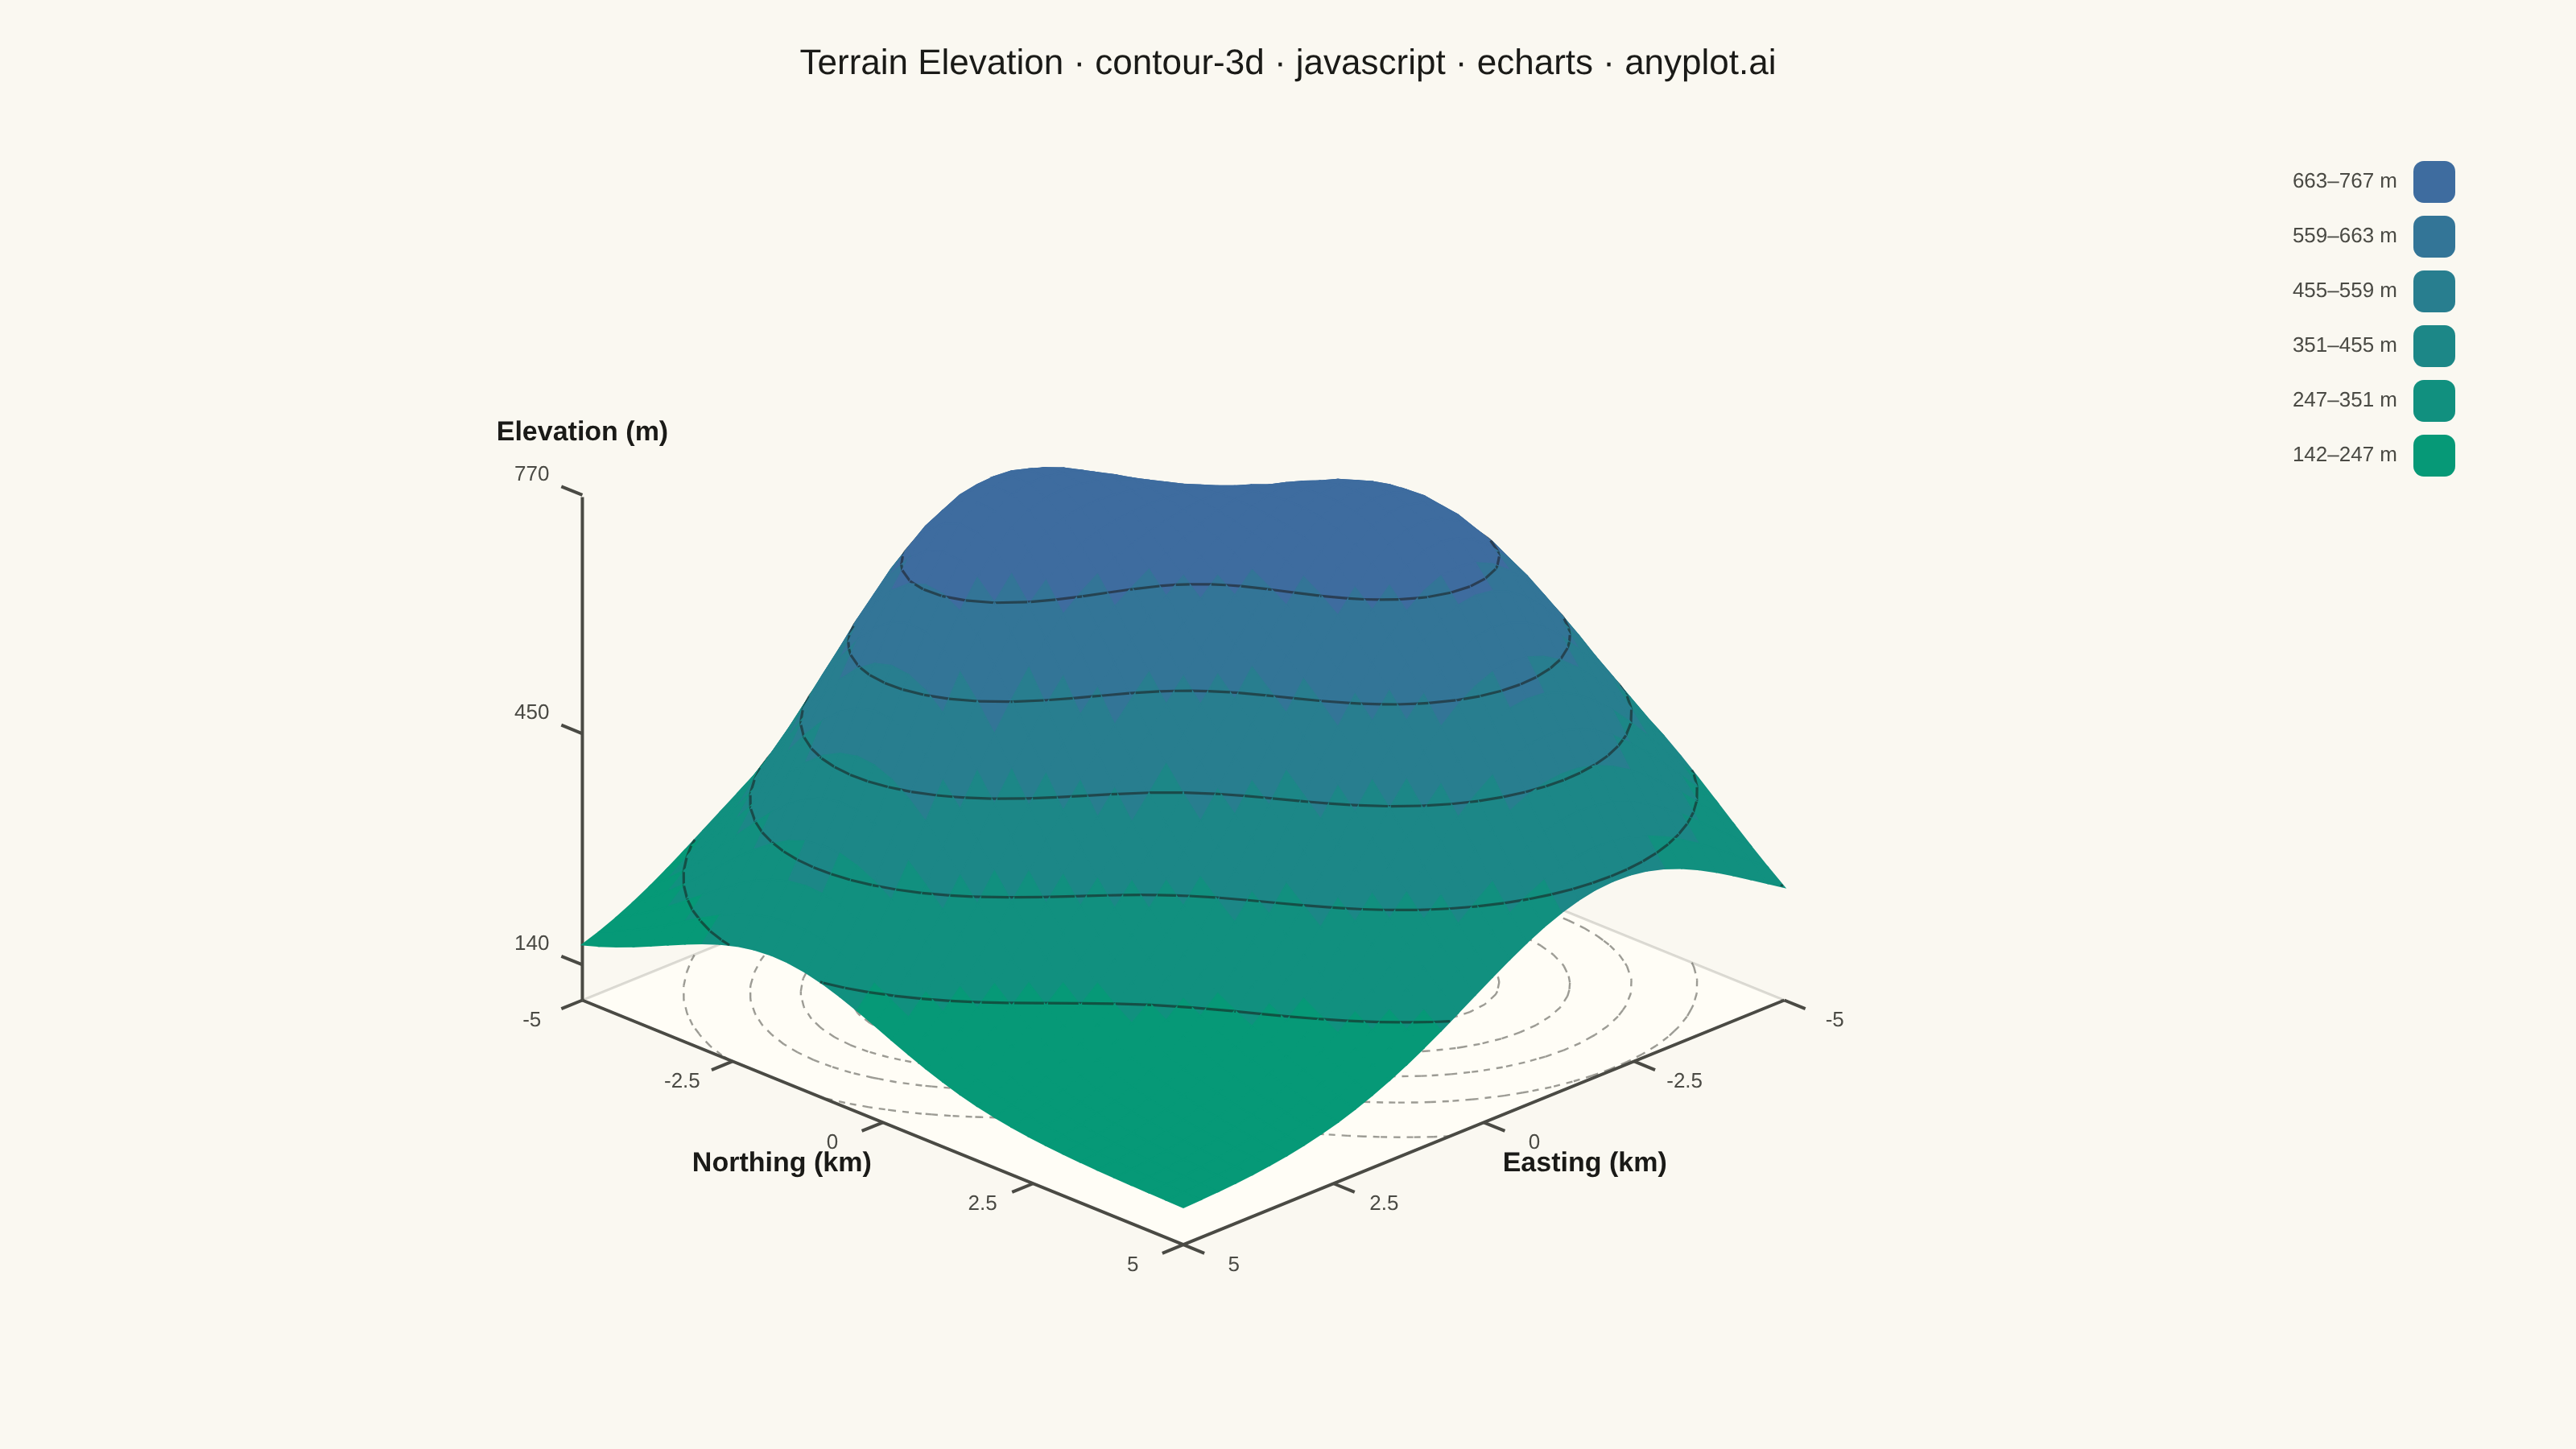
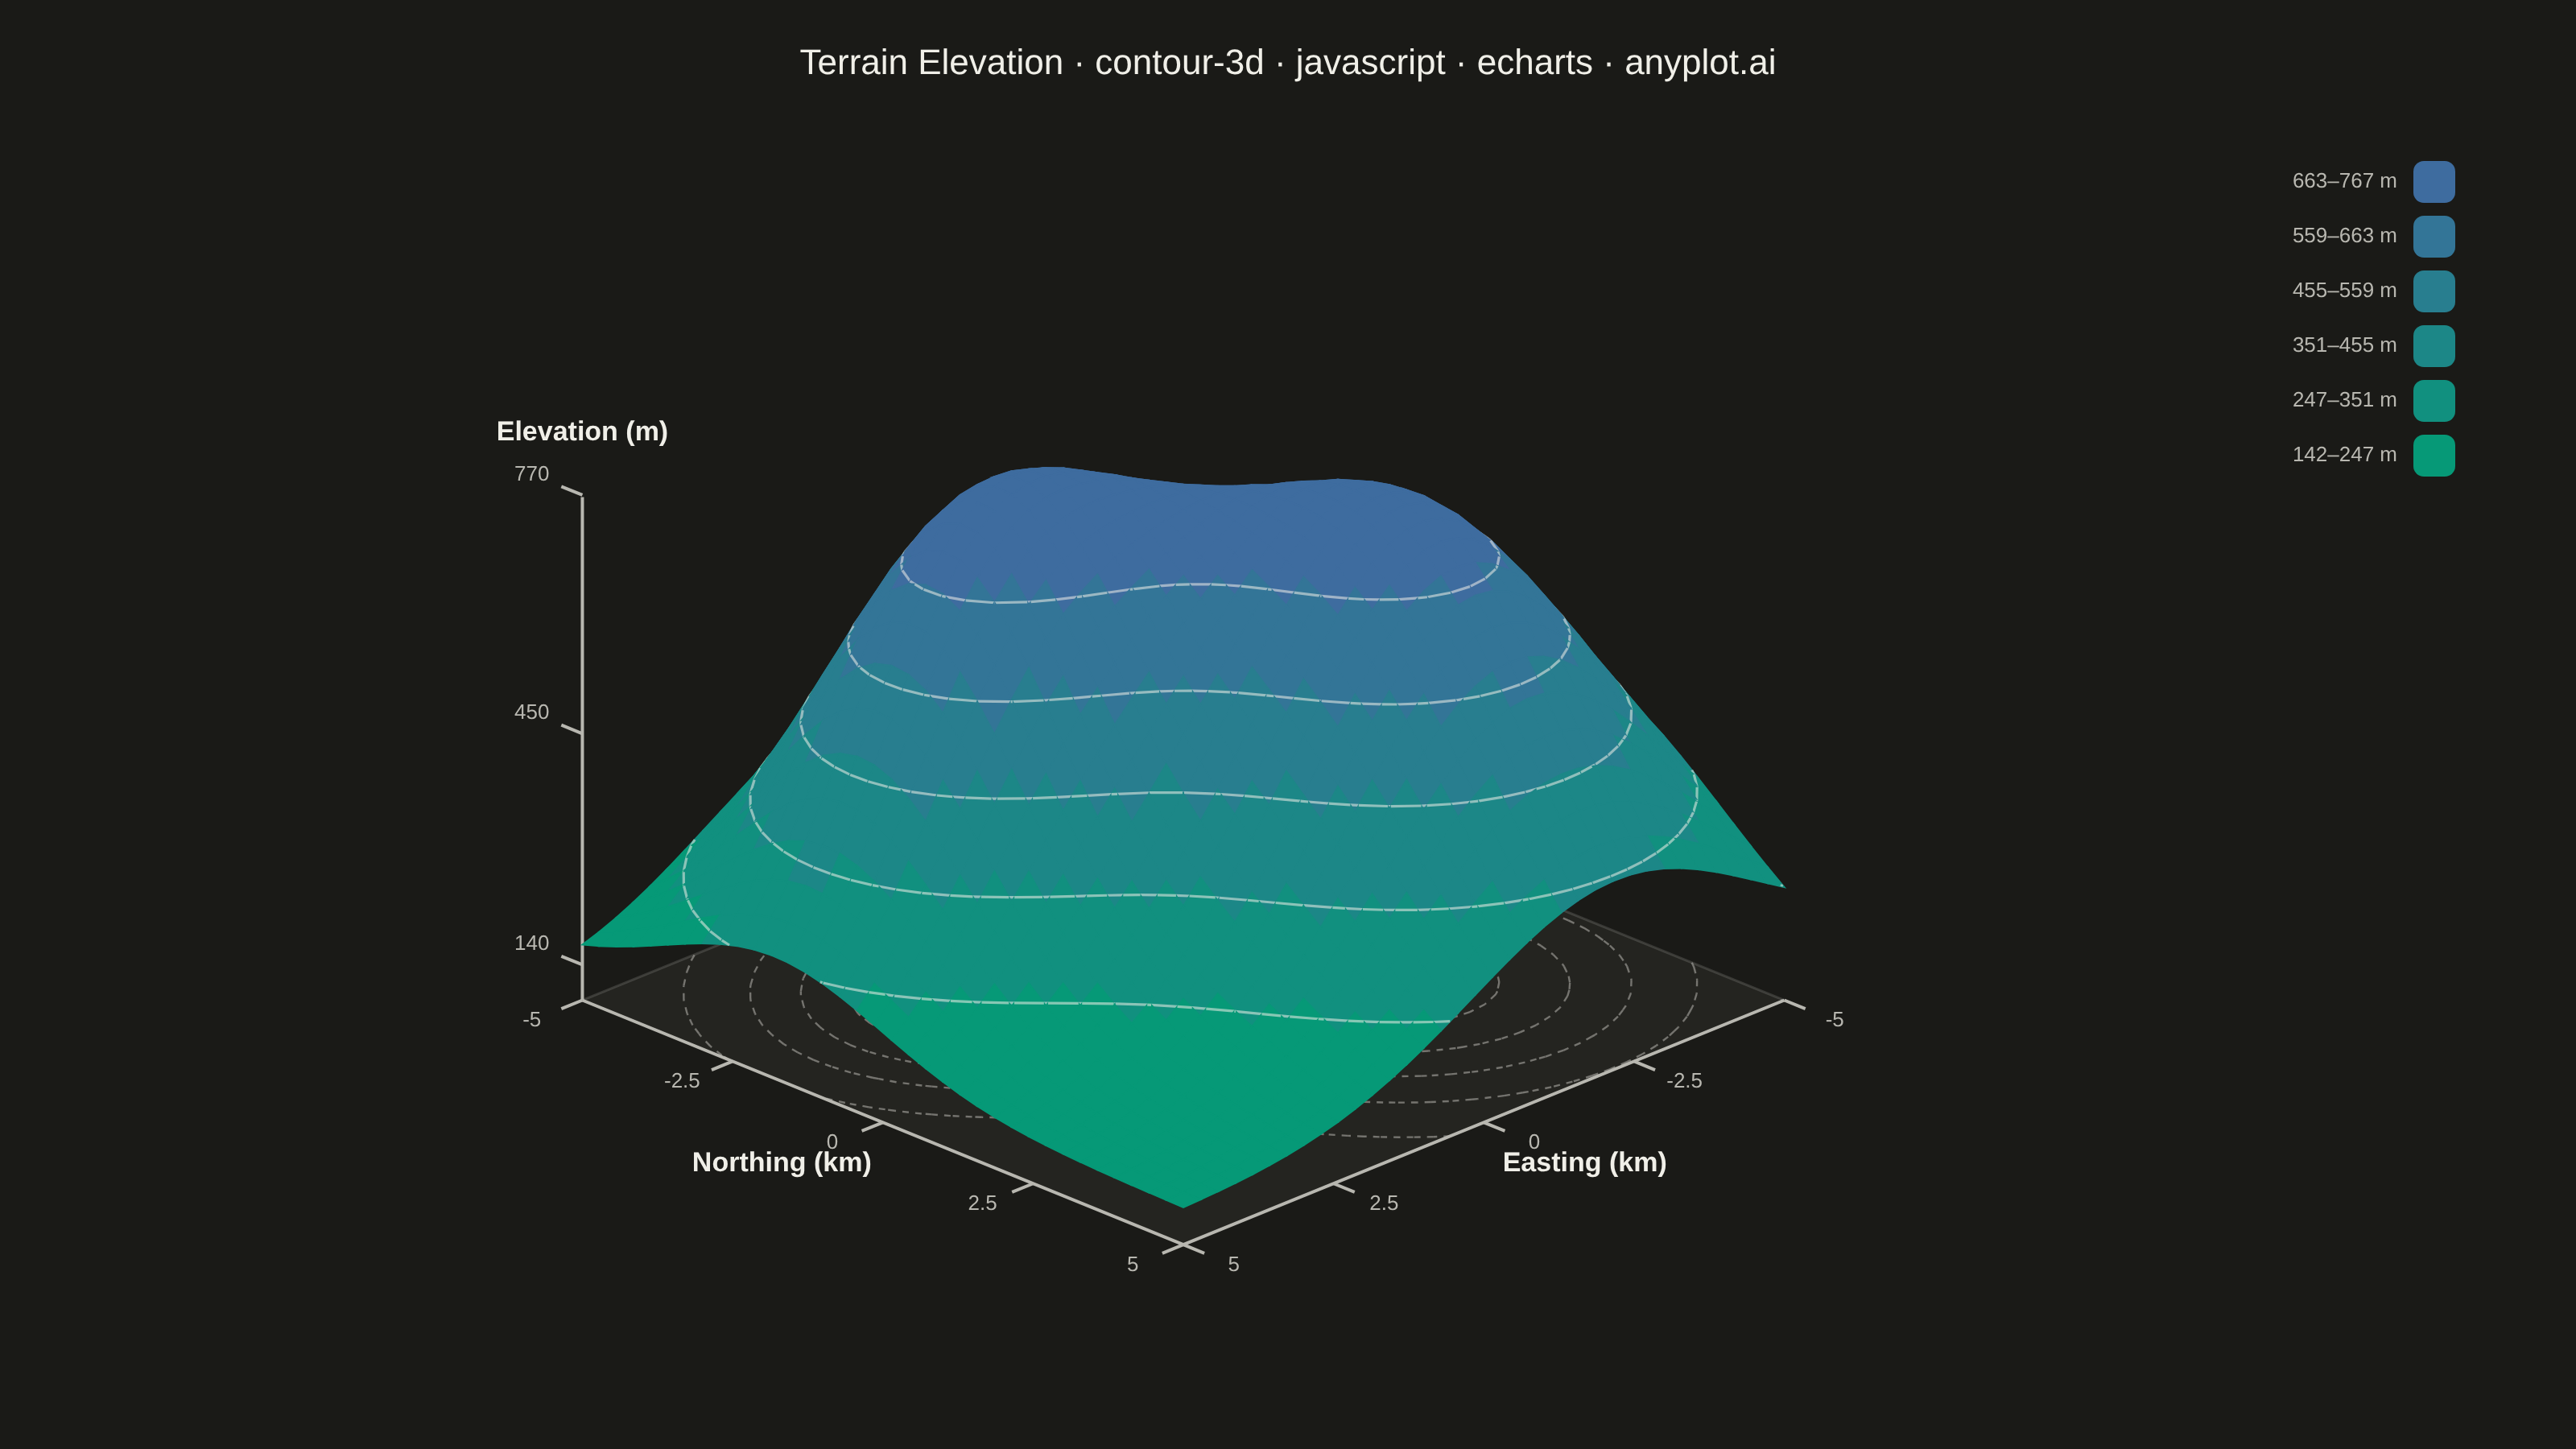
A 3D contour plot displays contour lines or filled contour bands on a three-dimensional surface, showing isolines of a function of two variables in 3D space. Unlike 2D contour plots that flatten the visualization, 3D contour plots preserve the surface geometry while highlighting level curves, making it easier to understand both the overall shape and specific value regions simultaneously. This visualization combines the spatial intuition of 3D surfaces with the precision of contour-based value identification.
// anyplot.ai
// contour-3d: 3D Contour Plot
// Library: echarts 6.1.0 | JavaScript 22.23.2
// Quality: 88/100 | Created: 2026-09-10

const t = window.ANYPLOT_TOKENS;
const size = window.ANYPLOT_SIZE;

// --- Data: synthetic terrain elevation from three overlapping hills --------
const GRID_N = 36;
const RANGE = 5; // km, both x and y span [-RANGE, RANGE]
const step = (2 * RANGE) / (GRID_N - 1);
const xs = Array.from({ length: GRID_N }, (_, i) => -RANGE + i * step);
const ys = Array.from({ length: GRID_N }, (_, i) => -RANGE + i * step);

const HILLS = [
  { cx: -2.2, cy: 1.6, height: 560, spread: 2.4 },
  { cx: 2.0, cy: -1.8, height: 430, spread: 1.8 },
  { cx: -1.0, cy: -2.9, height: 300, spread: 2.2 },
];
const BASE_ELEVATION = 140;

function elevation(x, y) {
  return HILLS.reduce((sum, h) => {
    const dx = x - h.cx;
    const dy = y - h.cy;
    return (
      sum +
      h.height * Math.exp(-(dx * dx + dy * dy) / (2 * h.spread * h.spread))
    );
  }, BASE_ELEVATION);
}

const zGrid = xs.map((x) => ys.map((y) => elevation(x, y)));
const zFlat = zGrid.flat();
const zMin = Math.min(...zFlat);
const zMax = Math.max(...zFlat);
const zSpan = zMax - zMin;
const zMid = (zMin + zMax) / 2;

// --- Contour levels: 5 interior thresholds -> 6 filled elevation bands -----
const N_LEVELS = 5;
const N_BANDS = N_LEVELS + 1;
const levels = Array.from(
  { length: N_LEVELS },
  (_, k) => zMin + (zSpan * (k + 1)) / (N_LEVELS + 1),
);
const bandBoundaries = [zMin, ...levels, zMax];

function hexToRgb(hex) {
  const n = parseInt(hex.slice(1), 16);
  return { r: (n >> 16) & 255, g: (n >> 8) & 255, b: n & 255 };
}
function lerpColor(hexA, hexB, frac) {
  const a = hexToRgb(hexA);
  const b = hexToRgb(hexB);
  const mix = (u, v) => Math.round(u + (v - u) * frac);
  return `rgb(${mix(a.r, b.r)}, ${mix(a.g, b.g)}, ${mix(a.b, b.b)})`;
}
// Imprint sequential ramp (green -> blue), sampled at each band's midpoint
// so the filled bands read as discrete steps rather than a smooth gradient.
const bandColors = Array.from({ length: N_BANDS }, (_, b) =>
  lerpColor(t.seq[0], t.seq[1], (b + 0.5) / N_BANDS),
);
const pieces = bandColors.map((color, b) => ({
  min: bandBoundaries[b],
  max: bandBoundaries[b + 1],
  color,
  label: `${Math.round(bandBoundaries[b])}–${Math.round(bandBoundaries[b + 1])} m`,
}));

// --- Camera: orthographic axonometric projection (elevation + azimuth) -----
// A flatter elevation (24 deg, vs. a more common 30) keeps the projected
// footprint closer to the mount's own 16:9 proportions — a steeper camera
// left much of the canvas empty on either side of a comparatively small,
// tall silhouette. ELEVATION/AZIMUTH are mutable (not const): dragging the
// mount re-orbits the camera, which is the spec's "enable rotation for
// interactive libraries" applied to a custom (non-echarts-gl) projection.
let ELEVATION = (24 * Math.PI) / 180;
let AZIMUTH = (45 * Math.PI) / 180;
let sinAz, cosAz, sinEl, cosEl;
function updateTrig() {
  sinAz = Math.sin(AZIMUTH);
  cosAz = Math.cos(AZIMUTH);
  sinEl = Math.sin(ELEVATION);
  cosEl = Math.cos(ELEVATION);
}
updateTrig();
const ZSCALE = 0.6; // compresses height relative to the x/y footprint
// The base plane sits below the lowest terrain point so its projected
// footprint never overlaps the terrain's screen area, regardless of paint
// order — a "floor" the contour lines can be projected onto for reference.
const FLOOR_Z = zMin - zSpan * 0.08;

function projectRaw(x, y, zData) {
  const xn = x / RANGE;
  const yn = y / RANGE;
  const zn = ((zData - zMid) / zSpan) * 2 * ZSCALE;
  const screenX = -xn * sinAz + yn * cosAz;
  const screenY = -xn * cosAz * sinEl - yn * sinAz * sinEl + zn * cosEl;
  return { screenX, screenY };
}

// --- Fit the projected bounding box (terrain + floor plane) into the mount -
// LABEL_MARGIN extends the fitted box beyond the data cube so the axis
// titles (anchored past the last tick, see below) still land inside the
// canvas instead of being clipped at the mount edge. Re-run after every
// camera change since rotating shifts the projected bounding box.
const LABEL_MARGIN = 2.4;
const TOP_MARGIN = 65;
const BOTTOM_MARGIN = 35;
const LEFT_MARGIN = 90;
const RIGHT_MARGIN = 220; // room for the piecewise elevation legend
const drawW = size.width - LEFT_MARGIN - RIGHT_MARGIN;
const drawH = size.height - TOP_MARGIN - BOTTOM_MARGIN;
const PAD = 1.05; // small extra breathing room now that LABEL_MARGIN covers the titles

let scale, originX, originY;
function fitProjection() {
  const corners = [];
  for (const x of [-RANGE - LABEL_MARGIN, RANGE + LABEL_MARGIN]) {
    for (const y of [-RANGE - LABEL_MARGIN, RANGE + LABEL_MARGIN]) {
      for (const z of [FLOOR_Z, zMax]) corners.push(projectRaw(x, y, z));
    }
  }
  const sxs = corners.map((c) => c.screenX);
  const sys = corners.map((c) => c.screenY);
  const boxW = Math.max(...sxs) - Math.min(...sxs);
  const boxH = Math.max(...sys) - Math.min(...sys);
  const boxCx = (Math.max(...sxs) + Math.min(...sxs)) / 2;
  const boxCy = (Math.max(...sys) + Math.min(...sys)) / 2;
  scale = Math.min(drawW / (boxW * PAD), drawH / (boxH * PAD));
  originX = LEFT_MARGIN + drawW / 2 - boxCx * scale;
  originY = TOP_MARGIN + drawH / 2 + boxCy * scale;
}
fitProjection();

function toPixel(x, y, zData) {
  const { screenX, screenY } = projectRaw(x, y, zData);
  return [originX + screenX * scale, originY - screenY * scale];
}
function projectIdx(i, j, zData) {
  return toPixel(xs[i], ys[j], zData);
}

// --- Marching squares: extract isolines at a given elevation level ---------
// Operates entirely in data space (x, y, z) — independent of the camera, so
// it only needs to run once regardless of how the scene is later rotated.
function marchingSquares(level) {
  const segments = [];
  for (let i = 0; i < GRID_N - 1; i += 1) {
    for (let j = 0; j < GRID_N - 1; j += 1) {
      const x0 = xs[i];
      const x1 = xs[i + 1];
      const y0 = ys[j];
      const y1 = ys[j + 1];
      const zBL = zGrid[i][j];
      const zBR = zGrid[i + 1][j];
      const zTR = zGrid[i + 1][j + 1];
      const zTL = zGrid[i][j + 1];
      let caseIndex = 0;
      if (zBL > level) caseIndex |= 1;
      if (zBR > level) caseIndex |= 2;
      if (zTR > level) caseIndex |= 4;
      if (zTL > level) caseIndex |= 8;
      if (caseIndex === 0 || caseIndex === 15) continue;

      const lerp = (xa, ya, za, xb, yb, zb) => {
        const frac = (level - za) / (zb - za);
        return [xa + frac * (xb - xa), ya + frac * (yb - ya)];
      };
      const bottom = () => lerp(x0, y0, zBL, x1, y0, zBR);
      const right = () => lerp(x1, y0, zBR, x1, y1, zTR);
      const top = () => lerp(x1, y1, zTR, x0, y1, zTL);
      const left = () => lerp(x0, y1, zTL, x0, y0, zBL);

      // Standard marching-squares edge table; cases 5 and 10 are the
      // ambiguous saddle configurations, resolved with a fixed pairing.
      const edgeTable = {
        1: [[left, bottom]],
        2: [[bottom, right]],
        3: [[left, right]],
        4: [[right, top]],
        5: [
          [left, bottom],
          [right, top],
        ],
        6: [[bottom, top]],
        7: [[left, top]],
        8: [[top, left]],
        9: [[top, bottom]],
        10: [
          [bottom, left],
          [top, right],
        ],
        11: [[top, right]],
        12: [[right, left]],
        13: [[right, bottom]],
        14: [[bottom, left]],
      };
      edgeTable[caseIndex].forEach(([edgeA, edgeB]) => {
        const [px1, py1] = edgeA();
        const [px2, py2] = edgeB();
        segments.push({ i, j, x1: px1, y1: py1, x2: px2, y2: py2 });
      });
    }
  }
  return segments;
}
const contoursByLevel = levels.map((level) => ({
  level,
  segments: marchingSquares(level),
}));

// --- Draw items: terrain quads (visualMap-colored) + surface contour lines -
// One custom series so both share a single z2 stacking order: each isoline
// segment is keyed to the grid cell it crosses, drawn just above that cell's
// quad, which keeps lines readable on top of their own patch of terrain
// while neighboring cells still paint in roughly back-to-front order.
const drawItems = [];
for (let i = 0; i < GRID_N - 1; i += 1) {
  for (let j = 0; j < GRID_N - 1; j += 1) {
    const avg =
      (zGrid[i][j] + zGrid[i + 1][j] + zGrid[i + 1][j + 1] + zGrid[i][j + 1]) /
      4;
    drawItems.push({ kind: "quad", i, j, value: avg });
  }
}
contoursByLevel.forEach(({ level, segments }) => {
  segments.forEach((seg) =>
    drawItems.push({ kind: "line", level, value: level, ...seg }),
  );
});

const LINE_COLOR = t.ink;

function renderItem(params, api) {
  const item = drawItems[params.dataIndex];
  if (item.kind === "quad") {
    const points = [
      projectIdx(item.i, item.j, zGrid[item.i][item.j]),
      projectIdx(item.i + 1, item.j, zGrid[item.i + 1][item.j]),
      projectIdx(item.i + 1, item.j + 1, zGrid[item.i + 1][item.j + 1]),
      projectIdx(item.i, item.j + 1, zGrid[item.i][item.j + 1]),
    ];
    const color = api.visual("color");
    return {
      type: "polygon",
      z2: 1000 + item.i + item.j,
      shape: { points },
      // Stroking each quad with its own fill color (instead of leaving it
      // bare) blends the antialiasing seam between adjacent same-color
      // quads into a smooth surface instead of a faint crosshatch texture.
      style: { fill: color, stroke: color, lineWidth: 1 },
    };
  }
  const p1 = toPixel(item.x1, item.y1, item.level);
  const p2 = toPixel(item.x2, item.y2, item.level);
  return {
    type: "line",
    z2: 1000 + item.i + item.j + 0.5,
    shape: { x1: p1[0], y1: p1[1], x2: p2[0], y2: p2[1] },
    style: { stroke: LINE_COLOR, lineWidth: 1.6, opacity: 0.55 },
    silent: true,
  };
}

// --- Floor plane: the same isolines projected down, for orientation -------
function buildFloorElements() {
  const floorElements = [
    {
      type: "polygon",
      shape: {
        points: [
          toPixel(-RANGE, -RANGE, FLOOR_Z),
          toPixel(RANGE, -RANGE, FLOOR_Z),
          toPixel(RANGE, RANGE, FLOOR_Z),
          toPixel(-RANGE, RANGE, FLOOR_Z),
        ],
      },
      style: { fill: t.elevatedBg, stroke: t.grid, lineWidth: 1.5 },
      silent: true,
    },
  ];
  contoursByLevel.forEach(({ segments }) => {
    segments.forEach((seg) => {
      const p1 = toPixel(seg.x1, seg.y1, FLOOR_Z);
      const p2 = toPixel(seg.x2, seg.y2, FLOOR_Z);
      floorElements.push({
        type: "line",
        shape: { x1: p1[0], y1: p1[1], x2: p2[0], y2: p2[1] },
        style: {
          stroke: t.inkSoft,
          lineWidth: 1.2,
          opacity: 0.55,
          lineDash: [4, 4],
        },
        silent: true,
      });
    });
  });
  return floorElements;
}

// --- Axis frame: ground (X, Y) + elevation (Z) edges, ticks + labels -------
// Camera-facing corner selection matches the elevation-24/azimuth-45 camera:
// X/Y ticks sit on the far-bottom corner (+RANGE, +RANGE) so they trail
// behind the terrain instead of crossing it; Z sits on (+RANGE, -RANGE),
// which the azimuth collapses to a single vertical screen line clear of
// the hills. Four generic drawing primitives (line/tick/label/title) feed a
// single `drawAxis` composer so the three axis frames below are declarative
// config objects rather than three repeated call sequences.
const AXIS_COLOR = t.inkSoft;
const TICK_LEN = RANGE * 0.07;

function axisLine(out, p1, p2) {
  const points = [p1, p2].map(([x, y, z]) => toPixel(x, y, z));
  out.push({
    type: "polyline",
    shape: { points },
    style: { stroke: AXIS_COLOR, lineWidth: 2, fill: "none" },
    silent: true,
  });
}
function tickLabel(out, pos, text, align) {
  const [px, py] = toPixel(...pos);
  out.push({
    type: "text",
    style: {
      text,
      x: px,
      y: py,
      fill: t.inkSoft,
      fontSize: 13,
      align: align || "center",
      verticalAlign: "middle",
    },
    silent: true,
  });
}
function axisTitle(out, pos, text, offset) {
  const [px, py] = toPixel(...pos);
  out.push({
    type: "text",
    style: {
      text,
      x: px + offset[0],
      y: py + offset[1],
      fill: t.ink,
      fontSize: 17,
      fontWeight: "bold",
      align: "center",
      verticalAlign: "middle",
    },
    silent: true,
  });
}
function drawAxis(out, cfg) {
  axisLine(out, cfg.line[0], cfg.line[1]);
  cfg.ticks.forEach((v) => {
    const { from, to } = cfg.tickPos(v);
    axisLine(out, from, to);
    tickLabel(out, cfg.labelPos(v), cfg.tickText(v), cfg.align);
  });
  axisTitle(out, cfg.titlePos, cfg.title, cfg.titleOffset);
}

const CORNER_X = RANGE;
const CORNER_Y = RANGE;
const groundZ = FLOOR_Z;
const Z_CORNER_X = RANGE;
const Z_CORNER_Y = -RANGE;
const axisTicksXY = [-5, -2.5, 0, 2.5, 5];
const zTicks = [zMin, zMid, zMax].map((v) => Math.round(v / 10) * 10);

function buildAxisElements() {
  const out = [];
  // Titles stay centered at v=0 (the axis midpoint) but sit at a larger
  // outward distance than the tick labels — a farther "row" rather than the
  // same point, which is what caused the title to collide with the "0" tick
  // label. (Anchoring titles past the last tick instead was tried and
  // rejected: at this camera's azimuth the two ground axes share a corner,
  // so both titles converged on nearly the same screen position beyond it.)
  drawAxis(out, {
    line: [
      [-RANGE, CORNER_Y, groundZ],
      [RANGE, CORNER_Y, groundZ],
    ],
    ticks: axisTicksXY,
    tickPos: (v) => ({
      from: [v, CORNER_Y, groundZ],
      to: [v, CORNER_Y + TICK_LEN, groundZ],
    }),
    labelPos: (v) => [v, CORNER_Y + TICK_LEN * 2.4, groundZ],
    tickText: (v) => String(v),
    title: "Easting (km)",
    titlePos: [0, CORNER_Y + TICK_LEN * 4.8, groundZ],
    titleOffset: [0, 0],
  });

  drawAxis(out, {
    line: [
      [CORNER_X, -RANGE, groundZ],
      [CORNER_X, RANGE, groundZ],
    ],
    ticks: axisTicksXY,
    tickPos: (v) => ({
      from: [CORNER_X, v, groundZ],
      to: [CORNER_X + TICK_LEN, v, groundZ],
    }),
    labelPos: (v) => [CORNER_X + TICK_LEN * 2.4, v, groundZ],
    tickText: (v) => String(v),
    title: "Northing (km)",
    titlePos: [CORNER_X + TICK_LEN * 4.8, 0, groundZ],
    titleOffset: [0, 0],
  });

  drawAxis(out, {
    line: [
      [Z_CORNER_X, Z_CORNER_Y, FLOOR_Z],
      [Z_CORNER_X, Z_CORNER_Y, zMax],
    ],
    ticks: zTicks,
    tickPos: (v) => ({
      from: [Z_CORNER_X, Z_CORNER_Y, v],
      to: [Z_CORNER_X, Z_CORNER_Y - TICK_LEN, v],
    }),
    labelPos: (v) => [Z_CORNER_X, Z_CORNER_Y - TICK_LEN * 2.4, v],
    tickText: (v) => String(Math.round(v)),
    align: "center",
    title: "Elevation (m)",
    titlePos: [Z_CORNER_X, Z_CORNER_Y, zMax],
    titleOffset: [0, -40],
  });

  return out;
}

// --- Init + option -----------------------------------------------------------
const chart = echarts.init(document.getElementById("container"));
chart.setOption({
  animation: false,
  backgroundColor: "transparent",
  title: {
    text: "Terrain Elevation · contour-3d · javascript · echarts · anyplot.ai",
    left: "center",
    top: 24,
    textStyle: { color: t.ink, fontSize: 22, fontWeight: 500 },
  },
  tooltip: {
    trigger: "item",
    formatter: (params) => {
      const item = drawItems[params.dataIndex];
      return item.kind === "quad"
        ? `Elevation: <b>${Math.round(item.value)} m</b>`
        : null;
    },
  },
  visualMap: {
    type: "piecewise",
    dimension: 0,
    seriesIndex: 0,
    pieces,
    orient: "vertical",
    right: 60,
    top: TOP_MARGIN + 20,
    itemWidth: 26,
    itemHeight: 26,
    itemGap: 8,
    textStyle: { color: t.inkSoft, fontSize: 13 },
  },
  graphic: { elements: [...buildFloorElements(), ...buildAxisElements()] },
  series: [
    {
      type: "custom",
      coordinateSystem: null,
      renderItem,
      data: drawItems.map((item) => ({ value: [item.value] })),
    },
  ],
});

// --- Drag-to-rotate: the spec asks interactive libraries to enable rotation
// of the 3D structure. echarts-gl (true grid3D) isn't installed, so this
// custom-canvas projection re-orbits the camera by hand: a drag updates
// AZIMUTH/ELEVATION, re-fits the projection, and re-projects every element.
// Inert for the static PNG capture (no pointer events fire in headless
// screenshotting), but live in the shipped interactive HTML page.
const zr = chart.getZr();
zr.setCursorStyle("grab");
let dragging = false;
let lastX = 0;
let lastY = 0;
const MIN_ELEVATION = (4 * Math.PI) / 180;
const MAX_ELEVATION = (80 * Math.PI) / 180;

function rerender() {
  updateTrig();
  fitProjection();
  chart.setOption({
    graphic: { elements: [...buildFloorElements(), ...buildAxisElements()] },
    series: [{ data: drawItems.map((item) => ({ value: [item.value] })) }],
  });
}

zr.on("mousedown", (e) => {
  dragging = true;
  lastX = e.offsetX;
  lastY = e.offsetY;
  zr.setCursorStyle("grabbing");
});
zr.on("mousemove", (e) => {
  if (!dragging) return;
  AZIMUTH += (e.offsetX - lastX) * 0.006;
  ELEVATION = Math.min(
    MAX_ELEVATION,
    Math.max(MIN_ELEVATION, ELEVATION - (e.offsetY - lastY) * 0.006),
  );
  lastX = e.offsetX;
  lastY = e.offsetY;
  rerender();
});
zr.on("mouseup", () => {
  dragging = false;
  zr.setCursorStyle("grab");
});
zr.on("globalout", () => {
  dragging = false;
  zr.setCursorStyle("grab");
});
Runnable source as JSON, for any HTTP client: https://api.anyplot.ai/specs/contour-3d/echarts/code. Any spec id and library id listed in llms-full.txt fit the same URL shape; every URL below is complete and callable.
{
  "spec_id": "contour-3d",
  "language": "javascript",
  "library": "echarts",
  "page": "https://anyplot.ai/contour-3d/javascript/echarts",
  "hub": "https://anyplot.ai/contour-3d",
  "code_json": "https://api.anyplot.ai/specs/contour-3d/echarts/code",
  "spec_json": "https://api.anyplot.ai/specs/contour-3d",
  "render_light_png": "https://storage.googleapis.com/anyplot-images/plots/contour-3d/javascript/echarts/plot-light.png",
  "render_dark_png": "https://storage.googleapis.com/anyplot-images/plots/contour-3d/javascript/echarts/plot-dark.png",
  "interactive_light_html": "https://storage.googleapis.com/anyplot-images/plots/contour-3d/javascript/echarts/plot-light.html",
  "interactive_dark_html": "https://storage.googleapis.com/anyplot-images/plots/contour-3d/javascript/echarts/plot-dark.html",
  "quality_score": 88.0,
  "license": "MIT",
  "guide": "https://anyplot.ai/llms.txt"
}
Part of 3D Contour Plot on anyplot.ai.