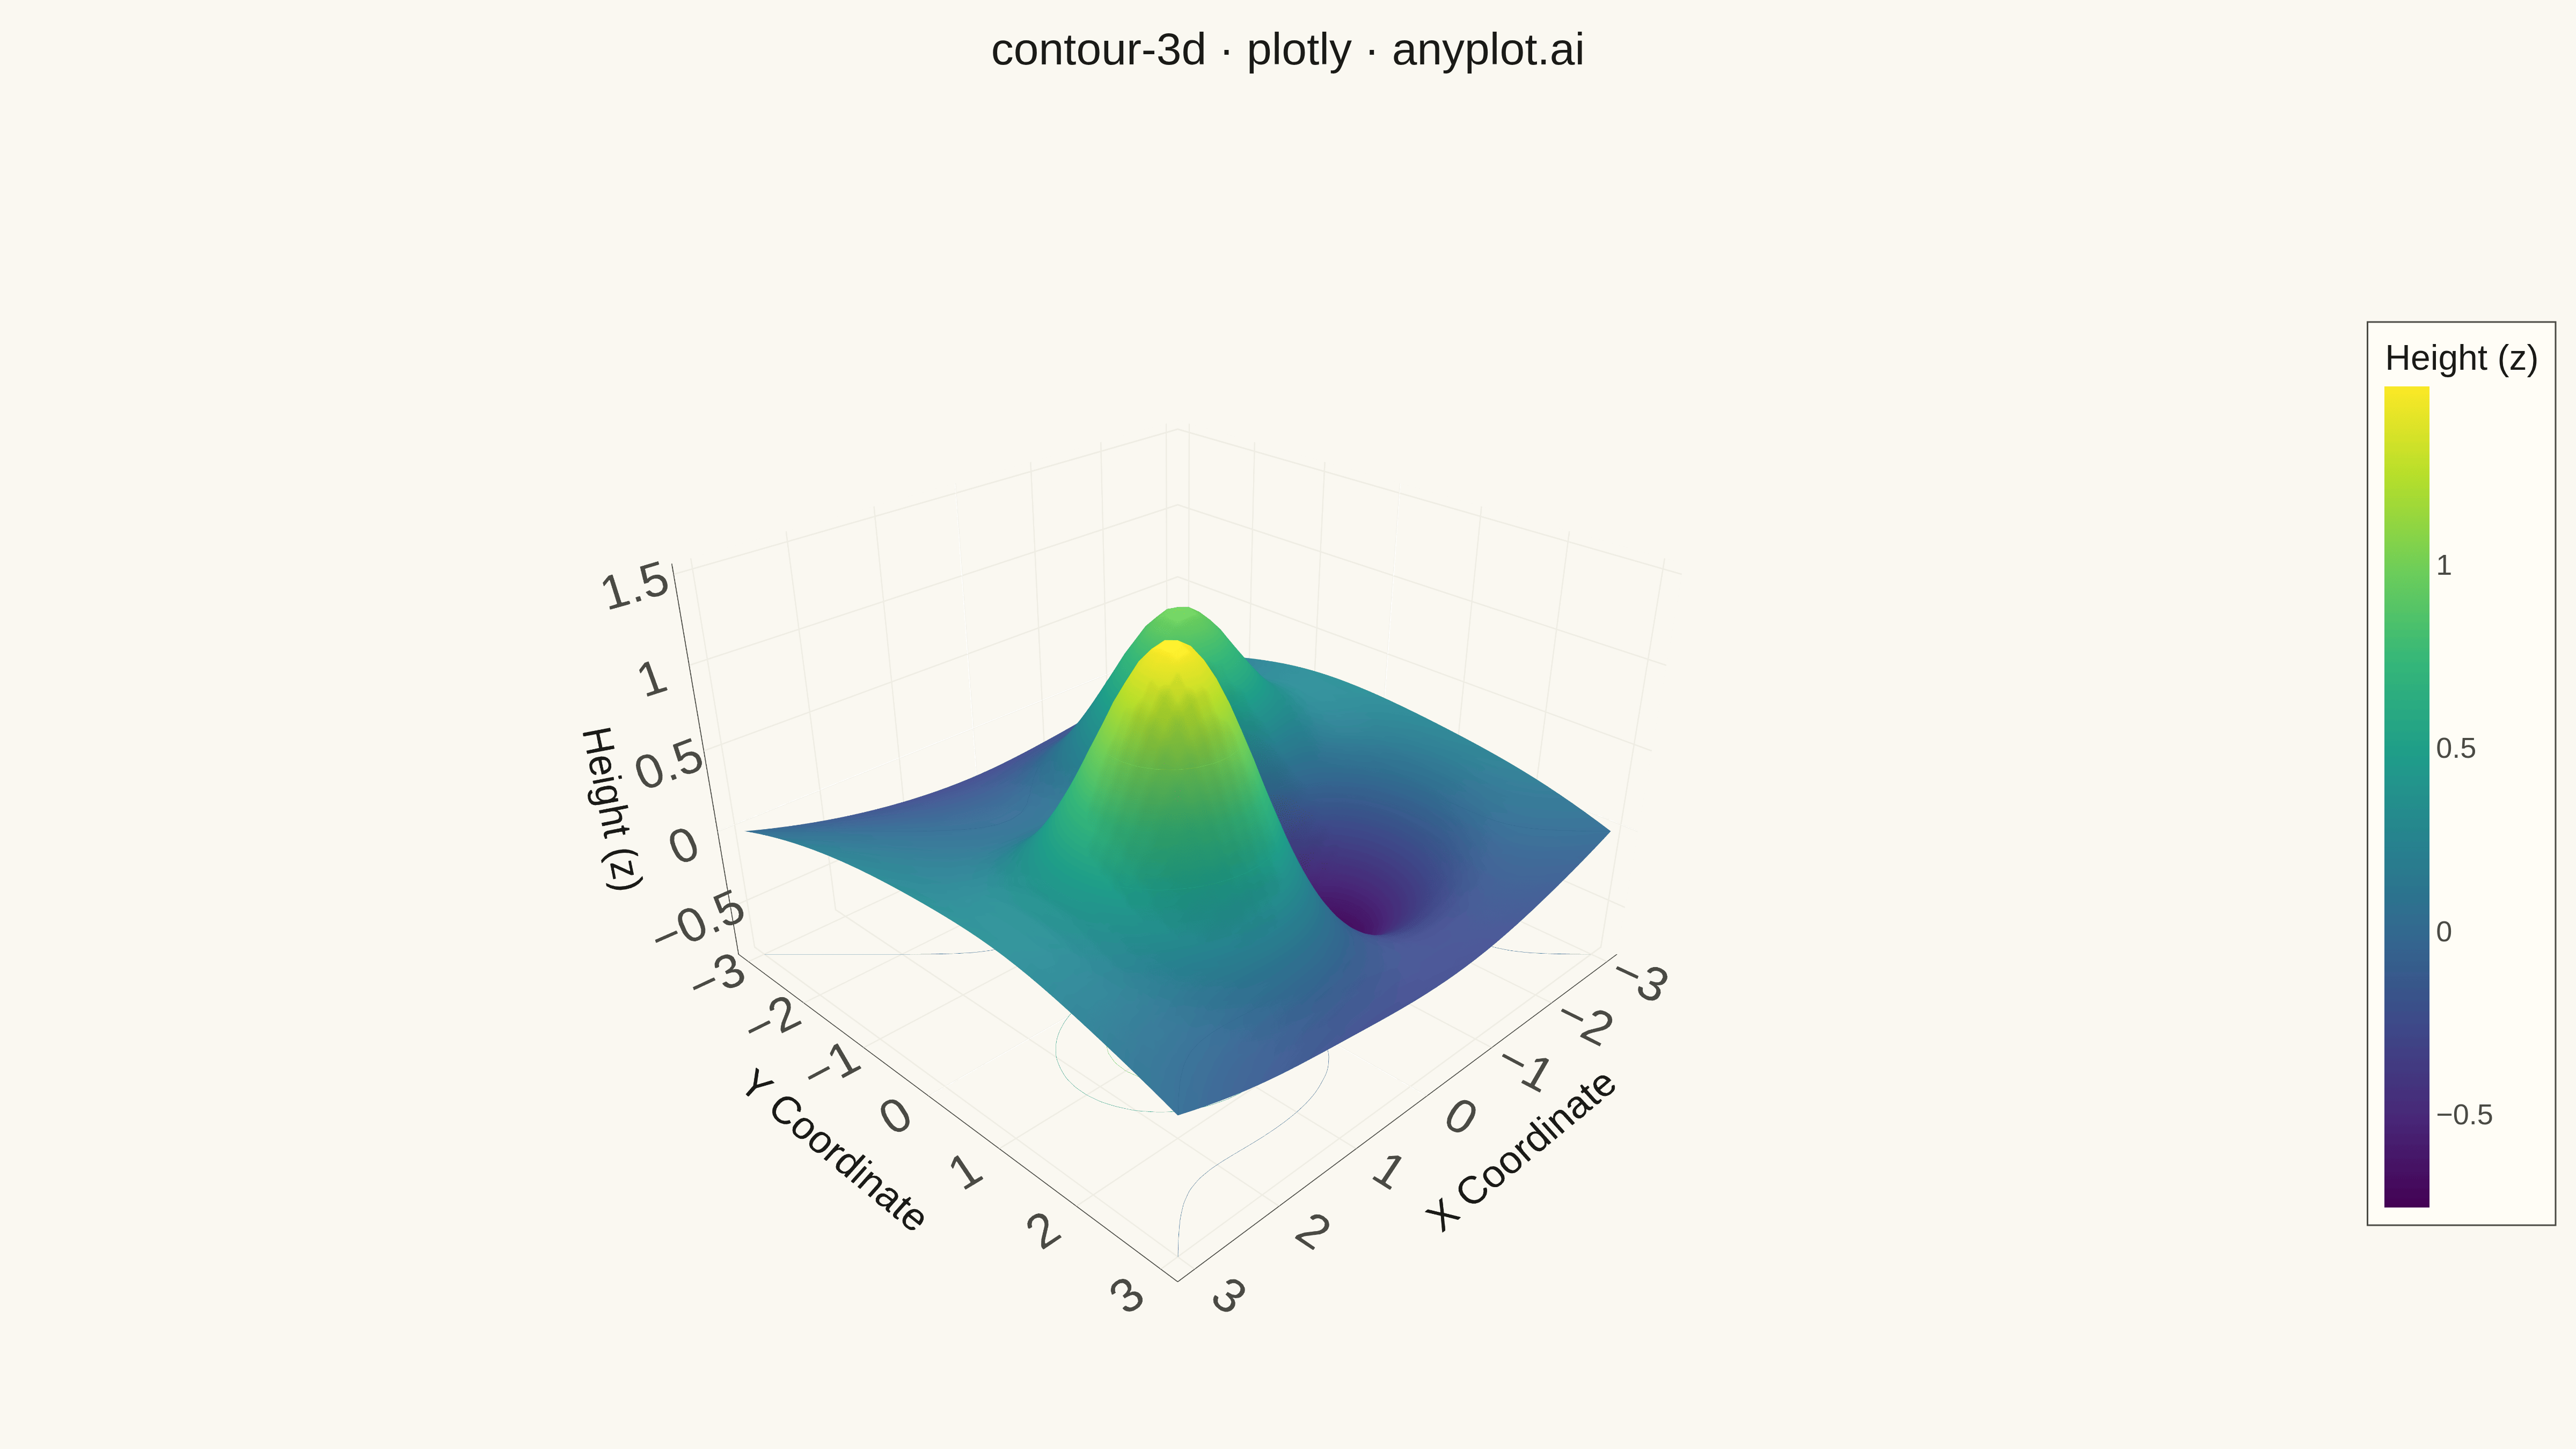
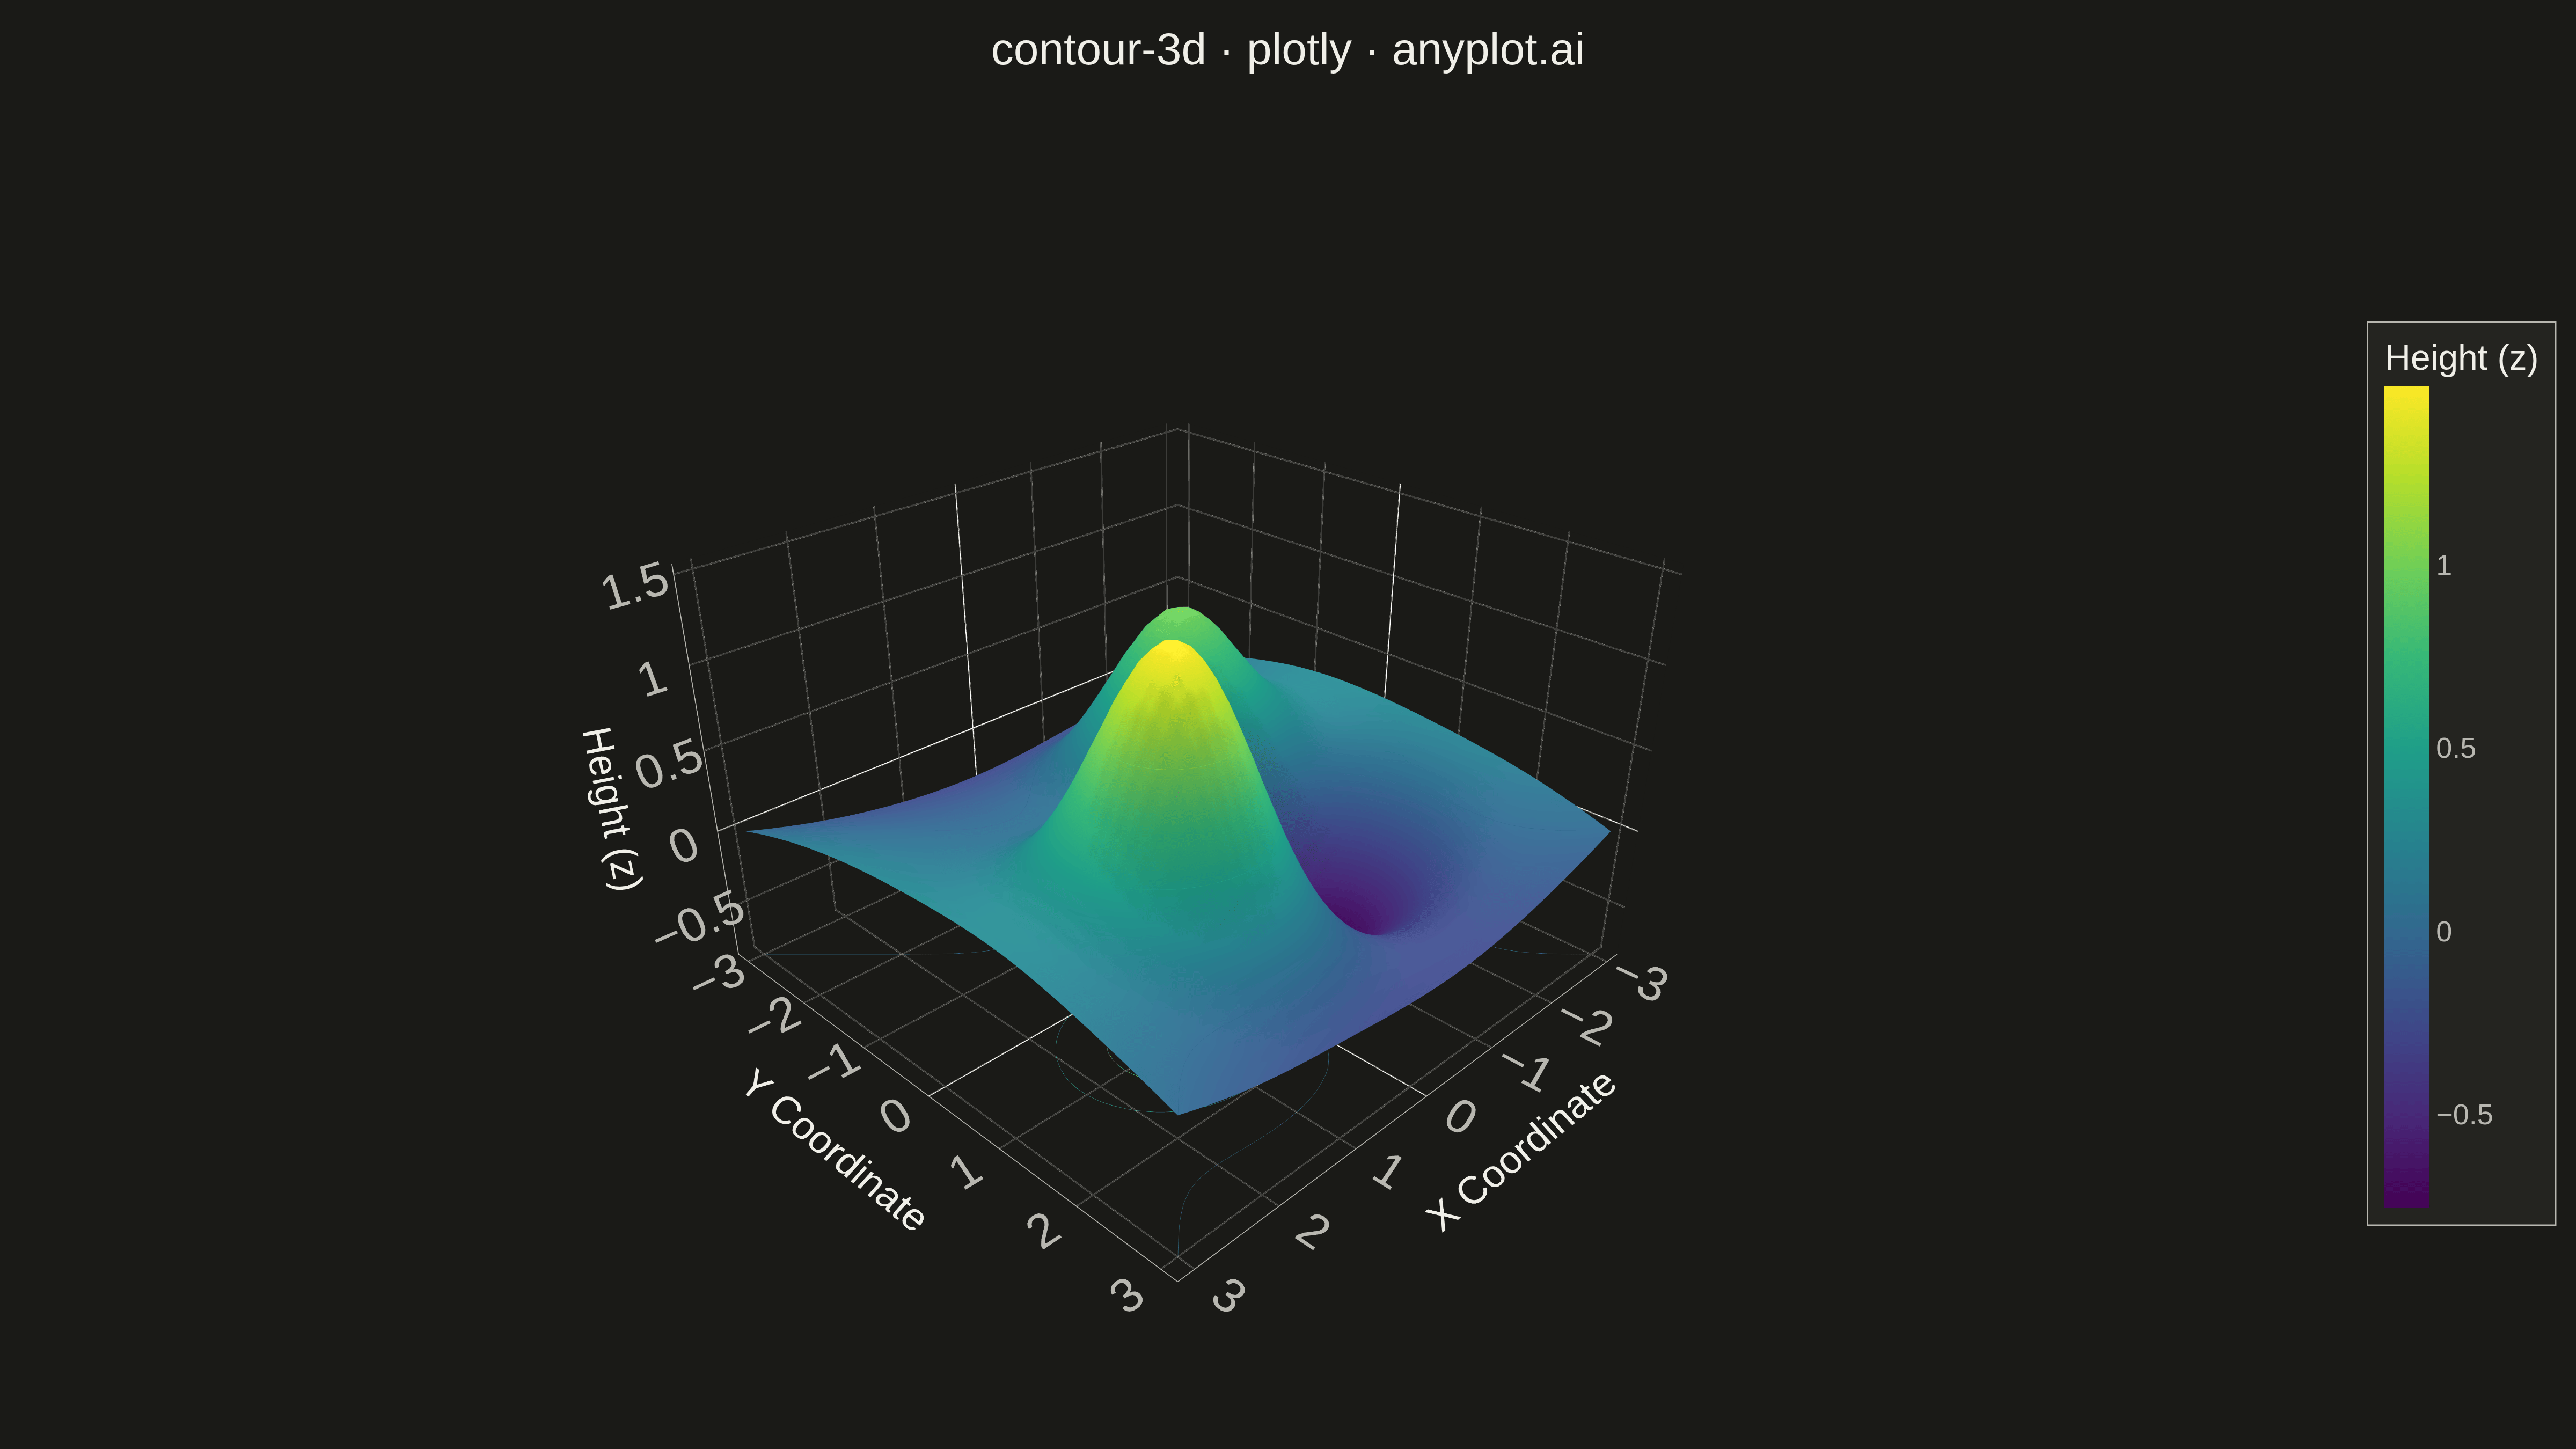
A 3D contour plot displays contour lines or filled contour bands on a three-dimensional surface, showing isolines of a function of two variables in 3D space. Unlike 2D contour plots that flatten the visualization, 3D contour plots preserve the surface geometry while highlighting level curves, making it easier to understand both the overall shape and specific value regions simultaneously. This visualization combines the spatial intuition of 3D surfaces with the precision of contour-based value identification.
""" anyplot.ai
contour-3d: 3D Contour Plot
Library: plotly 6.7.0 | Python 3.13.13
Quality: 93/100 | Updated: 2026-05-16
"""

import os
import sys


# Prevent self-import: remove this script's directory from sys.path so that
# 'import plotly' resolves to the installed package, not this file.
_here = os.path.dirname(os.path.abspath(__file__))
sys.path = [p for p in sys.path if p != "" and os.path.abspath(p or ".") != _here]

import numpy as np
import plotly.graph_objects as go


# Theme tokens
THEME = os.environ.get("ANYPLOT_THEME", "light")
PAGE_BG = "#FAF8F1" if THEME == "light" else "#1A1A17"
ELEVATED_BG = "#FFFDF6" if THEME == "light" else "#242420"
INK = "#1A1A17" if THEME == "light" else "#F0EFE8"
INK_SOFT = "#4A4A44" if THEME == "light" else "#B8B7B0"
GRID = "rgba(26,26,23,0.10)" if THEME == "light" else "rgba(240,239,232,0.10)"
GRID_DARK = "rgba(26,26,23,0.15)" if THEME == "light" else "rgba(240,239,232,0.15)"

# Data - create a mathematical surface with interesting contour features
n = 40  # Grid size for clear visualization

x = np.linspace(-3, 3, n)
y = np.linspace(-3, 3, n)
X, Y = np.meshgrid(x, y)

# Create a surface with peaks and valleys - good for showing contours
# Combination of Gaussian peaks and a saddle point
Z = (
    1.5 * np.exp(-((X - 1) ** 2 + (Y - 1) ** 2))  # Peak at (1, 1)
    + 1.0 * np.exp(-((X + 1) ** 2 + (Y + 1) ** 2))  # Peak at (-1, -1)
    - 0.8 * np.exp(-((X + 1) ** 2 + (Y - 1) ** 2))  # Valley at (-1, 1)
    + 0.3 * (X**2 - Y**2) * 0.1  # Subtle saddle point contribution
)

# Create figure with 3D contour surface
fig = go.Figure()

# Add the 3D surface with contour lines
fig.add_trace(
    go.Surface(
        x=X,
        y=Y,
        z=Z,
        colorscale="Viridis",
        showscale=True,
        contours={
            "z": {
                "show": True,
                "usecolormap": True,
                "highlightcolor": INK,
                "project_z": True,  # Project contours onto the base plane
                "width": 3,  # More prominent contour lines
            },
            "x": {"show": False},
            "y": {"show": False},
        },
        colorbar={
            "title": {"text": "Height (z)", "font": {"size": 22, "color": INK}},
            "tickfont": {"size": 18, "color": INK_SOFT},
            "len": 0.7,
            "thickness": 28,
            "x": 1.02,
            "tickcolor": INK_SOFT,
            "bordercolor": INK_SOFT,
            "borderwidth": 1,
            "bgcolor": ELEVATED_BG,
        },
        hovertemplate="<b>Surface Value</b><br>X: %{x:.2f}<br>Y: %{y:.2f}<br>Z: %{z:.3f}<extra></extra>",
    )
)

# Update layout for large canvas and clear visualization
fig.update_layout(
    title={
        "text": "contour-3d · plotly · anyplot.ai",
        "font": {"size": 28, "color": INK},
        "x": 0.5,
        "xanchor": "center",
    },
    scene={
        "xaxis": {
            "title": {"text": "X Coordinate", "font": {"size": 22, "color": INK}},
            "tickfont": {"size": 18, "color": INK_SOFT},
            "gridcolor": GRID_DARK,
            "showbackground": True,
            "backgroundcolor": PAGE_BG,
            "linecolor": INK_SOFT,
        },
        "yaxis": {
            "title": {"text": "Y Coordinate", "font": {"size": 22, "color": INK}},
            "tickfont": {"size": 18, "color": INK_SOFT},
            "gridcolor": GRID_DARK,
            "showbackground": True,
            "backgroundcolor": PAGE_BG,
            "linecolor": INK_SOFT,
        },
        "zaxis": {
            "title": {"text": "Height (z)", "font": {"size": 22, "color": INK}},
            "tickfont": {"size": 18, "color": INK_SOFT},
            "gridcolor": GRID_DARK,
            "showbackground": True,
            "backgroundcolor": PAGE_BG,
            "linecolor": INK_SOFT,
        },
        "camera": {"eye": {"x": 1.5, "y": 1.5, "z": 1.2}},  # Good viewing angle
        "aspectratio": {"x": 1, "y": 1, "z": 0.7},
    },
    paper_bgcolor=PAGE_BG,
    plot_bgcolor=PAGE_BG,
    margin={"l": 20, "r": 100, "t": 80, "b": 20},
    font={"color": INK},
)

# Save as PNG (4800 x 2700 px)
fig.write_image(f"plot-{THEME}.png", width=1600, height=900, scale=3)

# Save interactive HTML version
fig.write_html(f"plot-{THEME}.html", include_plotlyjs="cdn")
Runnable source as JSON, for any HTTP client: https://api.anyplot.ai/specs/contour-3d/plotly/code. Any spec id and library id listed in llms-full.txt fit the same URL shape; every URL below is complete and callable.
{
  "spec_id": "contour-3d",
  "language": "python",
  "library": "plotly",
  "page": "https://anyplot.ai/contour-3d/python/plotly",
  "hub": "https://anyplot.ai/contour-3d",
  "code_json": "https://api.anyplot.ai/specs/contour-3d/plotly/code",
  "spec_json": "https://api.anyplot.ai/specs/contour-3d",
  "render_light_png": "https://storage.googleapis.com/anyplot-images/plots/contour-3d/python/plotly/plot-light.png",
  "render_dark_png": "https://storage.googleapis.com/anyplot-images/plots/contour-3d/python/plotly/plot-dark.png",
  "interactive_light_html": "https://storage.googleapis.com/anyplot-images/plots/contour-3d/python/plotly/plot-light.html",
  "interactive_dark_html": "https://storage.googleapis.com/anyplot-images/plots/contour-3d/python/plotly/plot-dark.html",
  "quality_score": 93.0,
  "license": "MIT",
  "guide": "https://anyplot.ai/llms.txt"
}
Part of 3D Contour Plot on anyplot.ai.