The same plot in 13 other libraries — JavaScript: Chart.js, Apache ECharts, Highcharts, MUI X Charts; Python: Altair, Bokeh, lets-plot, Matplotlib, Plotly, Pygal, Seaborn; R: ggplot2; Julia: Makie.jl. Compare all 14 side by side: 3D Contour Plot in Python, R, Julia and JavaScript.
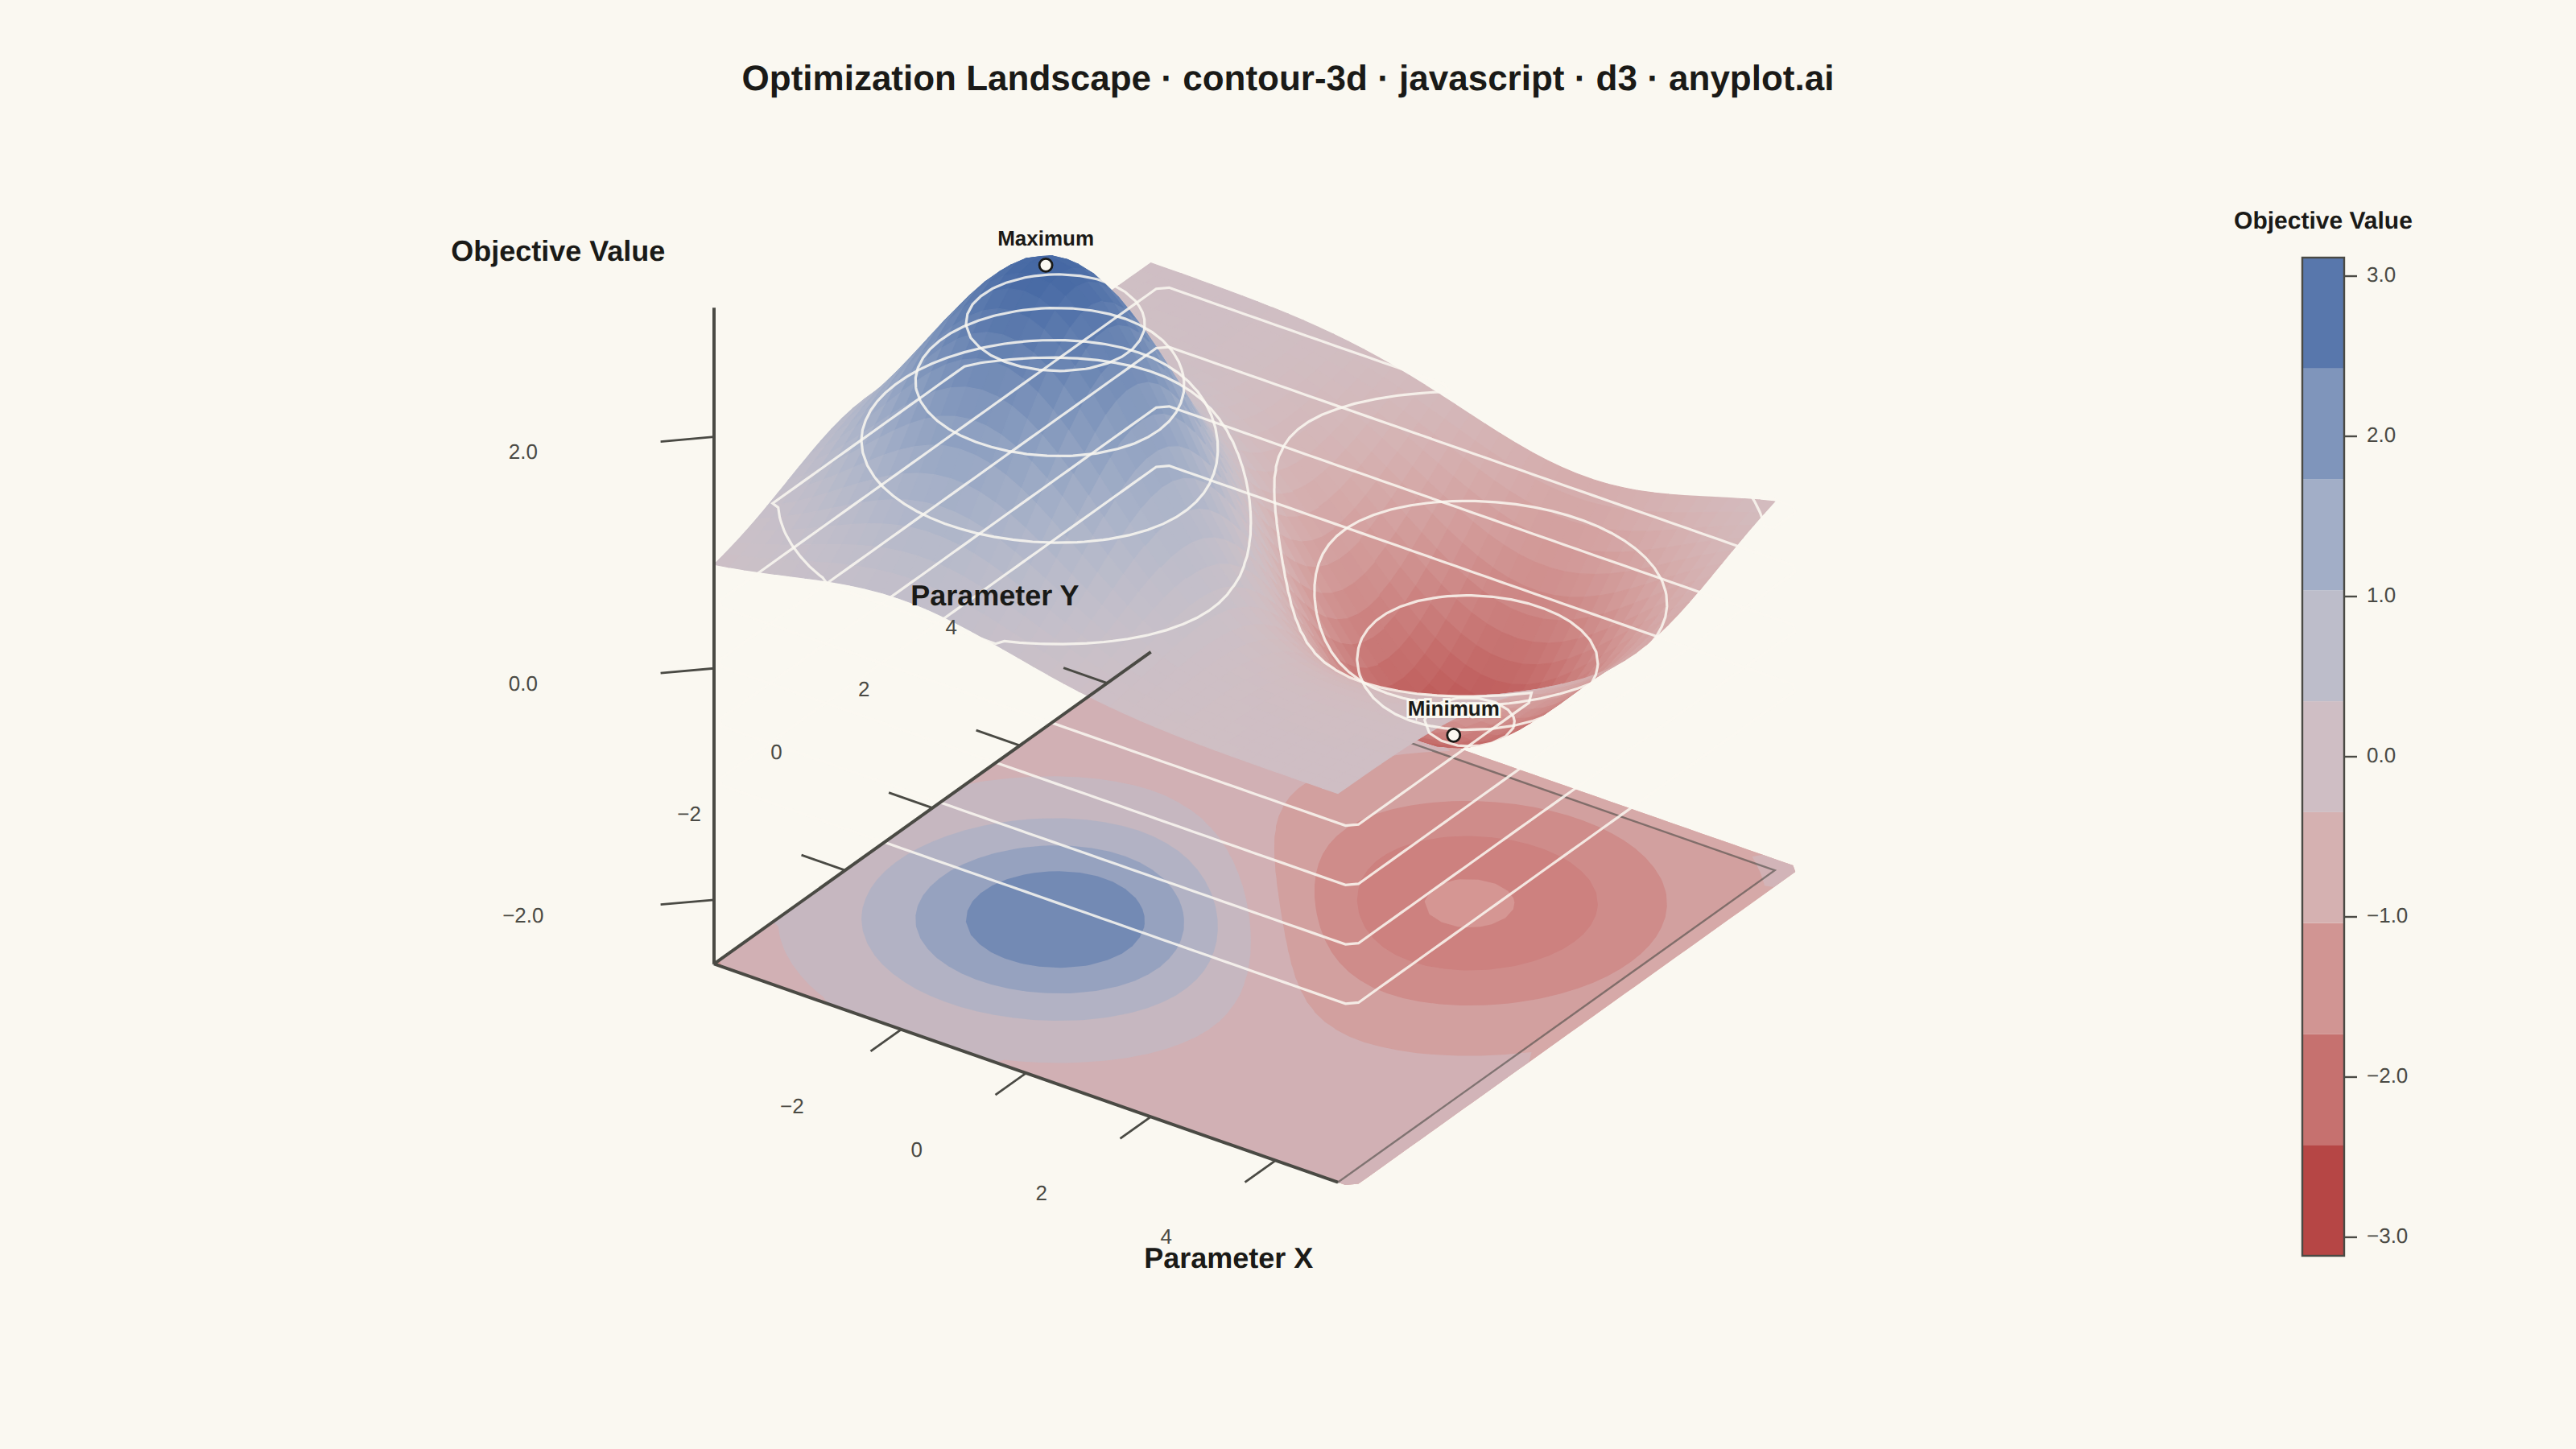
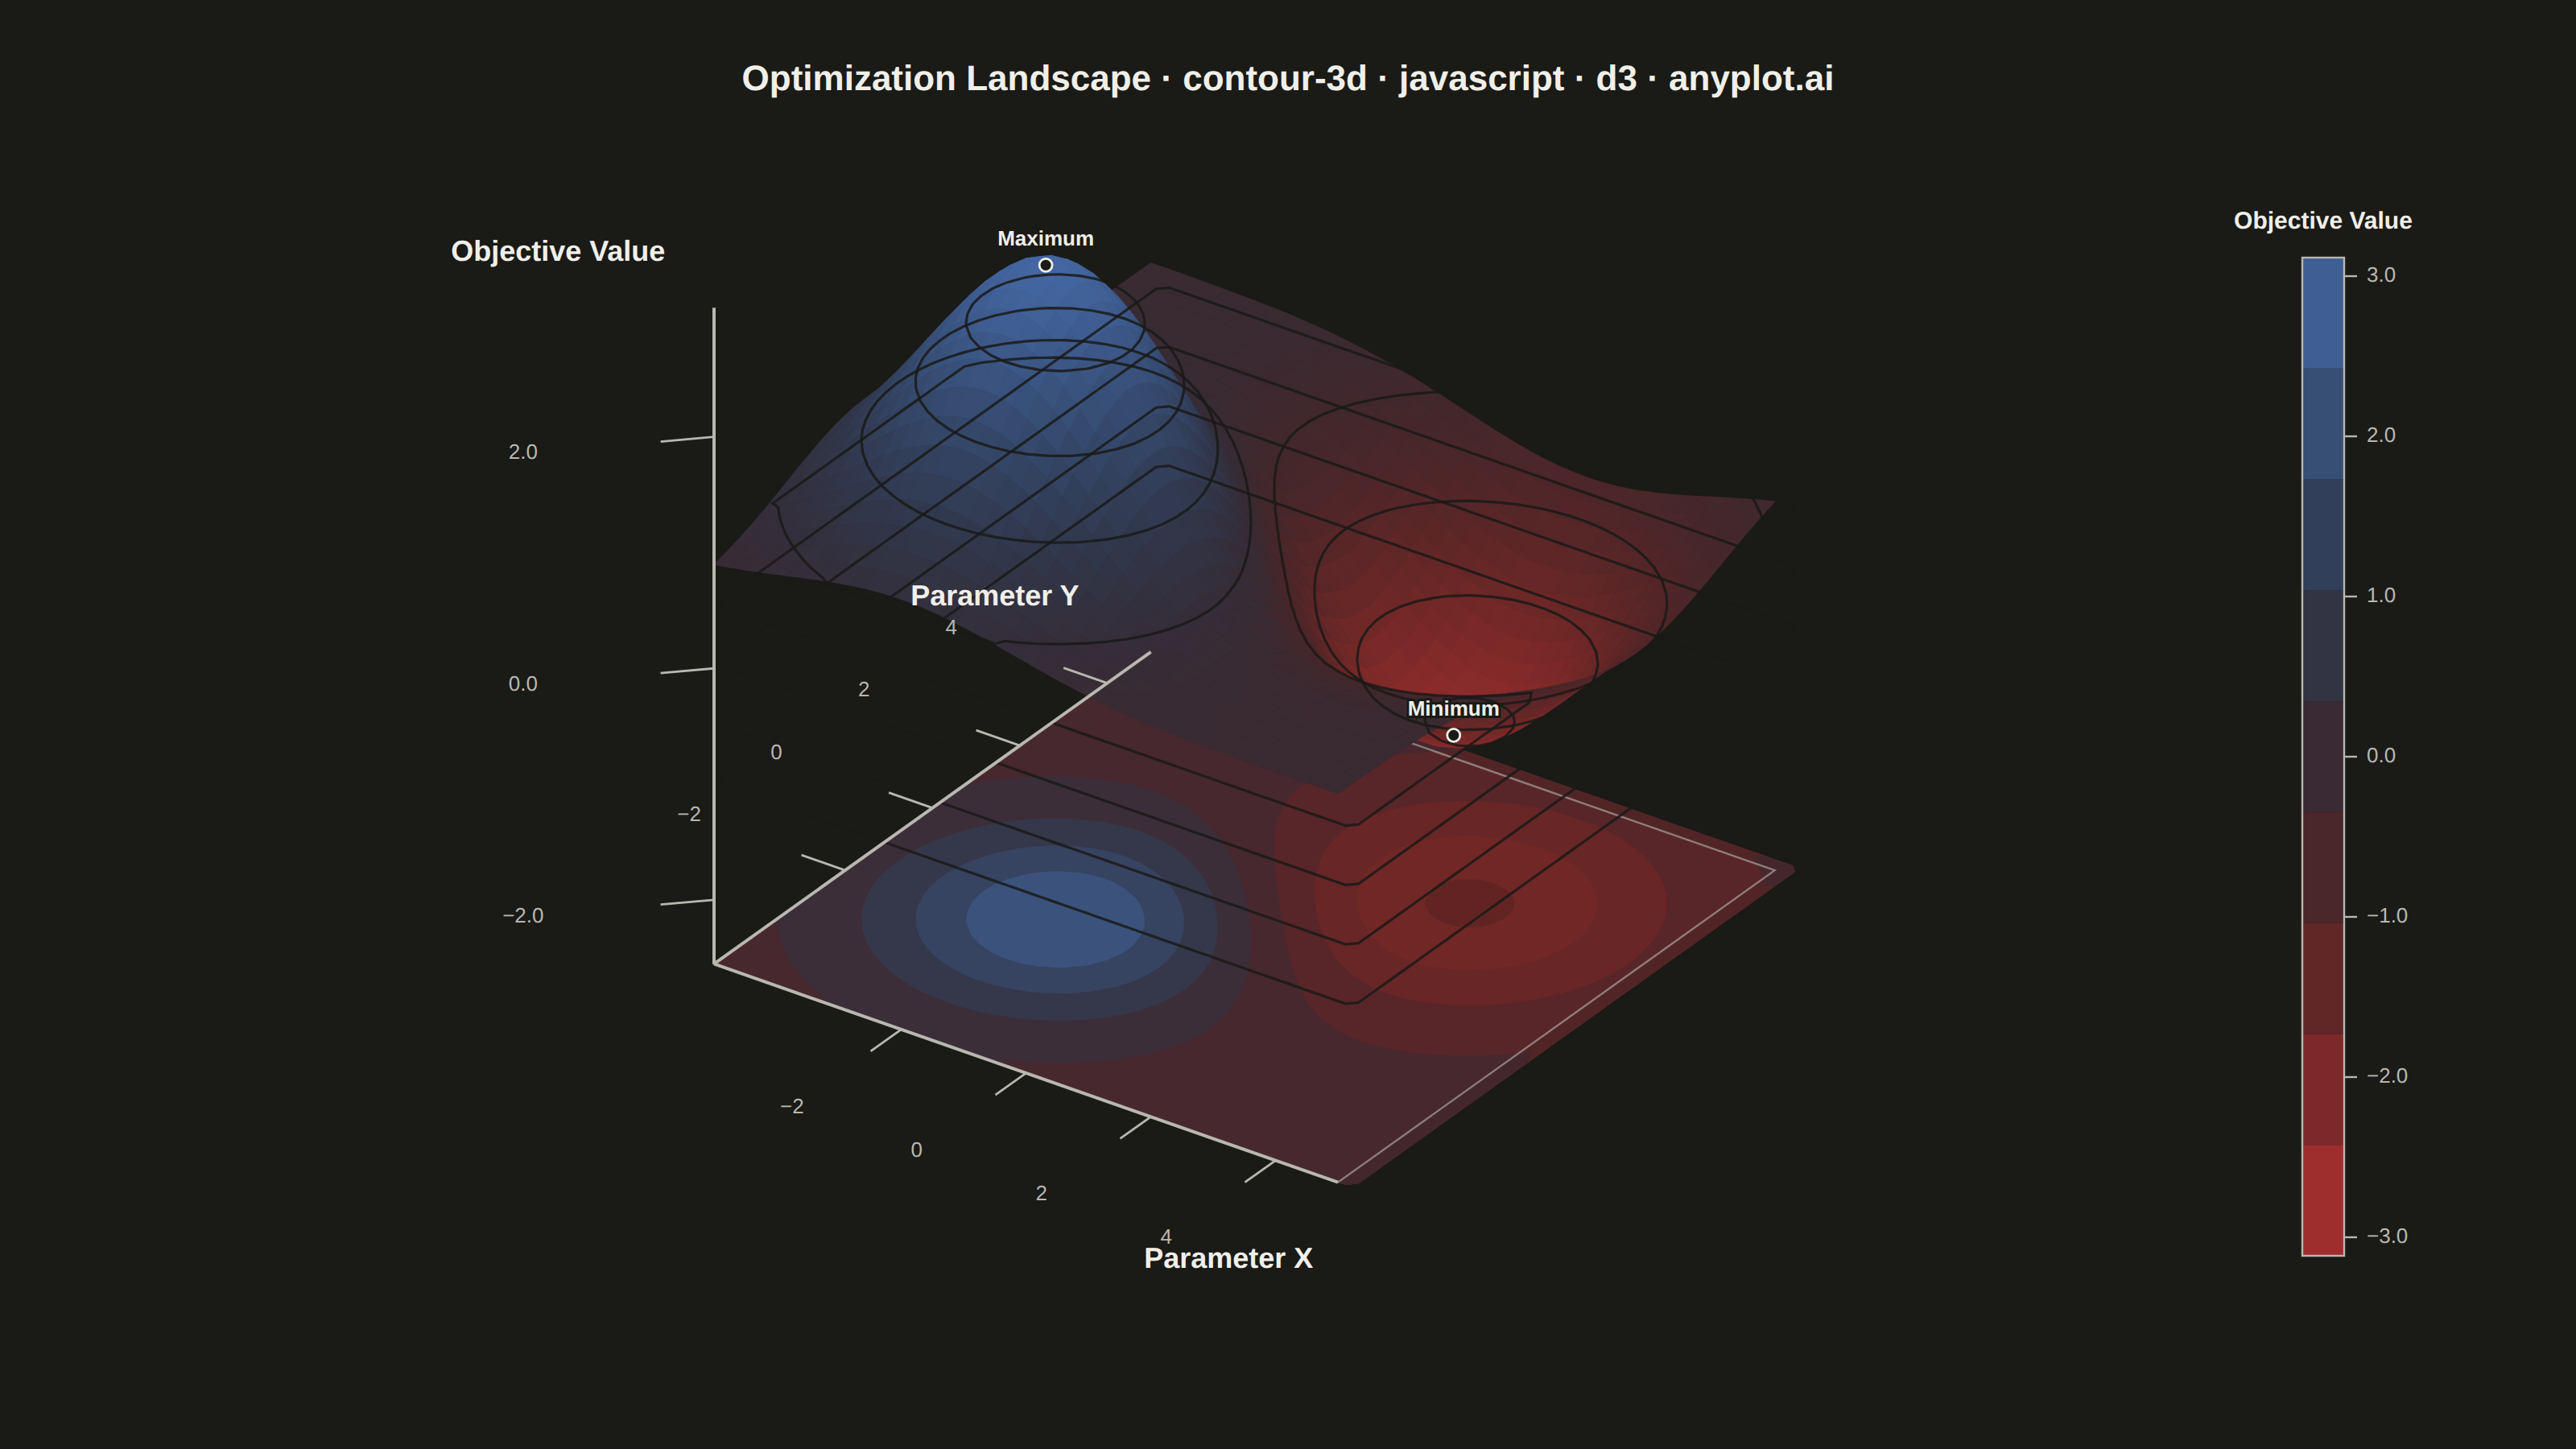
A 3D contour plot displays contour lines or filled contour bands on a three-dimensional surface, showing isolines of a function of two variables in 3D space. Unlike 2D contour plots that flatten the visualization, 3D contour plots preserve the surface geometry while highlighting level curves, making it easier to understand both the overall shape and specific value regions simultaneously. This visualization combines the spatial intuition of 3D surfaces with the precision of contour-based value identification.
// anyplot.ai
// contour-3d: 3D Contour Plot
// Library: d3 7.9.0 | JavaScript 22.23.2
// Quality: 92/100 | Created: 2026-09-10

const t = window.ANYPLOT_TOKENS;
const { width, height } = window.ANYPLOT_SIZE;
const margin = { top: 130, right: 260, bottom: 90, left: 100 };
const iw = width - margin.left - margin.right;
const ih = height - margin.top - margin.bottom;

// --- Data: optimization-landscape potential field (two Gaussian extrema) ---
// z(x,y) is a signed "objective value" surface with one maximum and one
// minimum — the classic critical-point landscape from the spec's
// optimization-landscape application.
const GRID_N = 42;
const AXIS_RANGE = 5;
const Z_EXAGGERATION = 1.3;

const xs = d3.range(GRID_N).map((i) => -AXIS_RANGE + (2 * AXIS_RANGE * i) / (GRID_N - 1));
const ys = d3.range(GRID_N).map((i) => -AXIS_RANGE + (2 * AXIS_RANGE * i) / (GRID_N - 1));

const gaussian = (x, y, cx, cy, sigma) => Math.exp(-((x - cx) ** 2 + (y - cy) ** 2) / (2 * sigma * sigma));
const objective = (x, y) => 3.2 * gaussian(x, y, -2, -1.5, 1.8) - 2.6 * gaussian(x, y, 2, 1.8, 2.0);

const zGrid = ys.map((y) => xs.map((x) => objective(x, y)));
const zFlat = zGrid.flat();
const zRawMin = d3.min(zFlat);
const zRawMax = d3.max(zFlat);
const zAbsMax = Math.max(Math.abs(zRawMin), Math.abs(zRawMax));

// The two critical points of the landscape (found directly on the grid) —
// labeled on the surface to sharpen the data story beyond color alone.
let maxI = 0,
  maxJ = 0,
  maxVal = -Infinity;
let minI = 0,
  minJ = 0,
  minVal = Infinity;
for (let j = 0; j < GRID_N; j++) {
  for (let i = 0; i < GRID_N; i++) {
    const v = zGrid[j][i];
    if (v > maxVal) {
      maxVal = v;
      maxI = i;
      maxJ = j;
    }
    if (v < minVal) {
      minVal = v;
      minI = i;
      minJ = j;
    }
  }
}
const extrema = [
  { x: xs[maxI], y: ys[maxJ], z: maxVal, label: "Maximum" },
  { x: xs[minI], y: ys[minJ], z: minVal, label: "Minimum" },
];

// --- Contour bands + isolines via marching squares on the raw grid ---------
const N_BANDS = 9;
const levels = d3.range(1, N_BANDS).map((k) => -zAbsMax + (k * 2 * zAbsMax) / N_BANDS);
const boundaries = [-zAbsMax, ...levels, zAbsMax];
const divScale = d3.scaleSequential(d3.interpolateRgbBasis(t.div)).domain([-zAbsMax, zAbsMax]);
const bandColors = d3.range(N_BANDS).map((k) => divScale((boundaries[k] + boundaries[k + 1]) / 2));

const contourGen = d3.contours().size([GRID_N, GRID_N]).thresholds(levels);
const bands = contourGen(zFlat); // ascending features; bands[k].value === levels[k]

const gridToX = (i) => xs[0] + (i / (GRID_N - 1)) * (xs[GRID_N - 1] - xs[0]);
const gridToY = (j) => ys[0] + (j / (GRID_N - 1)) * (ys[GRID_N - 1] - ys[0]);

// --- Camera: elevation/azimuth orthographic projection (drag-to-orbit) -----
const INITIAL_ELEVATION = 30;
const INITIAL_AZIMUTH = -55;

const cross = (a, b) => [a[1] * b[2] - a[2] * b[1], a[2] * b[0] - a[0] * b[2], a[0] * b[1] - a[1] * b[0]];
const normalize = (v) => {
  const len = Math.hypot(v[0], v[1], v[2]);
  return [v[0] / len, v[1] / len, v[2] / len];
};
const dot = (a, b) => a[0] * b[0] + a[1] * b[1] + a[2] * b[2];

// --- Surface geometry: true grid height, banded fill by contour level -------
const zMinScaled = zRawMin * Z_EXAGGERATION;
const zMaxScaled = zRawMax * Z_EXAGGERATION;
const floorZ = zMinScaled - 0.35 * (zMaxScaled - zMinScaled);
const zToHeight = (v) => floorZ + ((v - zRawMin) / (zRawMax - zRawMin)) * (zMaxScaled - floorZ);

// --- Floor corners (data-space, camera-independent) -------------------------
const xMin = xs[0];
const xMax = xs[GRID_N - 1];
const yMin = ys[0];
const yMax = ys[GRID_N - 1];
const floorCorners = [
  [xMin, yMin, floorZ],
  [xMax, yMin, floorZ],
  [xMax, yMax, floorZ],
  [xMin, yMax, floorZ],
];

const TICK_LEN = 0.7;
const LABEL_LEN = 2.5;
const Z_TICK_LEN = TICK_LEN * 0.72;
const Z_LABEL_LEN = LABEL_LEN * 0.72;
const CORNER_GUARD = 0.15;

// --- SVG mount ----------------------------------------------------------------
const svg = d3.select("#container").append("svg").attr("width", width).attr("height", height);
const sceneGroup = svg.append("g"); // rebuilt on every camera change (drag-to-orbit)

// Recomputes the camera basis, re-projects every surface/floor/axis element,
// and redraws the scene — invoked once on load and again on every pointer
// drag so the spec's "enable rotation for interactive libraries" note is a
// genuine interaction, not a fixed static render.
function render(elevation, azimuth) {
  const elRad = (elevation * Math.PI) / 180;
  const azRad = (azimuth * Math.PI) / 180;
  const camDir = [Math.cos(elRad) * Math.cos(azRad), Math.cos(elRad) * Math.sin(azRad), Math.sin(elRad)];
  const worldUp = [0, 0, 1];
  const right = normalize(cross(worldUp, camDir));
  const up = normalize(cross(camDir, right));
  const project = (x, y, z) => [dot([x, y, z], right), dot([x, y, z], up)];
  const depthOf = (x, y, z) => dot([x, y, z], camDir);

  const surfacePoints = ys.map((yy, j) =>
    xs.map((xx, i) => {
      const zd = zGrid[j][i] * Z_EXAGGERATION;
      const [vx, vy] = project(xx, yy, zd);
      return { vx, vy, depth: depthOf(xx, yy, zd), zRaw: zGrid[j][i] };
    })
  );

  const quads = [];
  for (let j = 0; j < GRID_N - 1; j++) {
    for (let i = 0; i < GRID_N - 1; i++) {
      const p00 = surfacePoints[j][i];
      const p10 = surfacePoints[j][i + 1];
      const p11 = surfacePoints[j + 1][i + 1];
      const p01 = surfacePoints[j + 1][i];
      const avgZ = (p00.zRaw + p10.zRaw + p11.zRaw + p01.zRaw) / 4;
      const avgDepth = (p00.depth + p10.depth + p11.depth + p01.depth) / 4;
      quads.push({
        pts: [
          [p00.vx, p00.vy],
          [p10.vx, p10.vy],
          [p11.vx, p11.vy],
          [p01.vx, p01.vy],
        ],
        // Continuous shading on the true surface geometry — the discrete
        // banding lives on the floor projection below, so the two never
        // fight each other at the grid's finite resolution.
        color: divScale(avgZ),
        depth: avgDepth,
      });
    }
  }
  quads.sort((a, b) => a.depth - b.depth); // far to near — later draws sit on top

  // Isolines draped directly on the surface at each level's true height —
  // the precise level curves the spec calls for, distinct from the base map below.
  const surfaceIsolines = [];
  for (const feature of bands) {
    const levelZ = feature.value * Z_EXAGGERATION;
    for (const polygon of feature.coordinates) {
      for (const ring of polygon) {
        const pts = ring.map(([gi, gj]) => project(gridToX(gi), gridToY(gj), levelZ));
        const depth = d3.mean(ring, ([gi, gj]) => depthOf(gridToX(gi), gridToY(gj), levelZ));
        surfaceIsolines.push({ pts, depth });
      }
    }
  }
  surfaceIsolines.sort((a, b) => a.depth - b.depth);

  // Floor: the same contour bands flattened onto the base plane, a classic
  // topographic reference map beneath the 3D surface (per spec notes).
  const floorLayers = [{ rings: [floorCorners.map((p) => project(...p))], color: bandColors[0] }];
  bands.forEach((feature, idx) => {
    const color = bandColors[idx + 1];
    for (const polygon of feature.coordinates) {
      const rings = polygon.map((ring) => ring.map(([gi, gj]) => project(gridToX(gi), gridToY(gj), floorZ)));
      floorLayers.push({ rings, color });
    }
  });

  const extremaPts = extrema.map((e) => {
    const zd = e.z * Z_EXAGGERATION;
    const [vx, vy] = project(e.x, e.y, zd);
    return { ...e, vx, vy };
  });

  // --- Axis frame (floor corner behind the mesh, relative to the camera) ---
  let anchorX = xMin;
  let anchorY = yMin;
  let bestVx = Infinity;
  for (const cx of [xMin, xMax]) {
    for (const cy of [yMin, yMax]) {
      const [vx] = project(cx, cy, floorZ);
      if (vx < bestVx) {
        bestVx = vx;
        anchorX = cx;
        anchorY = cy;
      }
    }
  }
  const xAxisOtherEnd = anchorX === xMin ? xMax : xMin;
  const yAxisOtherEnd = anchorY === yMin ? yMax : yMin;
  const outwardXSign = anchorX > xAxisOtherEnd ? 1 : -1;
  const outwardYSign = anchorY > yAxisOtherEnd ? 1 : -1;

  const axisLines = [
    [
      [anchorX, anchorY, floorZ],
      [xAxisOtherEnd, anchorY, floorZ],
    ],
    [
      [anchorX, anchorY, floorZ],
      [anchorX, yAxisOtherEnd, floorZ],
    ],
    [
      [anchorX, anchorY, floorZ],
      [anchorX, anchorY, zMaxScaled],
    ],
  ];

  const xTicks = d3
    .ticks(xMin, xMax, 4)
    .filter((v) => Math.abs(v - anchorX) > CORNER_GUARD * (xMax - xMin))
    .map((v) => ({
      a: [v, anchorY, floorZ],
      b: [v, anchorY + outwardYSign * TICK_LEN, floorZ],
      label: [v, anchorY + outwardYSign * LABEL_LEN, floorZ],
      text: d3.format(".0f")(v),
    }));
  const yTicks = d3
    .ticks(yMin, yMax, 4)
    .filter((v) => Math.abs(v - anchorY) > CORNER_GUARD * (yMax - yMin))
    .map((v) => ({
      a: [anchorX, v, floorZ],
      b: [anchorX + outwardXSign * TICK_LEN, v, floorZ],
      label: [anchorX + outwardXSign * LABEL_LEN, v, floorZ],
      text: d3.format(".0f")(v),
    }));
  const zTicks = d3.ticks(zRawMin, zRawMax, 4).map((v) => ({
    a: [anchorX, anchorY, zToHeight(v)],
    b: [anchorX + outwardXSign * Z_TICK_LEN, anchorY + outwardYSign * Z_TICK_LEN, zToHeight(v)],
    label: [anchorX + outwardXSign * Z_LABEL_LEN, anchorY + outwardYSign * Z_LABEL_LEN, zToHeight(v)],
    text: d3.format(".1f")(v),
  }));
  const allTicks = [...xTicks, ...yTicks, ...zTicks];

  const axisLabels = [
    { pos: [xAxisOtherEnd, anchorY + outwardYSign * 2.5, floorZ], text: "Parameter X" },
    { pos: [anchorX + outwardXSign * 2.5, yAxisOtherEnd, floorZ], text: "Parameter Y" },
    { pos: [anchorX + outwardXSign * 2.5, anchorY, zMaxScaled], text: "Objective Value" },
  ];

  // --- Fit view-space extent (surface + floor + axis frame) into the mount -
  const extentSource = [
    ...quads.flatMap((q) => q.pts),
    ...floorLayers.flatMap((f) => f.rings.flat()),
    ...axisLines.flatMap(([a, b]) => [project(...a), project(...b)]),
    ...allTicks.flatMap((tk) => [project(...tk.a), project(...tk.label)]),
    ...axisLabels.map((l) => project(...l.pos)),
    ...extremaPts.map((e) => [e.vx, e.vy]),
  ];
  const extMinX = d3.min(extentSource, (d) => d[0]);
  const extMaxX = d3.max(extentSource, (d) => d[0]);
  const extMinY = d3.min(extentSource, (d) => d[1]);
  const extMaxY = d3.max(extentSource, (d) => d[1]);
  const midX = (extMinX + extMaxX) / 2;
  const midY = (extMinY + extMaxY) / 2;
  const fitScale = 0.92 * Math.min(iw / (extMaxX - extMinX), ih / (extMaxY - extMinY));
  const toScreen = ([vx, vy]) => [
    margin.left + iw / 2 + (vx - midX) * fitScale,
    margin.top + ih / 2 - (vy - midY) * fitScale,
  ];
  const ringPath = (ring) =>
    ring
      .map(toScreen)
      .map((p, k) => `${k === 0 ? "M" : "L"}${p[0].toFixed(2)},${p[1].toFixed(2)}`)
      .join(" ") + " Z";
  const polygonPath = (rings) => rings.map(ringPath).join(" ");

  // --- Redraw the camera-dependent scene -------------------------------------
  sceneGroup.selectAll("*").remove();

  sceneGroup
    .append("g")
    .attr("fill-rule", "evenodd")
    .attr("stroke", "none")
    .selectAll("path")
    .data(floorLayers)
    .join("path")
    .attr("d", (d) => polygonPath(d.rings))
    .attr("fill", (d) => d.color)
    .attr("fill-opacity", 0.55);

  sceneGroup
    .append("path")
    .attr("d", ringPath(floorCorners.map((p) => project(...p))))
    .attr("fill", "none")
    .attr("stroke", t.inkSoft)
    .attr("stroke-width", 1.2)
    .attr("stroke-opacity", 0.6);

  const surfaceGroup = sceneGroup.append("g").attr("stroke-width", 0.6);
  surfaceGroup
    .selectAll("path")
    .data(quads)
    .join("path")
    .attr("d", (d) => ringPath(d.pts))
    .attr("fill", (d) => d.color)
    .attr("stroke", (d) => d.color);

  sceneGroup
    .append("g")
    .attr("fill", "none")
    .attr("stroke", t.pageBg)
    .attr("stroke-width", 1.6)
    .attr("stroke-opacity", 0.85)
    .selectAll("path")
    .data(surfaceIsolines)
    .join("path")
    .attr("d", (d) => ringPath(d.pts));

  // Direct "Maximum"/"Minimum" markers at the two critical points sharpen the
  // focal point beyond color/contour encoding alone.
  const extremaGroup = sceneGroup.append("g");
  extremaGroup
    .selectAll("circle")
    .data(extremaPts)
    .join("circle")
    .attr("cx", (d) => toScreen([d.vx, d.vy])[0])
    .attr("cy", (d) => toScreen([d.vx, d.vy])[1])
    .attr("r", 4)
    .attr("fill", t.pageBg)
    .attr("stroke", t.ink)
    .attr("stroke-width", 1.4);
  extremaGroup
    .selectAll("text")
    .data(extremaPts)
    .join("text")
    .attr("x", (d) => toScreen([d.vx, d.vy])[0])
    .attr("y", (d) => toScreen([d.vx, d.vy])[1] - 12)
    .attr("text-anchor", "middle")
    .attr("fill", t.ink)
    .attr("stroke", t.pageBg)
    .attr("stroke-width", 3)
    .attr("paint-order", "stroke")
    .style("font-size", "13px")
    .style("font-weight", "600")
    .text((d) => d.label);

  const axisGroup = sceneGroup.append("g").attr("stroke", t.inkSoft).attr("stroke-width", 2);
  axisGroup
    .selectAll("line")
    .data(axisLines)
    .join("line")
    .attr("x1", (d) => toScreen(project(...d[0]))[0])
    .attr("y1", (d) => toScreen(project(...d[0]))[1])
    .attr("x2", (d) => toScreen(project(...d[1]))[0])
    .attr("y2", (d) => toScreen(project(...d[1]))[1]);

  sceneGroup
    .append("g")
    .attr("stroke", t.inkSoft)
    .attr("stroke-width", 1.4)
    .selectAll("line")
    .data(allTicks)
    .join("line")
    .attr("x1", (d) => toScreen(project(...d.a))[0])
    .attr("y1", (d) => toScreen(project(...d.a))[1])
    .attr("x2", (d) => toScreen(project(...d.b))[0])
    .attr("y2", (d) => toScreen(project(...d.b))[1]);

  sceneGroup
    .append("g")
    .attr("fill", t.inkSoft)
    .style("font-size", "13px")
    .selectAll("text")
    .data(allTicks)
    .join("text")
    .attr("x", (d) => toScreen(project(...d.label))[0])
    .attr("y", (d) => toScreen(project(...d.label))[1])
    .attr("text-anchor", "middle")
    .attr("dominant-baseline", "middle")
    .text((d) => d.text);

  sceneGroup
    .append("g")
    .attr("fill", t.ink)
    .style("font-size", "18px")
    .style("font-weight", "600")
    .selectAll("text")
    .data(axisLabels)
    .join("text")
    .attr("x", (d) => toScreen(project(...d.pos))[0])
    .attr("y", (d) => toScreen(project(...d.pos))[1])
    .attr("text-anchor", "middle")
    .attr("dominant-baseline", "middle")
    .text((d) => d.text);
}

// --- Interaction: drag-to-orbit (spec asks for rotation on interactive libs) -
let elevation = INITIAL_ELEVATION;
let azimuth = INITIAL_AZIMUTH;
render(elevation, azimuth);

const ORBIT_SENSITIVITY = 0.35;
const ELEVATION_LIMIT = 85;
svg.style("cursor", "grab").call(
  d3
    .drag()
    .on("start", () => svg.style("cursor", "grabbing"))
    .on("drag", (event) => {
      azimuth += event.dx * ORBIT_SENSITIVITY;
      elevation = Math.max(-ELEVATION_LIMIT, Math.min(ELEVATION_LIMIT, elevation - event.dy * ORBIT_SENSITIVITY));
      render(elevation, azimuth);
    })
    .on("end", () => svg.style("cursor", "grab"))
);

// --- Colorbar: discrete contour-band legend for the value scale -------------
const cbWidth = 26;
const cbX = width - margin.right + 90;
const cbTop = margin.top + 30;
const cbBottom = height - margin.bottom - 30;
const cbScale = d3.scaleLinear().domain([-zAbsMax, zAbsMax]).range([cbBottom, cbTop]);
const colorbarSegments = d3.range(N_BANDS).map((k) => ({
  y0: cbScale(boundaries[k]),
  y1: cbScale(boundaries[k + 1]),
  color: bandColors[k],
}));

const cbGroup = svg.append("g");
cbGroup
  .selectAll("rect")
  .data(colorbarSegments)
  .join("rect")
  .attr("x", cbX)
  .attr("y", (d) => Math.min(d.y0, d.y1))
  .attr("width", cbWidth)
  .attr("height", (d) => Math.abs(d.y1 - d.y0))
  .attr("fill", (d) => d.color);

cbGroup
  .append("rect")
  .attr("x", cbX)
  .attr("y", cbTop)
  .attr("width", cbWidth)
  .attr("height", cbBottom - cbTop)
  .attr("fill", "none")
  .attr("stroke", t.inkSoft)
  .attr("stroke-width", 1.2);

const cbTicks = d3.ticks(-zAbsMax, zAbsMax, 6);
cbGroup
  .selectAll("line.cb-tick")
  .data(cbTicks)
  .join("line")
  .attr("class", "cb-tick")
  .attr("x1", cbX + cbWidth)
  .attr("x2", cbX + cbWidth + 8)
  .attr("y1", (d) => cbScale(d))
  .attr("y2", (d) => cbScale(d))
  .attr("stroke", t.inkSoft)
  .attr("stroke-width", 1.2);

cbGroup
  .selectAll("text.cb-label")
  .data(cbTicks)
  .join("text")
  .attr("class", "cb-label")
  .attr("x", cbX + cbWidth + 14)
  .attr("y", (d) => cbScale(d))
  .attr("dominant-baseline", "middle")
  .attr("fill", t.inkSoft)
  .style("font-size", "13px")
  .text((d) => d3.format(".1f")(d));

cbGroup
  .append("text")
  .attr("x", cbX + cbWidth / 2)
  .attr("y", cbTop - 18)
  .attr("text-anchor", "middle")
  .attr("fill", t.ink)
  .style("font-size", "15px")
  .style("font-weight", "600")
  .text("Objective Value");

// --- Title ----------------------------------------------------------------
const TITLE = "Optimization Landscape · contour-3d · javascript · d3 · anyplot.ai";
const TITLE_BASE_FONT = 22;
const TITLE_FLOOR_FONT = 15;
const titleFontSize = Math.max(TITLE_FLOOR_FONT, Math.round(TITLE_BASE_FONT * Math.min(1, 67 / TITLE.length)));

svg
  .append("text")
  .attr("x", width / 2)
  .attr("y", 56)
  .attr("text-anchor", "middle")
  .attr("fill", t.ink)
  .style("font-size", `${titleFontSize}px`)
  .style("font-weight", "600")
  .text(TITLE);
Runnable source as JSON, for any HTTP client: https://api.anyplot.ai/specs/contour-3d/d3/code. Any spec id and library id listed in llms-full.txt fit the same URL shape; every URL below is complete and callable.
{
  "spec_id": "contour-3d",
  "language": "javascript",
  "library": "d3",
  "page": "https://anyplot.ai/contour-3d/javascript/d3",
  "hub": "https://anyplot.ai/contour-3d",
  "code_json": "https://api.anyplot.ai/specs/contour-3d/d3/code",
  "spec_json": "https://api.anyplot.ai/specs/contour-3d",
  "render_light_png": "https://storage.googleapis.com/anyplot-images/plots/contour-3d/javascript/d3/plot-light.png",
  "render_dark_png": "https://storage.googleapis.com/anyplot-images/plots/contour-3d/javascript/d3/plot-dark.png",
  "interactive_light_html": "https://storage.googleapis.com/anyplot-images/plots/contour-3d/javascript/d3/plot-light.html",
  "interactive_dark_html": "https://storage.googleapis.com/anyplot-images/plots/contour-3d/javascript/d3/plot-dark.html",
  "quality_score": 92.0,
  "license": "MIT",
  "guide": "https://anyplot.ai/llms.txt"
}
Part of 3D Contour Plot on anyplot.ai.