The same plot in 13 other libraries — Python: Bokeh, lets-plot, Matplotlib, Plotly, Pygal, Seaborn; R: ggplot2; Julia: Makie.jl; JavaScript: Chart.js, D3.js, Apache ECharts, Highcharts, MUI X Charts. Compare all 14 side by side: 3D Contour Plot in Python, R, Julia and JavaScript.
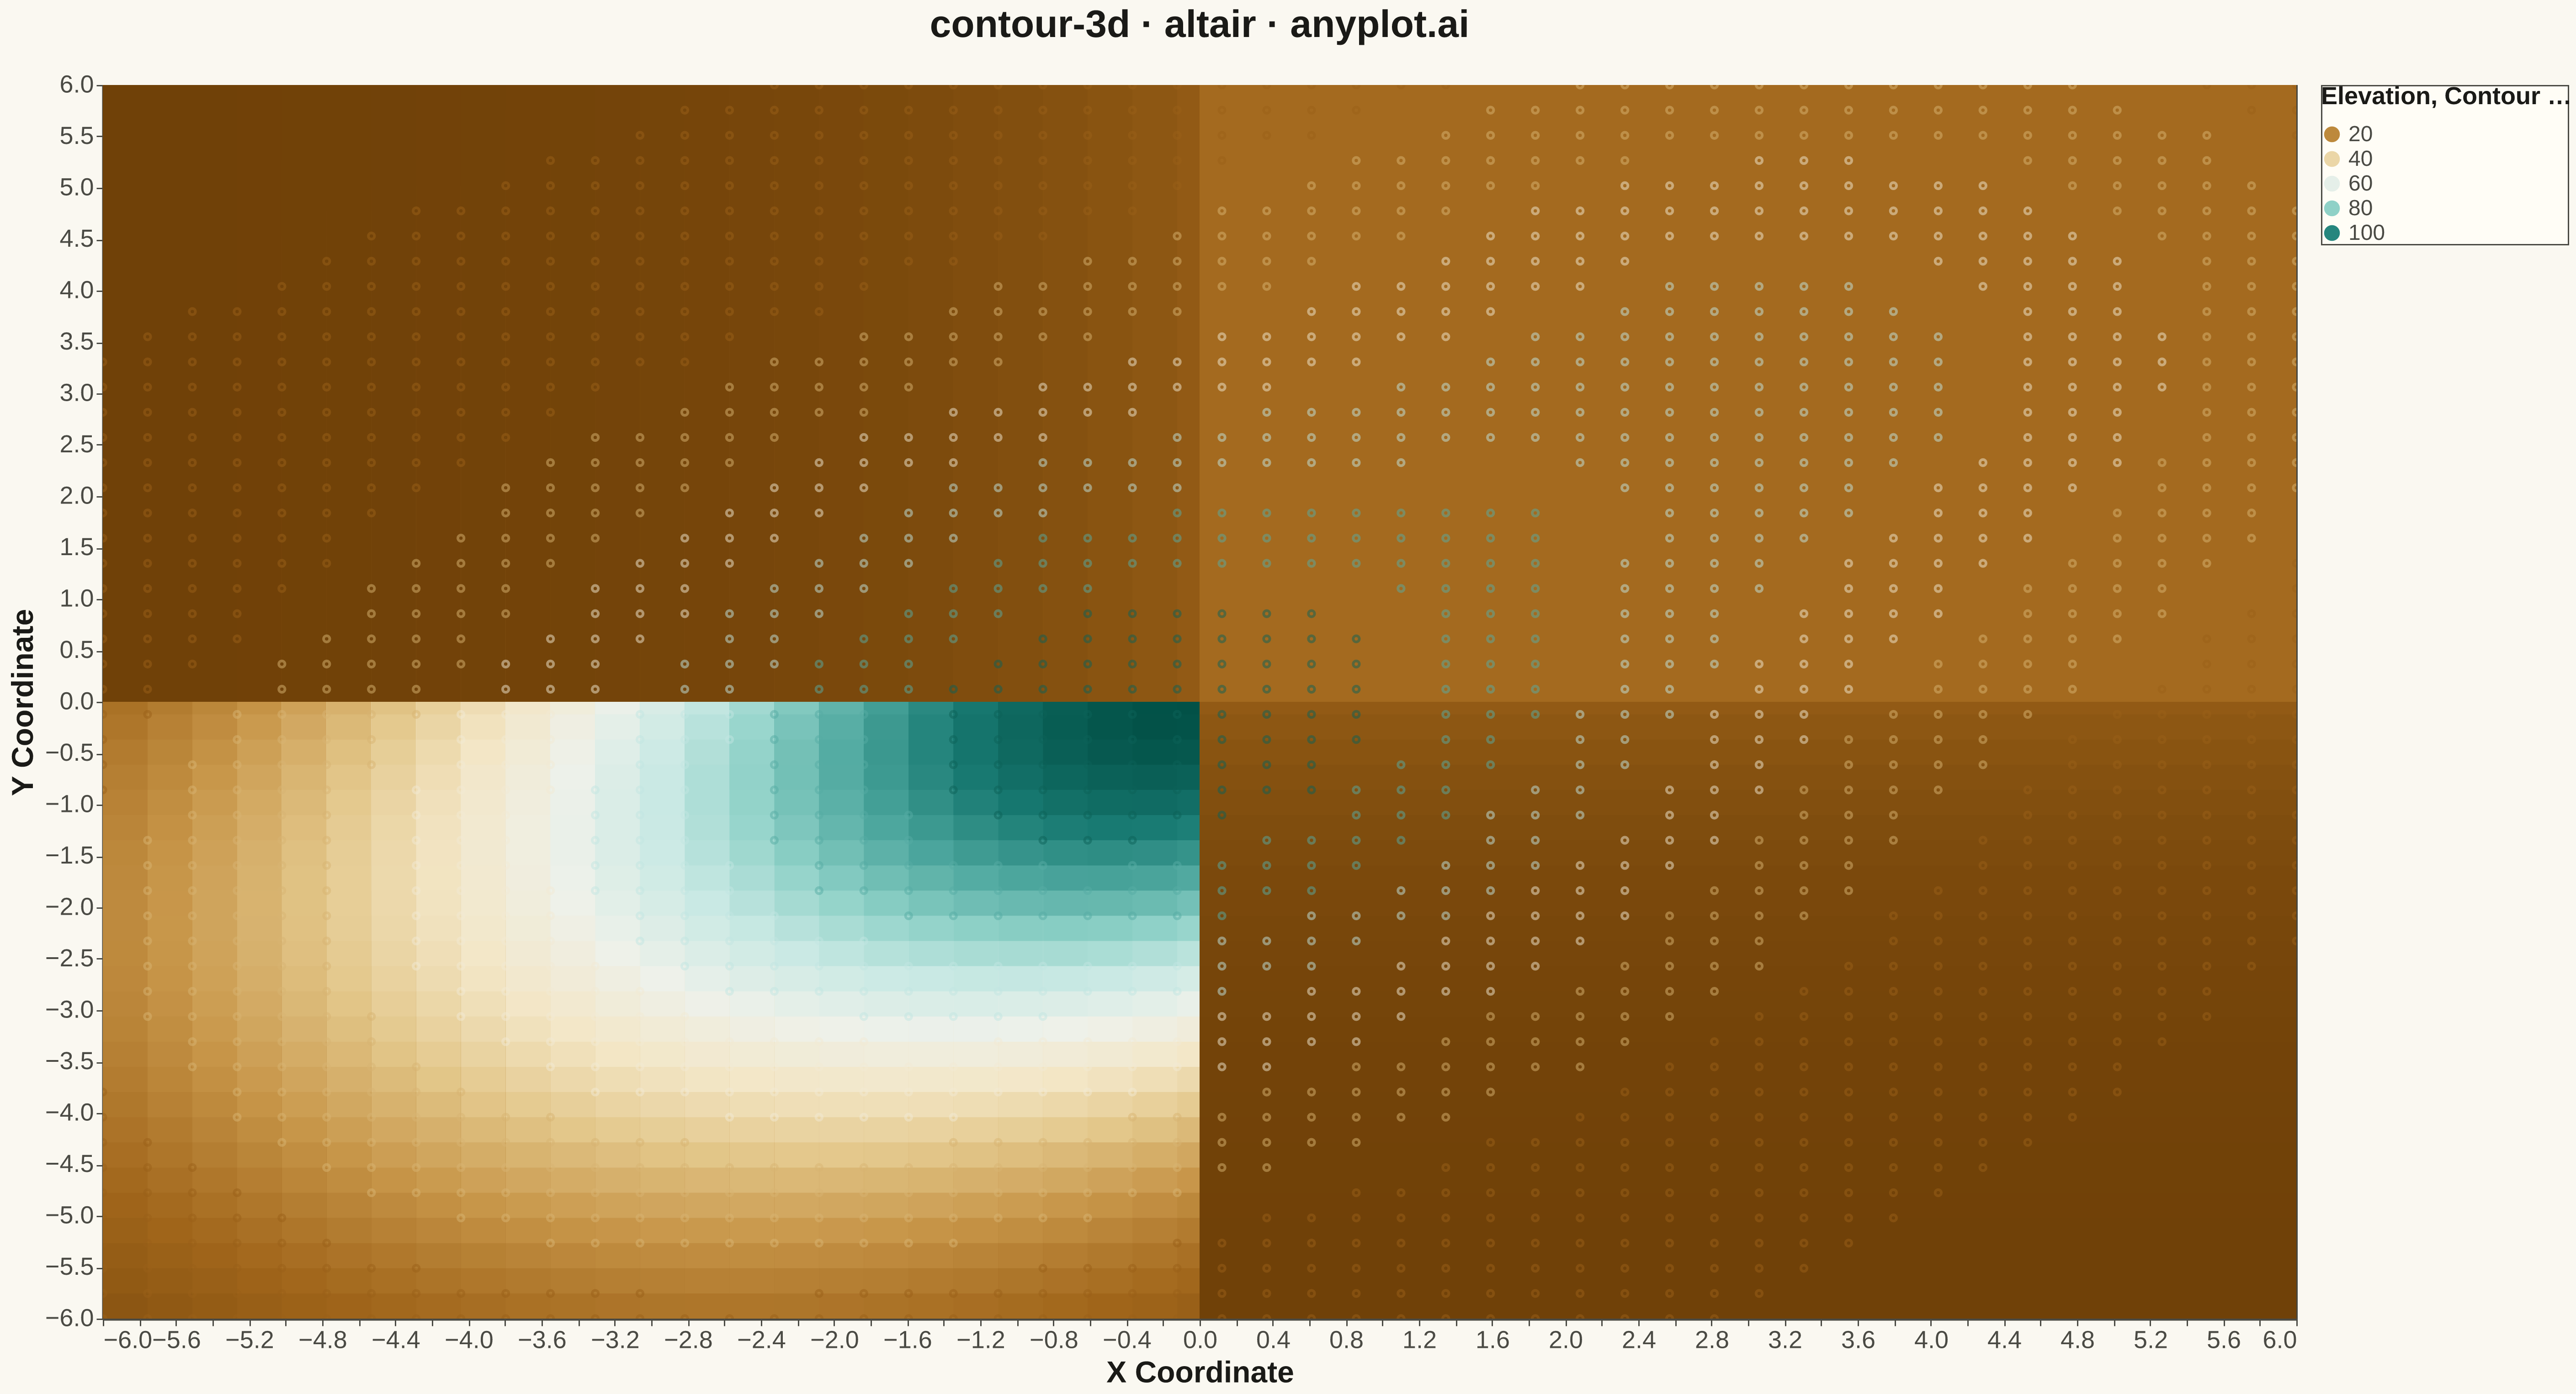
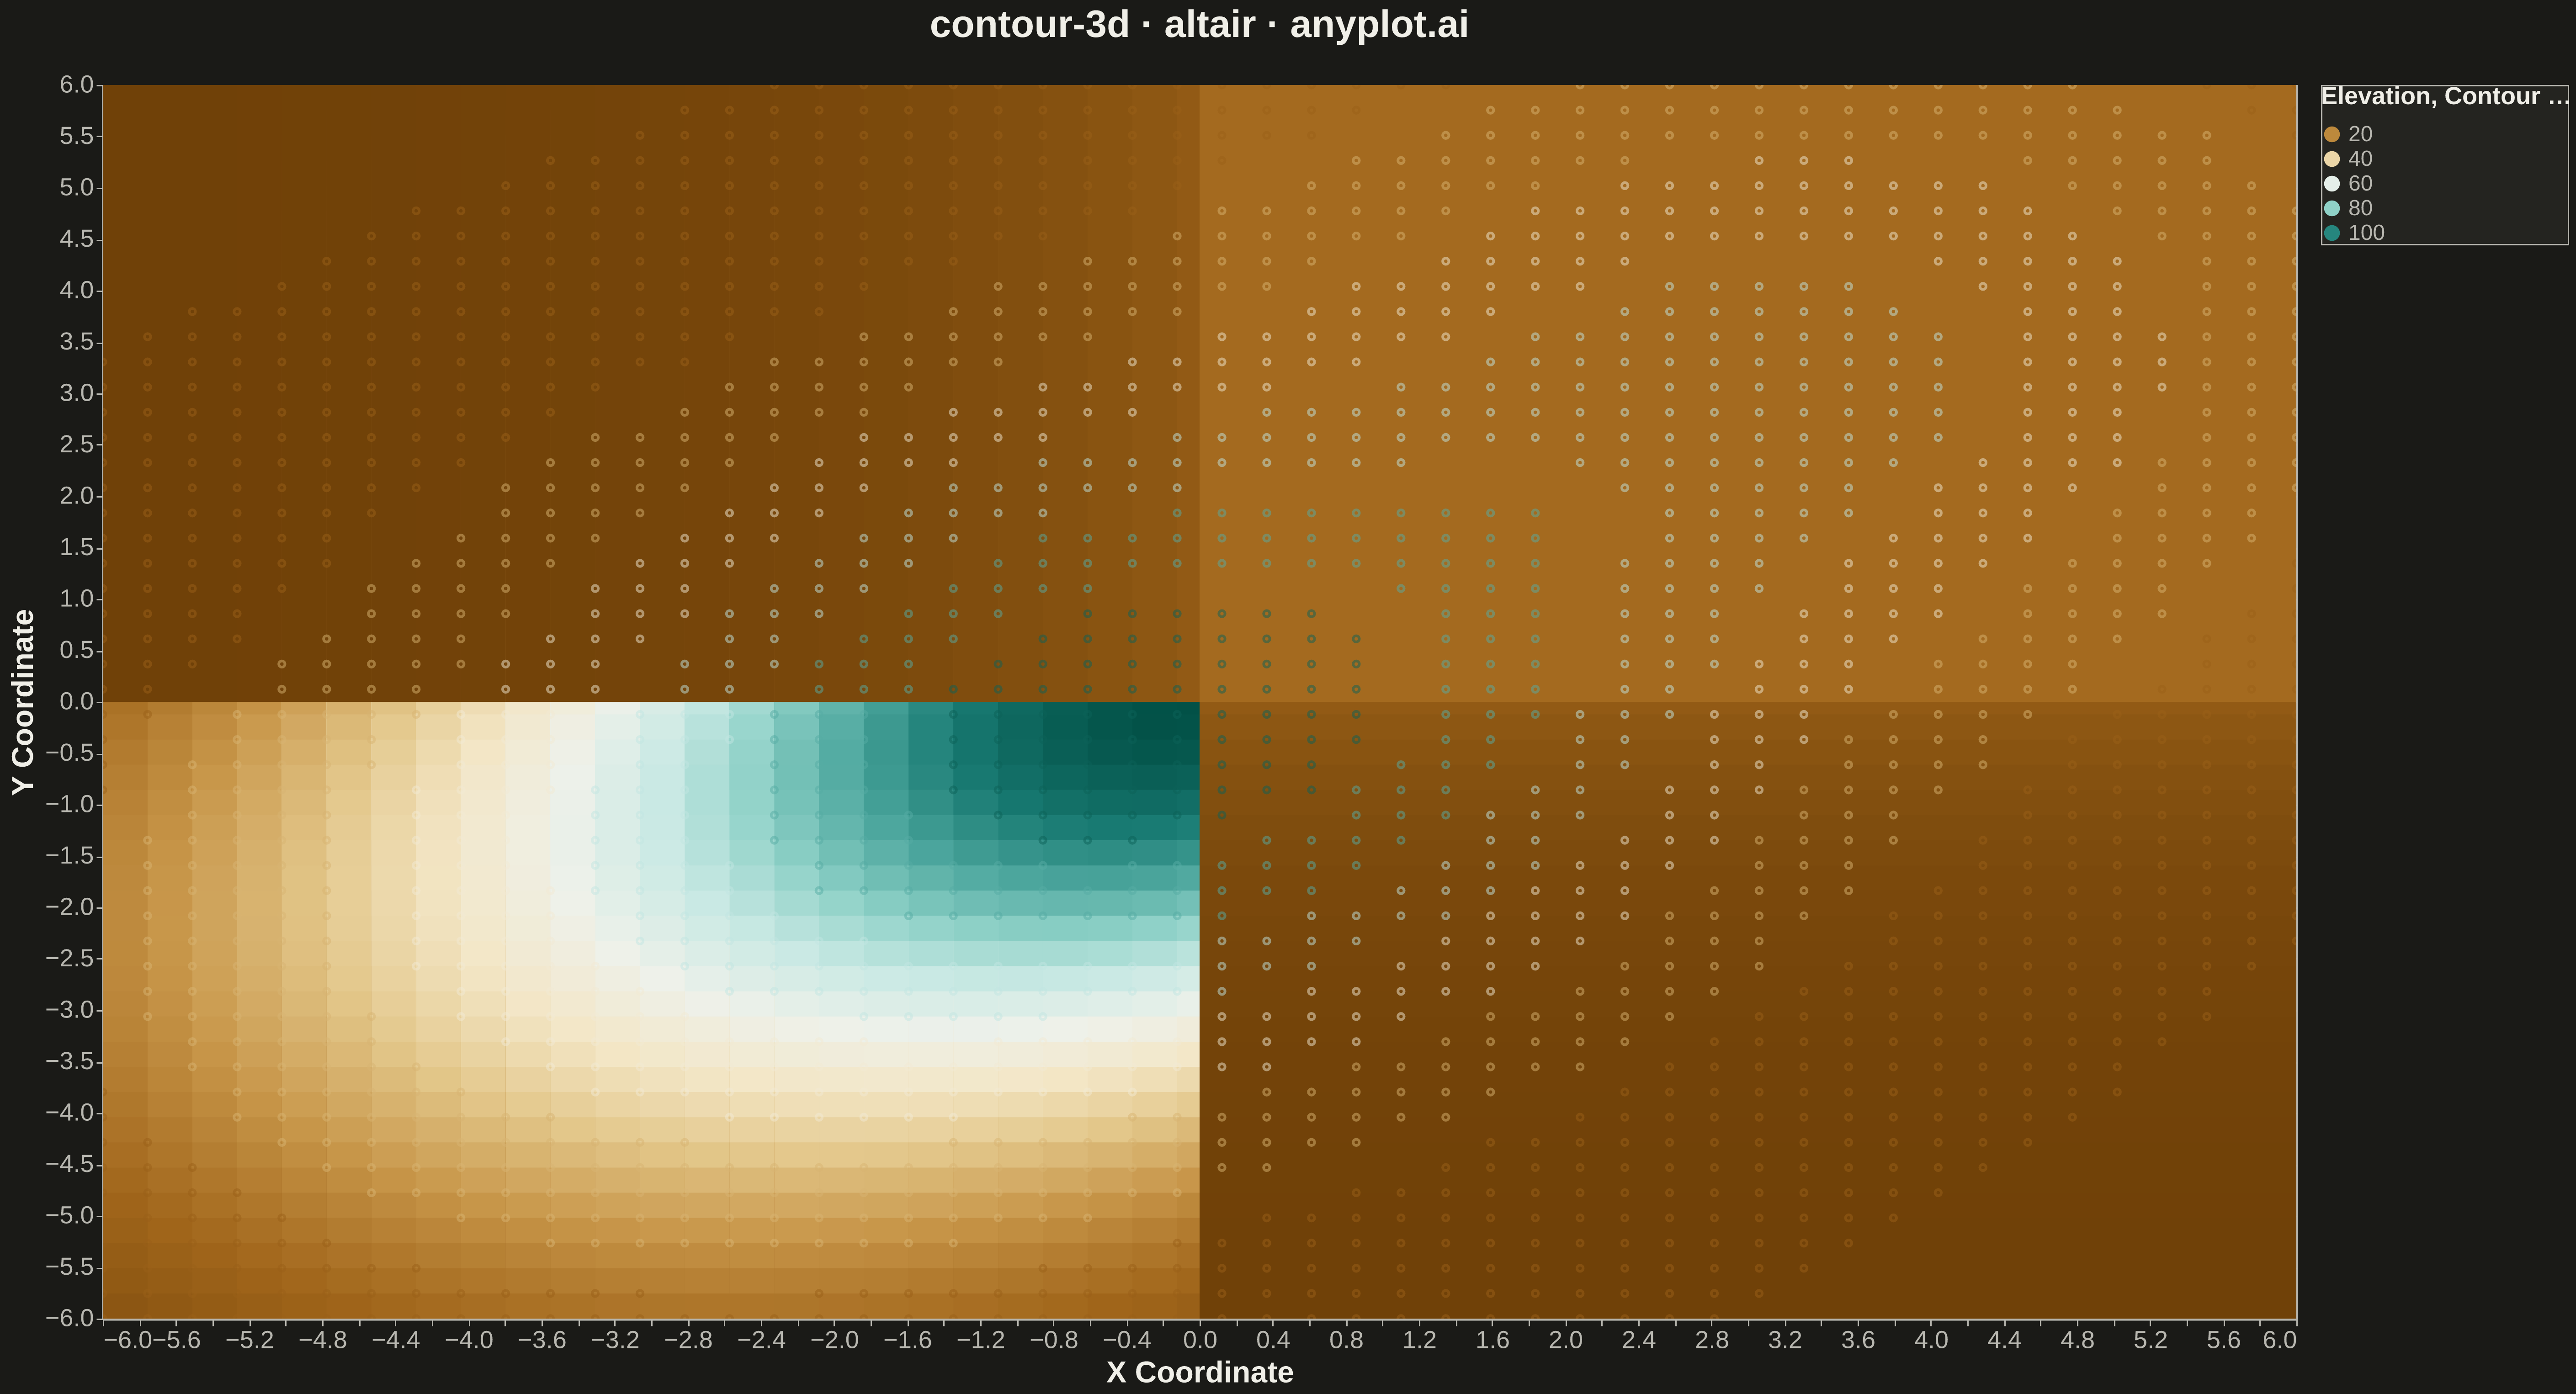
A 3D contour plot displays contour lines or filled contour bands on a three-dimensional surface, showing isolines of a function of two variables in 3D space. Unlike 2D contour plots that flatten the visualization, 3D contour plots preserve the surface geometry while highlighting level curves, making it easier to understand both the overall shape and specific value regions simultaneously. This visualization combines the spatial intuition of 3D surfaces with the precision of contour-based value identification.
""" anyplot.ai
contour-3d: 3D Contour Plot
Library: altair 6.1.0 | Python 3.13.13
Quality: 82/100 | Created: 2026-05-16
"""

import os
import sys

import numpy as np
import pandas as pd


# Avoid name collision with the script filename
_sys_path = sys.path[:]
sys.path = [p for p in sys.path if not p.startswith(os.path.dirname(__file__))]
import altair as alt


sys.path = _sys_path

# Theme tokens
THEME = os.getenv("ANYPLOT_THEME", "light")
PAGE_BG = "#FAF8F1" if THEME == "light" else "#1A1A17"
ELEVATED_BG = "#FFFDF6" if THEME == "light" else "#242420"
INK = "#1A1A17" if THEME == "light" else "#F0EFE8"
INK_SOFT = "#4A4A44" if THEME == "light" else "#B8B7B0"

# Data: Multi-modal Gaussian surface with peaks
np.random.seed(42)
x = np.linspace(-6, 6, 50)
y = np.linspace(-6, 6, 50)
X, Y = np.meshgrid(x, y)
Z = (
    100 * np.exp(-(X**2 + Y**2) / 10)
    + 60 * np.exp(-((X - 3.5) ** 2 + (Y - 3.5) ** 2) / 8)
    + 40 * np.exp(-((X + 3) ** 2 + (Y + 2.5) ** 2) / 12)
)

# Prepare data for heatmap
data_points = []
for i in range(len(x)):
    for j in range(len(y)):
        data_points.append({"x": x[i], "y": y[j], "z": Z[j, i]})
df = pd.DataFrame(data_points)

# Extract contour lines at regular intervals by finding grid points near each level
contour_levels = np.arange(10, 160, 20)  # Contours every 20 units
contour_tolerance = 8  # Within 8 units of each level
contour_data = []

for level in contour_levels:
    # Find all grid points where z is close to this contour level
    mask = np.abs(Z - level) < contour_tolerance
    contour_points = np.argwhere(mask)
    for row, col in contour_points:
        contour_data.append({"x": x[col], "y": y[row], "z_actual": float(Z[row, col]), "level": float(level)})

contour_df = pd.DataFrame(contour_data) if contour_data else pd.DataFrame()

# Create base heatmap with diverging colormap for better visual distinction
heatmap = (
    alt.Chart(df)
    .mark_rect()
    .encode(
        x=alt.X("x:Q", title="X Coordinate", scale=alt.Scale(domain=[-6, 6])),
        y=alt.Y("y:Q", title="Y Coordinate", scale=alt.Scale(domain=[-6, 6])),
        color=alt.Color("z:Q", title="Elevation", scale=alt.Scale(scheme="brownbluegreen")),
        tooltip=["x:Q", "y:Q", alt.Tooltip("z:Q", format=".1f")],
    )
    .properties(width=1600, height=900)
)

# Overlay contour lines for explicit level visualization
if len(contour_df) > 0:
    contour_lines = (
        alt.Chart(contour_df)
        .mark_point(size=20, opacity=0.5)
        .encode(
            x="x:Q",
            y="y:Q",
            color=alt.Color("level:Q", scale=alt.Scale(scheme="greys"), legend=alt.Legend(title="Contour Levels")),
            tooltip=["level:Q"],
        )
    )
    chart_base = (heatmap + contour_lines).properties(
        background=PAGE_BG, title=alt.Title("contour-3d · altair · anyplot.ai", fontSize=28)
    )
else:
    chart_base = heatmap.properties(
        background=PAGE_BG, title=alt.Title("contour-3d · altair · anyplot.ai", fontSize=28)
    )

# Apply unified theme configuration
chart = (
    chart_base.configure_view(fill=PAGE_BG, stroke=INK_SOFT, strokeWidth=1)
    .configure_axis(
        domainColor=INK_SOFT,
        domainWidth=2,
        tickColor=INK_SOFT,
        gridColor=INK,
        gridOpacity=0.10,
        labelColor=INK_SOFT,
        labelFontSize=18,
        titleColor=INK,
        titleFontSize=22,
    )
    .configure_legend(
        fillColor=ELEVATED_BG,
        strokeColor=INK_SOFT,
        labelColor=INK_SOFT,
        labelFontSize=16,
        titleColor=INK,
        titleFontSize=18,
        titlePadding=10,
        labelPadding=10,
    )
    .configure_title(color=INK, anchor="middle", offset=20)
    .interactive()
)

# Save to script directory
script_dir = os.path.dirname(os.path.abspath(__file__))
chart.save(os.path.join(script_dir, f"plot-{THEME}.png"), scale_factor=3.0)
chart.save(os.path.join(script_dir, f"plot-{THEME}.html"))
Runnable source as JSON, for any HTTP client: https://api.anyplot.ai/specs/contour-3d/altair/code. Any spec id and library id listed in llms-full.txt fit the same URL shape; every URL below is complete and callable.
{
  "spec_id": "contour-3d",
  "language": "python",
  "library": "altair",
  "page": "https://anyplot.ai/contour-3d/python/altair",
  "hub": "https://anyplot.ai/contour-3d",
  "code_json": "https://api.anyplot.ai/specs/contour-3d/altair/code",
  "spec_json": "https://api.anyplot.ai/specs/contour-3d",
  "render_light_png": "https://storage.googleapis.com/anyplot-images/plots/contour-3d/python/altair/plot-light.png",
  "render_dark_png": "https://storage.googleapis.com/anyplot-images/plots/contour-3d/python/altair/plot-dark.png",
  "interactive_light_html": "https://storage.googleapis.com/anyplot-images/plots/contour-3d/python/altair/plot-light.html",
  "interactive_dark_html": "https://storage.googleapis.com/anyplot-images/plots/contour-3d/python/altair/plot-dark.html",
  "quality_score": 82.0,
  "license": "MIT",
  "guide": "https://anyplot.ai/llms.txt"
}
Part of 3D Contour Plot on anyplot.ai.