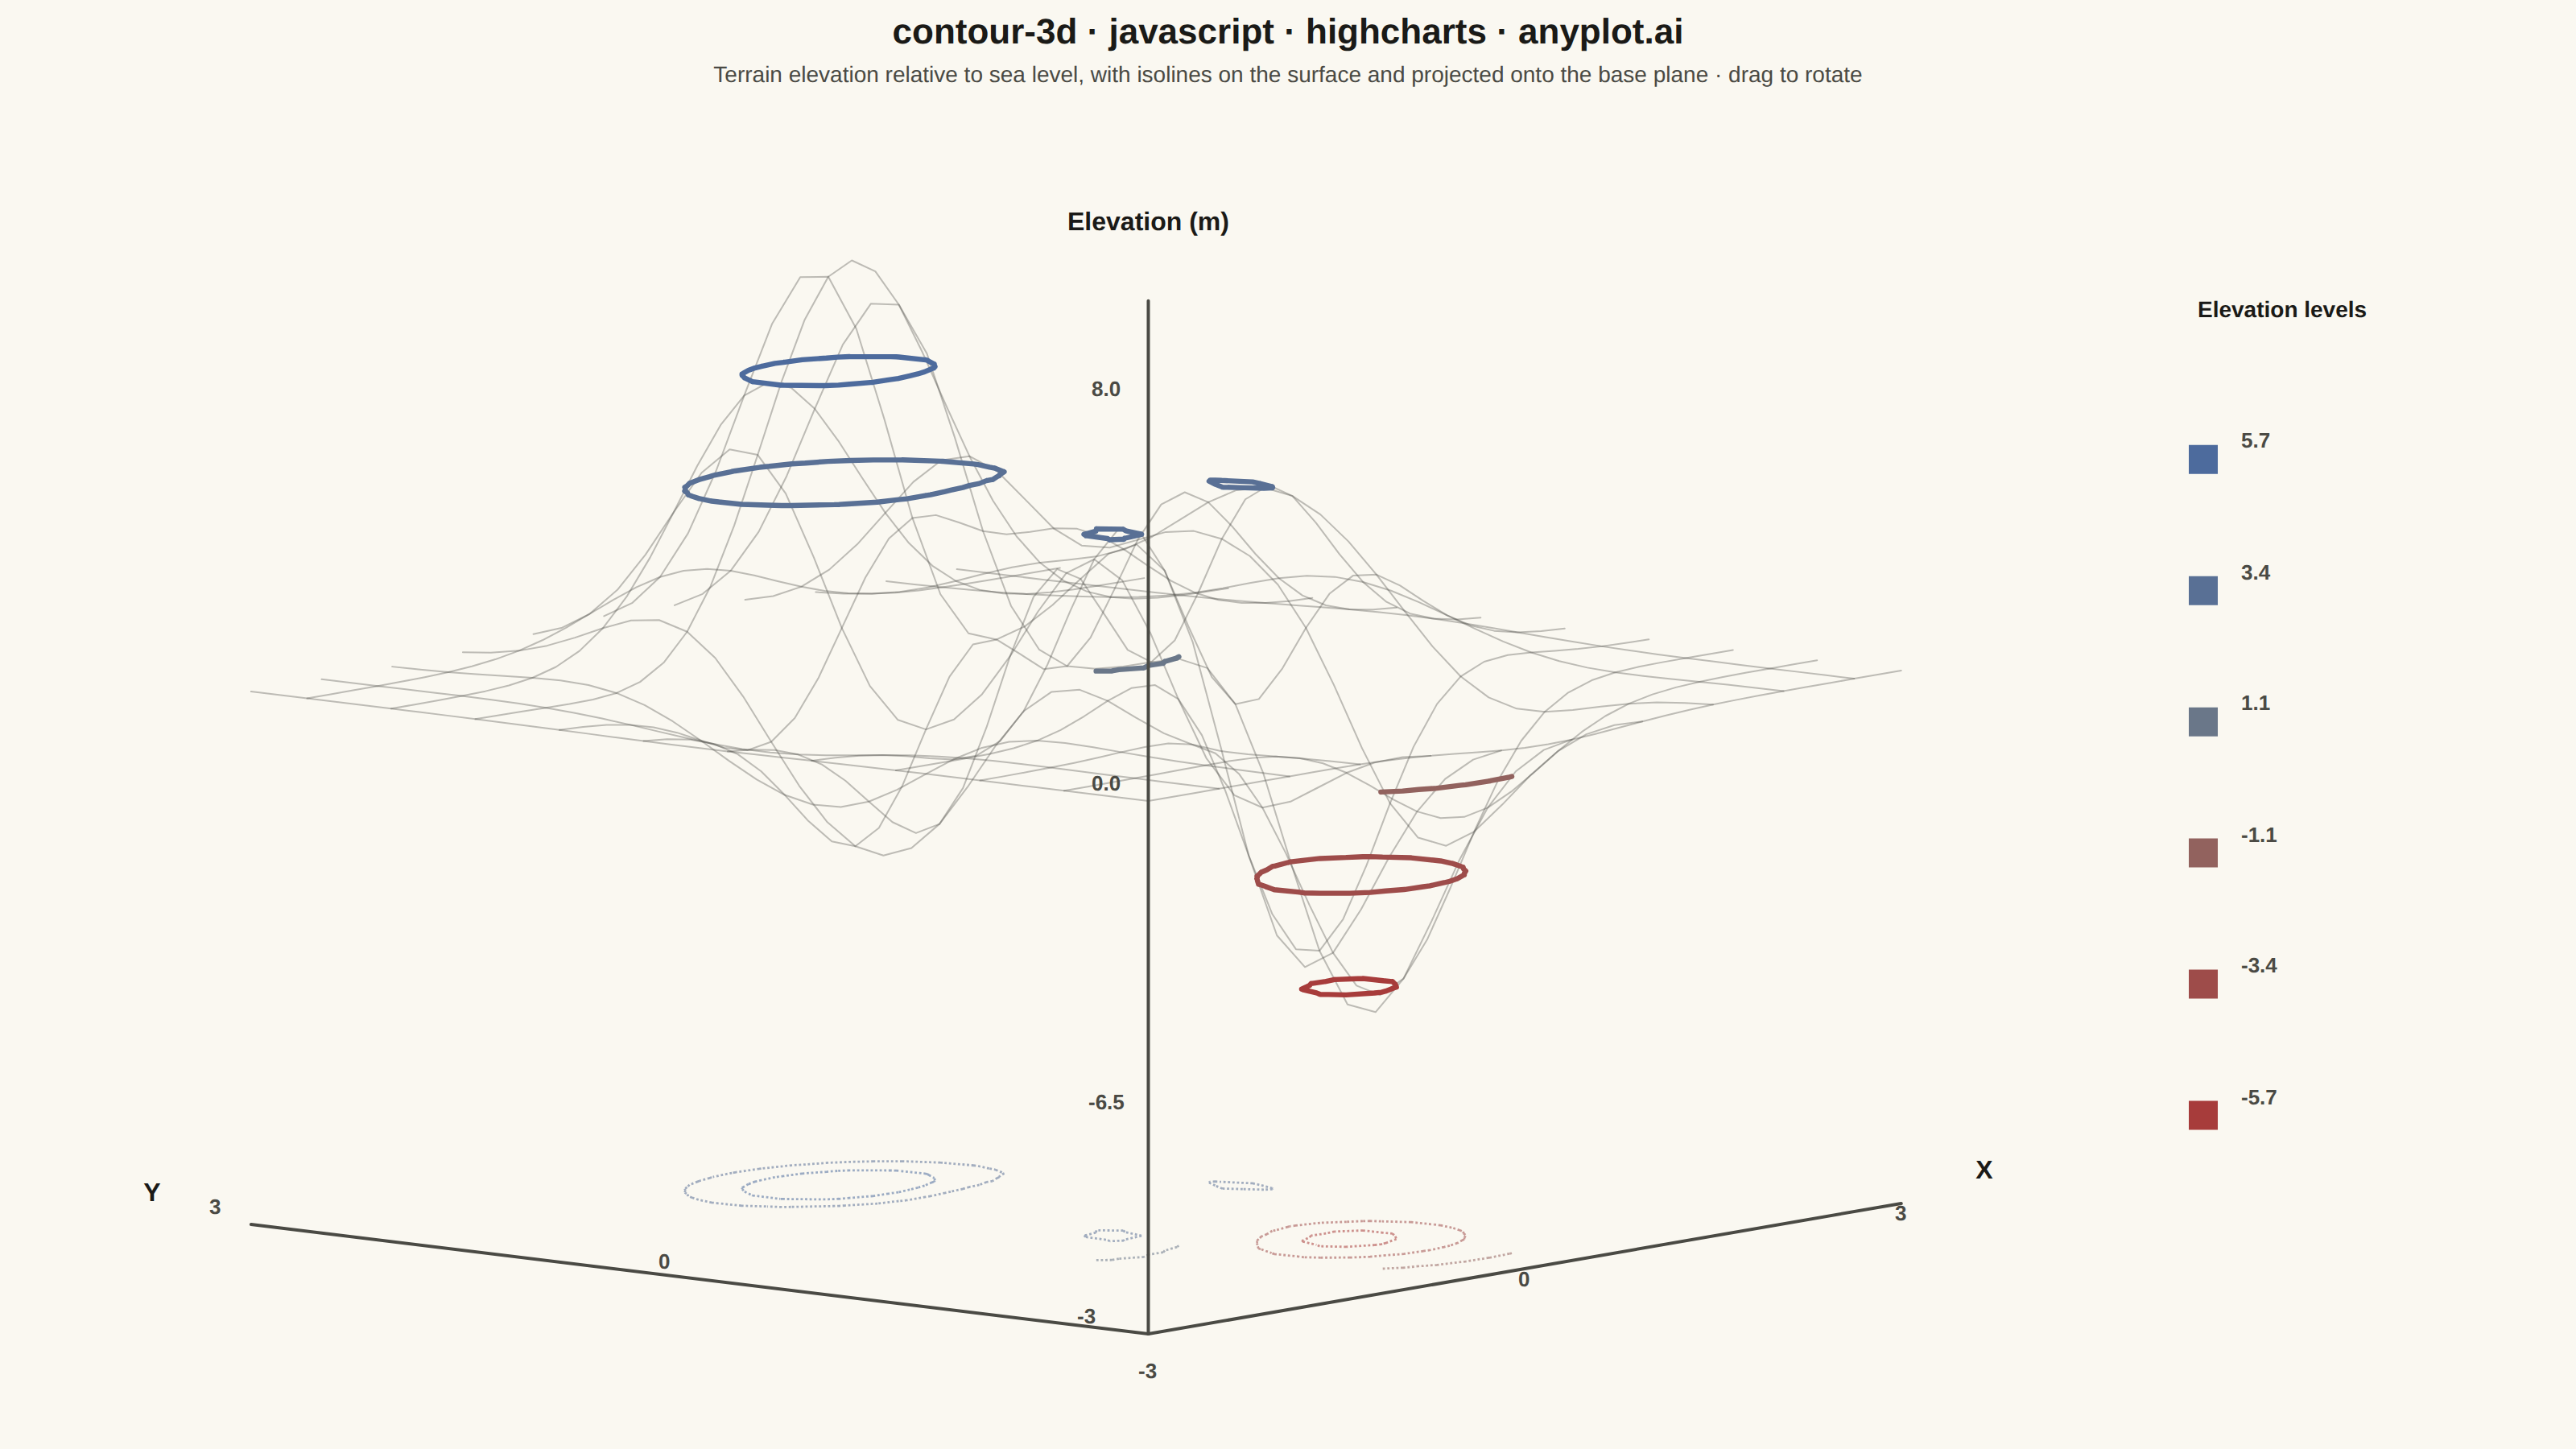
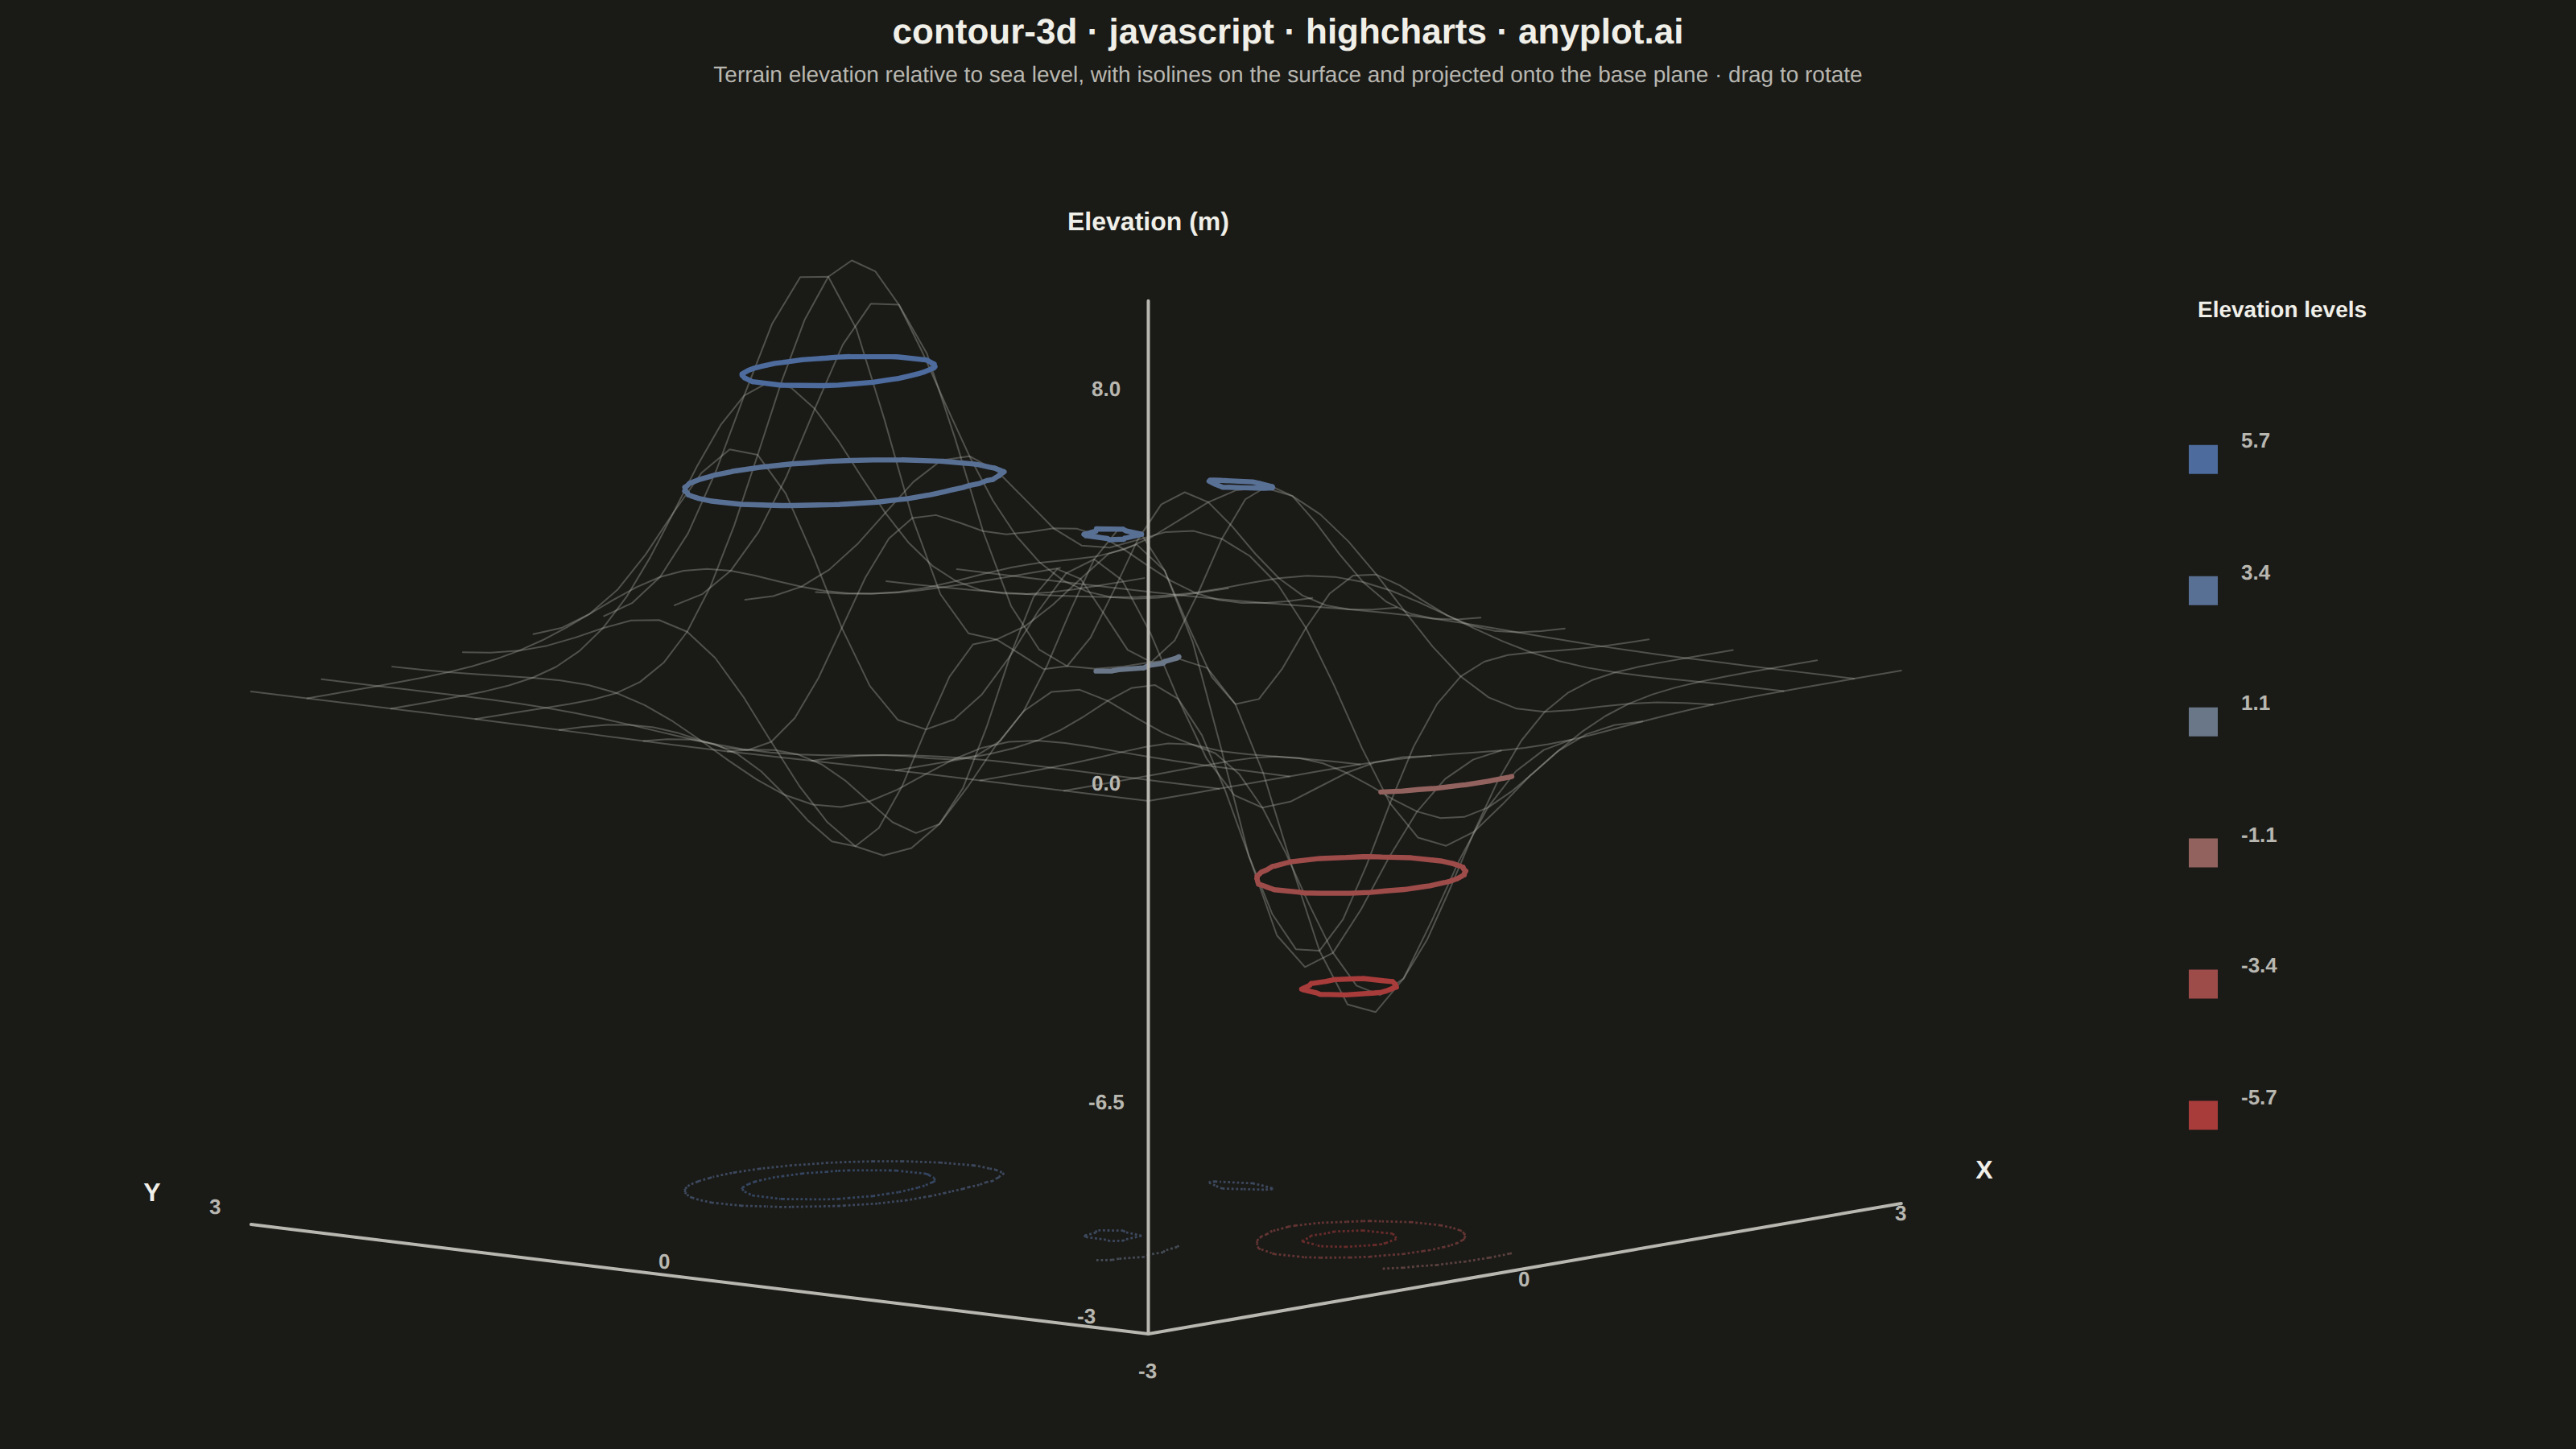
The same plot in 13 other libraries — JavaScript: Chart.js, D3.js, Apache ECharts, MUI X Charts; Python: Altair, Bokeh, lets-plot, Matplotlib, Plotly, Pygal, Seaborn; R: ggplot2; Julia: Makie.jl. Compare all 14 side by side: 3D Contour Plot in Python, R, Julia and JavaScript.
A 3D contour plot displays contour lines or filled contour bands on a three-dimensional surface, showing isolines of a function of two variables in 3D space. Unlike 2D contour plots that flatten the visualization, 3D contour plots preserve the surface geometry while highlighting level curves, making it easier to understand both the overall shape and specific value regions simultaneously. This visualization combines the spatial intuition of 3D surfaces with the precision of contour-based value identification.
// anyplot.ai
// contour-3d: 3D Contour Plot
// Library: highcharts 12.6.0 | JavaScript 22.23.2
// Quality: 84/100 | Created: 2026-09-10

const t = window.ANYPLOT_TOKENS;

// --- Data: "peaks" response surface z = f(x, y) on a 33x33 grid, read as ---
// terrain elevation relative to sea level (z = 0) ---------------------------
const GRID_N = 33;
const RANGE = 3;
const grid = Array.from({ length: GRID_N }, (_, i) => -RANGE + (2 * RANGE * i) / (GRID_N - 1));
const peaks = (x, y) =>
  3 * (1 - x) ** 2 * Math.exp(-(x ** 2) - (y + 1) ** 2) -
  10 * (x / 5 - x ** 3 - y ** 5) * Math.exp(-(x ** 2) - y ** 2) -
  (1 / 3) * Math.exp(-((x + 1) ** 2) - y ** 2);
const zGrid = grid.map((y) => grid.map((x) => peaks(x, y)));
let zMin = Infinity;
let zMax = -Infinity;
zGrid.forEach((row) =>
  row.forEach((z) => {
    if (z < zMin) zMin = z;
    if (z > zMax) zMax = z;
  })
);
const M = Math.max(Math.abs(zMin), Math.abs(zMax));
const floorZ = zMin - (zMax - zMin) * 0.3;
const topZ = zMax + (zMax - zMin) * 0.15;
const fmt = (v) => {
  const s = v.toFixed(1);
  return s === "-0.0" ? "0.0" : s;
};

// --- 3D -> 2D orthographic projection, parameterized so the whole scene can
// be reprojected live on pointer-drag (see "Rotation" near the bottom).
// Highcharts core has no chart3d/highcharts-3d module (and no polygon/
// colorAxis — those live in highcharts-more, also unloaded), so the surface,
// its isolines, and the legend are all projected/drawn by hand as ordinary
// `line`/`scatter` series — the same math a native 3D engine applies before
// rasterizing, just computed here instead of in an unavailable add-on.
const makeProjector = (azimDeg, elevDeg) => {
  const azim = (azimDeg * Math.PI) / 180;
  const elev = (elevDeg * Math.PI) / 180;
  const cosAz = Math.cos(azim);
  const sinAz = Math.sin(azim);
  const cosEl = Math.cos(elev);
  const sinEl = Math.sin(elev);
  return (x, y, z) => {
    const xr = x * cosAz + y * sinAz;
    const yr = -x * sinAz + y * cosAz;
    const zScreen = yr * sinEl + z * cosEl;
    return [xr, zScreen];
  };
};
const AZIM0 = -50;
const ELEV0 = 30;

// --- Color: diverging imprint_div gradient, centered on sea level (z = 0) --
const hexToRgb = (hex) => {
  const n = parseInt(hex.slice(1), 16);
  return [(n >> 16) & 255, (n >> 8) & 255, n & 255];
};
const divLo = hexToRgb(t.div[0]);
const divHi = hexToRgb(t.div[2]);
// The canonical imprint_div midpoint equals the page background (by design,
// for area fills that should "fade to neutral" at zero) — but that midpoint
// is theme-adaptive, so blending isoline strokes toward it (or toward any
// other t.* token) would render the SAME elevation level in a different hue
// per theme. Data colors must be pixel-identical across themes, so strokes
// blend toward this fixed literal neutral instead — still the two Imprint
// diverging anchors, just a theme-invariant midpoint for stroked geometry.
const NEUTRAL_MID = [0x81, 0x80, 0x7a];
const lerpRgb = (a, b, f) => [0, 1, 2].map((i) => Math.round(a[i] + (b[i] - a[i]) * f));
const rgbaStr = ([r, g, b], a) => `rgba(${r}, ${g}, ${b}, ${a})`;
const colorAt = (z, alpha = 1) => {
  const raw = Math.min(1, Math.max(-1, z / M)); // -1..1 around sea level
  const f = Math.sign(raw) * Math.sqrt(Math.abs(raw)); // sqrt eases weak levels toward a legible tint
  return f < 0 ? rgbaStr(lerpRgb(NEUTRAL_MID, divLo, -f), alpha) : rgbaStr(lerpRgb(NEUTRAL_MID, divHi, f), alpha);
};

// --- Contour levels: 6 isolines spanning the elevation range, centered on 0
const N_LEVELS = 6;
const levels = Array.from({ length: N_LEVELS }, (_, i) => -M + ((i + 1) * (2 * M)) / (N_LEVELS + 1));

// --- Isolines via marching-triangles: split each grid cell into 2 -----------
// triangles, then for every triangle + level, linearly interpolate along the
// crossing edges to get a 2-point segment lying exactly on that contour.
// Segments stay in 3D space (a trailing `null` marks a break between
// segments) so they can be reprojected on every rotation frame.
const lerpPt = (a, b, level) => {
  const f = (level - a[2]) / (b[2] - a[2]);
  return [a[0] + (b[0] - a[0]) * f, a[1] + (b[1] - a[1]) * f, level];
};
const triangleSegment = (v0, v1, v2, level) => {
  const pts = [];
  [
    [v0, v1],
    [v1, v2],
    [v2, v0],
  ].forEach(([a, b]) => {
    if ((a[2] - level) * (b[2] - level) < 0) pts.push(lerpPt(a, b, level));
  });
  return pts.length === 2 ? pts : null;
};

const surfaceSegments3D = levels.map(() => []);
const baseSegments3D = levels.map(() => []);
for (let j = 0; j < GRID_N - 1; j++) {
  for (let i = 0; i < GRID_N - 1; i++) {
    const c00 = [grid[i], grid[j], zGrid[j][i]];
    const c10 = [grid[i + 1], grid[j], zGrid[j][i + 1]];
    const c01 = [grid[i], grid[j + 1], zGrid[j + 1][i]];
    const c11 = [grid[i + 1], grid[j + 1], zGrid[j + 1][i + 1]];
    [
      [c00, c10, c01],
      [c10, c11, c01],
    ].forEach((tri) => {
      levels.forEach((level, li) => {
        const seg = triangleSegment(tri[0], tri[1], tri[2], level);
        if (!seg) return;
        const [p1, p2] = seg;
        surfaceSegments3D[li].push(p1, p2, null);
        baseSegments3D[li].push([p1[0], p1[1], floorZ], [p2[0], p2[1], floorZ], null);
      });
    });
  }
}

// --- Sparse wireframe mesh: carries the surface geometry between isolines --
// Drawn in a fixed neutral (not value-coded) so it reads as structure — the
// diverging colormap is reserved for the isolines, the actual data encoding.
// Thinned further (larger stride, lower alpha) so the isoline rings read
// clearly instead of getting lost in crossing mesh lines.
const MESH_STRIDE = 3;
const meshColor = rgbaStr(hexToRgb(t.inkSoft), 0.35);
const meshRows3D = [];
for (let j = 0; j < GRID_N; j += MESH_STRIDE) {
  meshRows3D.push(grid.map((x, i) => [x, grid[j], zGrid[j][i]]));
}
const meshCols3D = [];
for (let i = 0; i < GRID_N; i += MESH_STRIDE) {
  meshCols3D.push(grid.map((y, j) => [grid[i], y, zGrid[j][i]]));
}

// --- Axis ticks + titles as labeled points (core dataLabels, no modules) ---
// Kept as 3D coordinate + label definitions so they rotate along with the
// frame; the per-point pixel offsets are tuned for the initial pose and stay
// a good-enough approximation while dragging.
const tickVals = [-RANGE, 0, RANGE];
const tickPointsDef = [];
tickVals.forEach((v) => {
  const cornerBoost = v === -RANGE ? 16 : 0;
  tickPointsDef.push({ p: [v, -RANGE, floorZ], name: String(v), dataLabels: { x: 0, y: 18 + cornerBoost } });
});
tickVals.forEach((v) => {
  const cornerBoost = v === -RANGE ? 16 : 0;
  tickPointsDef.push({ p: [-RANGE, v, floorZ], name: String(v), dataLabels: { x: -22 - cornerBoost, y: 0 } });
});
[zMin, 0, zMax].forEach((v) => {
  tickPointsDef.push({ p: [-RANGE, -RANGE, v], name: fmt(v), dataLabels: { x: -26, y: 0 } });
});

const titlePointsDef = [
  { p: [RANGE * 1.22, -RANGE, floorZ], name: "X" },
  { p: [-RANGE, RANGE * 1.22, floorZ], name: "Y" },
  { p: [-RANGE, -RANGE, topZ * 1.12], name: "Elevation (m)" },
];

// --- Frame builder: reprojects every series + refits the axes/legend for a --
// given (azimuth, elevation) pair. Called once for the initial static pose
// and again on every pointer-drag frame (see "Rotation" below).
const buildFrame = (azimDeg, elevDeg) => {
  const proj = makeProjector(azimDeg, elevDeg);
  const reproj = (pts3D) => pts3D.map((p) => (p === null ? [null, null] : proj(...p)));

  const meshRowsData = meshRows3D.map(reproj);
  const meshColsData = meshCols3D.map(reproj);
  const isolineSurfaceData = surfaceSegments3D.map(reproj);
  const isolineBaseData = baseSegments3D.map(reproj);

  const corner = proj(-RANGE, -RANGE, floorZ);
  const xEnd = proj(RANGE, -RANGE, floorZ);
  const yEnd = proj(-RANGE, RANGE, floorZ);
  const zEnd = proj(-RANGE, -RANGE, topZ);
  const axisFrameData = [
    [corner, xEnd],
    [corner, yEnd],
    [corner, zEnd],
  ];

  const tickData = tickPointsDef.map(({ p, name, dataLabels }) => {
    const [sx, sy] = proj(...p);
    return { x: sx, y: sy, name, dataLabels };
  });
  const titleData = titlePointsDef.map(({ p, name }) => {
    const [sx, sy] = proj(...p);
    return { x: sx, y: sy, name };
  });

  // --- Preliminary bounds (everything except the manual colorbar legend) ---
  const prelimPts = [];
  meshRowsData.forEach((s) => s.forEach((p) => prelimPts.push(p)));
  meshColsData.forEach((s) => s.forEach((p) => prelimPts.push(p)));
  isolineSurfaceData.forEach((s) => s.forEach((p) => p[1] !== null && prelimPts.push(p)));
  [corner, xEnd, yEnd, zEnd].forEach((p) => prelimPts.push(p));
  [...tickData, ...titleData].forEach((p) => prelimPts.push([p.x, p.y]));
  const prelimX = prelimPts.map((p) => p[0]);
  const prelimY = prelimPts.map((p) => p[1]);
  const pMinX = Math.min(...prelimX);
  const pMaxX = Math.max(...prelimX);
  const pMinY = Math.min(...prelimY);
  const pMaxY = Math.max(...prelimY);

  // --- Manual colorbar: one swatch + value label per isoline level ---------
  // Highcharts core has no ColorAxis (map/heatmap-only), so the level legend
  // is built from ordinary labeled scatter points — the same technique used
  // for the axis ticks above.
  const legendX = pMaxX + (pMaxX - pMinX) * 0.12;
  const legendTop = pMaxY - (pMaxY - pMinY) * 0.08;
  const legendStep = (pMaxY - pMinY) * 0.12;
  const swatchLevels = [...levels].sort((a, b) => b - a);
  const legendSwatchData = swatchLevels.map((level, k) => ({
    x: legendX,
    y: legendTop - (k + 1) * legendStep,
    name: fmt(level),
    color: colorAt(level),
  }));
  const legendHeaderData = [{ x: legendX, y: legendTop, name: "Elevation levels" }];

  // --- Final bounds: everything, with extra right-side room for the legend -
  const allX = [...prelimX, ...legendSwatchData.map((p) => p.x + (pMaxX - pMinX) * 0.12)];
  const allY = [...prelimY, legendTop + legendStep, ...legendSwatchData.map((p) => p.y)];
  const padX = (Math.max(...allX) - Math.min(...allX)) * 0.06;
  const padY = (Math.max(...allY) - Math.min(...allY)) * 0.08;

  return {
    meshRowsData,
    meshColsData,
    isolineSurfaceData,
    isolineBaseData,
    axisFrameData,
    tickData,
    titleData,
    legendSwatchData,
    legendHeaderData,
    xMin: Math.min(...allX) - padX,
    xMax: Math.max(...allX) + padX,
    yMin: Math.min(...allY) - padY,
    yMax: Math.max(...allY) + padY,
  };
};

const frame0 = buildFrame(AZIM0, ELEV0);

const meshRowSeries = frame0.meshRowsData.map((data) => ({
  type: "line",
  data,
  color: meshColor,
  lineWidth: 1,
  marker: { enabled: false },
  enableMouseTracking: false,
  showInLegend: false,
}));
const meshColSeries = frame0.meshColsData.map((data) => ({
  type: "line",
  data,
  color: meshColor,
  lineWidth: 1,
  marker: { enabled: false },
  enableMouseTracking: false,
  showInLegend: false,
}));
const isolineBaseSeries = levels.map((level, li) => ({
  type: "line",
  data: frame0.isolineBaseData[li],
  color: colorAt(level, 0.55),
  lineWidth: 1.4,
  dashStyle: "ShortDot",
  marker: { enabled: false },
  enableMouseTracking: false,
  showInLegend: false,
}));
const isolineSurfaceSeries = levels.map((level, li) => ({
  type: "line",
  data: frame0.isolineSurfaceData[li],
  color: colorAt(level),
  lineWidth: 3.2,
  marker: { enabled: false },
  enableMouseTracking: false,
  showInLegend: false,
}));
const axisFrameSeries = frame0.axisFrameData.map((data) => ({
  type: "line",
  data,
  color: t.inkSoft,
  lineWidth: 2,
  marker: { enabled: false },
  enableMouseTracking: false,
  showInLegend: false,
}));
const tickSeries = {
  type: "scatter",
  data: frame0.tickData,
  marker: { enabled: false },
  enableMouseTracking: false,
  showInLegend: false,
  dataLabels: {
    enabled: true,
    format: "{point.name}",
    allowOverlap: true,
    style: { color: t.inkSoft, fontSize: "13px", textOutline: "none" },
  },
};
const titleSeries = {
  type: "scatter",
  data: frame0.titleData,
  marker: { enabled: false },
  enableMouseTracking: false,
  showInLegend: false,
  dataLabels: {
    enabled: true,
    format: "{point.name}",
    allowOverlap: true,
    style: { color: t.ink, fontSize: "16px", fontWeight: "600", textOutline: "none" },
  },
};
const legendSwatchSeries = {
  type: "scatter",
  data: frame0.legendSwatchData,
  marker: { symbol: "square", radius: 9, lineWidth: 0 },
  enableMouseTracking: false,
  showInLegend: false,
  dataLabels: {
    enabled: true,
    format: "{point.name}",
    align: "left",
    x: 18,
    allowOverlap: true,
    style: { color: t.inkSoft, fontSize: "13px", textOutline: "none" },
  },
};
const legendHeaderSeries = {
  type: "scatter",
  data: frame0.legendHeaderData,
  marker: { enabled: false },
  enableMouseTracking: false,
  showInLegend: false,
  dataLabels: {
    enabled: true,
    format: "{point.name}",
    align: "left",
    x: -9,
    allowOverlap: true,
    style: { color: t.ink, fontSize: "14px", fontWeight: "600", textOutline: "none" },
  },
};

// --- Chart -------------------------------------------------------------
const chart = Highcharts.chart("container", {
  chart: {
    type: "line",
    backgroundColor: "transparent",
    animation: false,
    style: { fontFamily: "inherit" },
  },
  credits: { enabled: false },
  title: {
    text: "contour-3d · javascript · highcharts · anyplot.ai",
    style: { color: t.ink, fontSize: "22px", fontWeight: "600" },
  },
  subtitle: {
    text: "Terrain elevation relative to sea level, with isolines on the surface and projected onto the base plane · drag to rotate",
    style: { color: t.inkSoft, fontSize: "14px" },
  },
  xAxis: {
    visible: false,
    min: frame0.xMin,
    max: frame0.xMax,
    startOnTick: false,
    endOnTick: false,
  },
  yAxis: {
    visible: false,
    min: frame0.yMin,
    max: frame0.yMax,
    startOnTick: false,
    endOnTick: false,
    title: { text: null },
  },
  legend: { enabled: false },
  tooltip: { enabled: false },
  plotOptions: { series: { animation: false } },
  series: [
    ...meshRowSeries,
    ...meshColSeries,
    ...isolineBaseSeries,
    ...isolineSurfaceSeries,
    ...axisFrameSeries,
    tickSeries,
    titleSeries,
    legendSwatchSeries,
    legendHeaderSeries,
  ],
});

// --- Rotation: pointer-drag recomputes azimuth/elevation and reprojects ----
// every series (plus refits the axes/legend), so the HTML export can be
// explored interactively even though Highcharts core has no native 3D/orbit
// controls. The static PNG screenshot never fires a pointer event, so the
// initial AZIM0/ELEV0 pose above is exactly what gets captured.
const applyFrame = (frame) => {
  let idx = 0;
  frame.meshRowsData.forEach((data) => chart.series[idx++].setData(data, false));
  frame.meshColsData.forEach((data) => chart.series[idx++].setData(data, false));
  frame.isolineBaseData.forEach((data) => chart.series[idx++].setData(data, false));
  frame.isolineSurfaceData.forEach((data) => chart.series[idx++].setData(data, false));
  frame.axisFrameData.forEach((data) => chart.series[idx++].setData(data, false));
  chart.series[idx++].setData(frame.tickData, false);
  chart.series[idx++].setData(frame.titleData, false);
  chart.series[idx++].setData(frame.legendSwatchData, false);
  chart.series[idx++].setData(frame.legendHeaderData, false);
  chart.xAxis[0].setExtremes(frame.xMin, frame.xMax, false);
  chart.yAxis[0].setExtremes(frame.yMin, frame.yMax, false);
  chart.redraw();
};

const ROTATE_SENSITIVITY = 0.35; // degrees per pixel dragged
const ELEV_MIN = 5;
const ELEV_MAX = 85; // stay short of 90° to avoid a gimbal flip
let azimDeg = AZIM0;
let elevDeg = ELEV0;
let dragging = false;
let lastX = 0;
let lastY = 0;

chart.container.style.cursor = "grab";
chart.container.addEventListener("pointerdown", (evt) => {
  dragging = true;
  lastX = evt.clientX;
  lastY = evt.clientY;
  chart.container.style.cursor = "grabbing";
});
window.addEventListener("pointermove", (evt) => {
  if (!dragging) return;
  const dx = evt.clientX - lastX;
  const dy = evt.clientY - lastY;
  lastX = evt.clientX;
  lastY = evt.clientY;
  azimDeg -= dx * ROTATE_SENSITIVITY;
  elevDeg = Math.min(ELEV_MAX, Math.max(ELEV_MIN, elevDeg + dy * ROTATE_SENSITIVITY));
  applyFrame(buildFrame(azimDeg, elevDeg));
});
window.addEventListener("pointerup", () => {
  dragging = false;
  chart.container.style.cursor = "grab";
});
Runnable source as JSON, for any HTTP client: https://api.anyplot.ai/specs/contour-3d/highcharts/code. Any spec id and library id listed in llms-full.txt fit the same URL shape; every URL below is complete and callable.
{
  "spec_id": "contour-3d",
  "language": "javascript",
  "library": "highcharts",
  "page": "https://anyplot.ai/contour-3d/javascript/highcharts",
  "hub": "https://anyplot.ai/contour-3d",
  "code_json": "https://api.anyplot.ai/specs/contour-3d/highcharts/code",
  "spec_json": "https://api.anyplot.ai/specs/contour-3d",
  "render_light_png": "https://storage.googleapis.com/anyplot-images/plots/contour-3d/javascript/highcharts/plot-light.png",
  "render_dark_png": "https://storage.googleapis.com/anyplot-images/plots/contour-3d/javascript/highcharts/plot-dark.png",
  "interactive_light_html": "https://storage.googleapis.com/anyplot-images/plots/contour-3d/javascript/highcharts/plot-light.html",
  "interactive_dark_html": "https://storage.googleapis.com/anyplot-images/plots/contour-3d/javascript/highcharts/plot-dark.html",
  "quality_score": 84.0,
  "license": "MIT",
  "guide": "https://anyplot.ai/llms.txt"
}
Part of 3D Contour Plot on anyplot.ai.