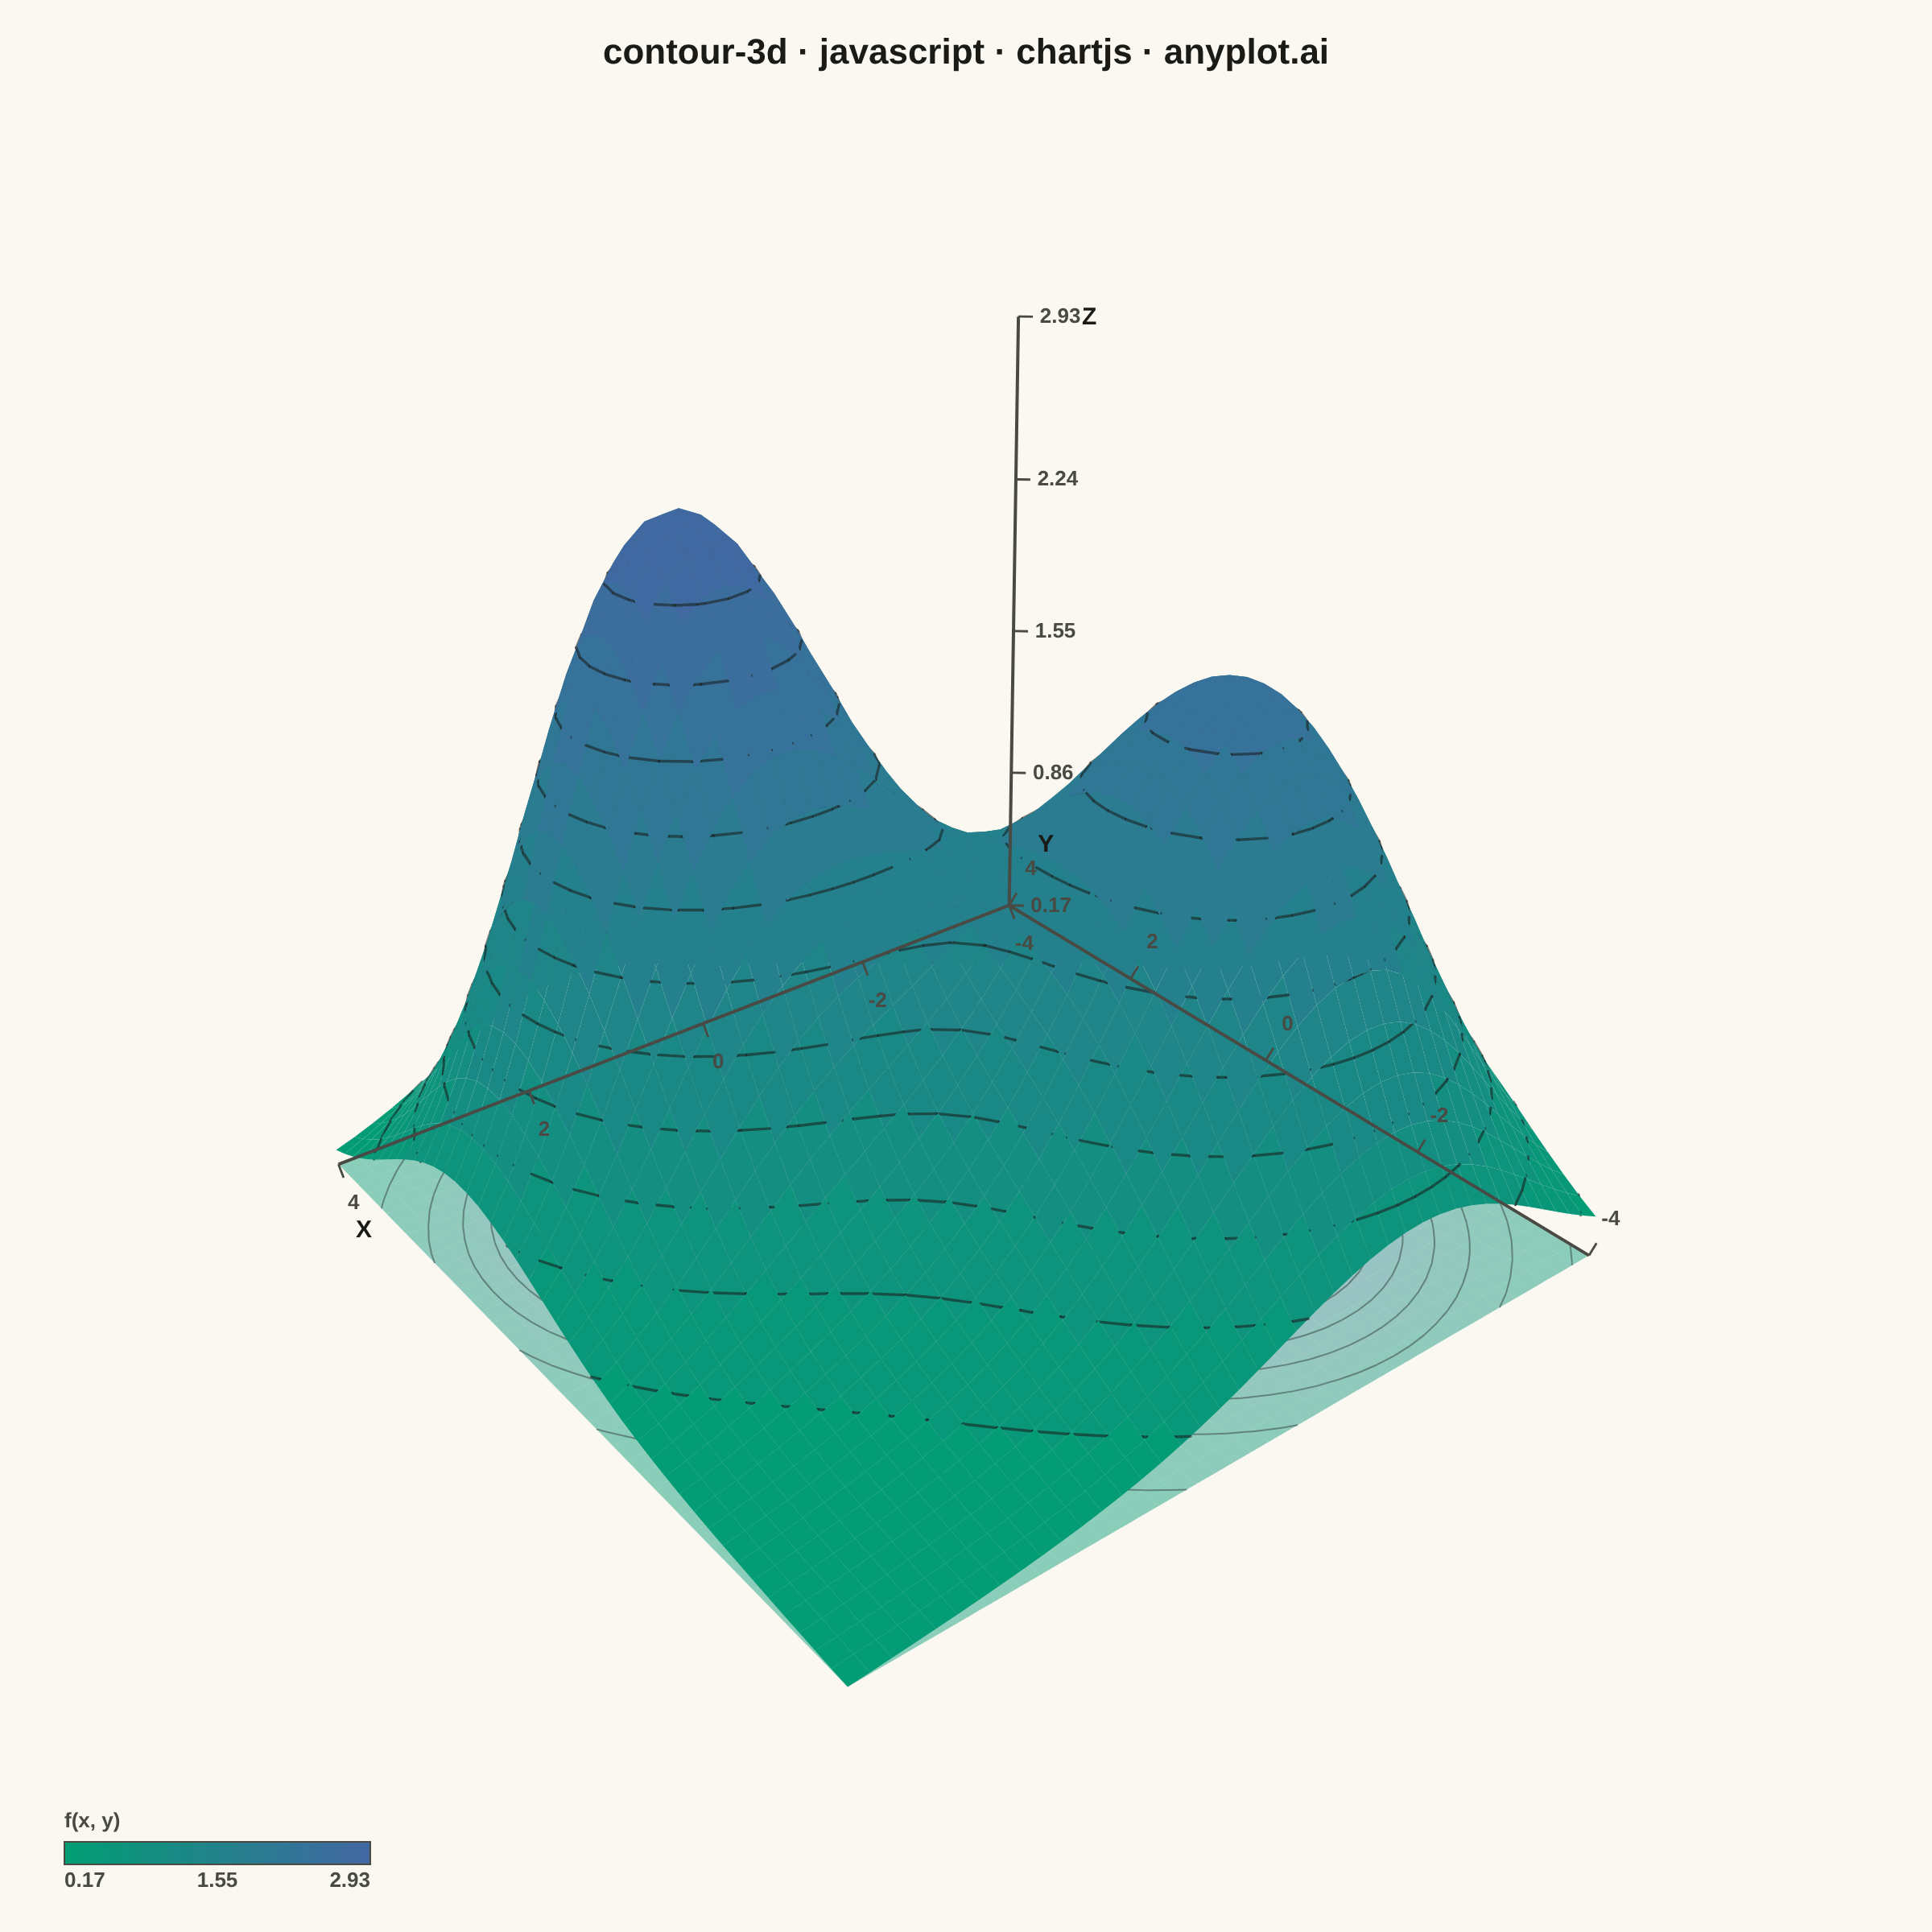
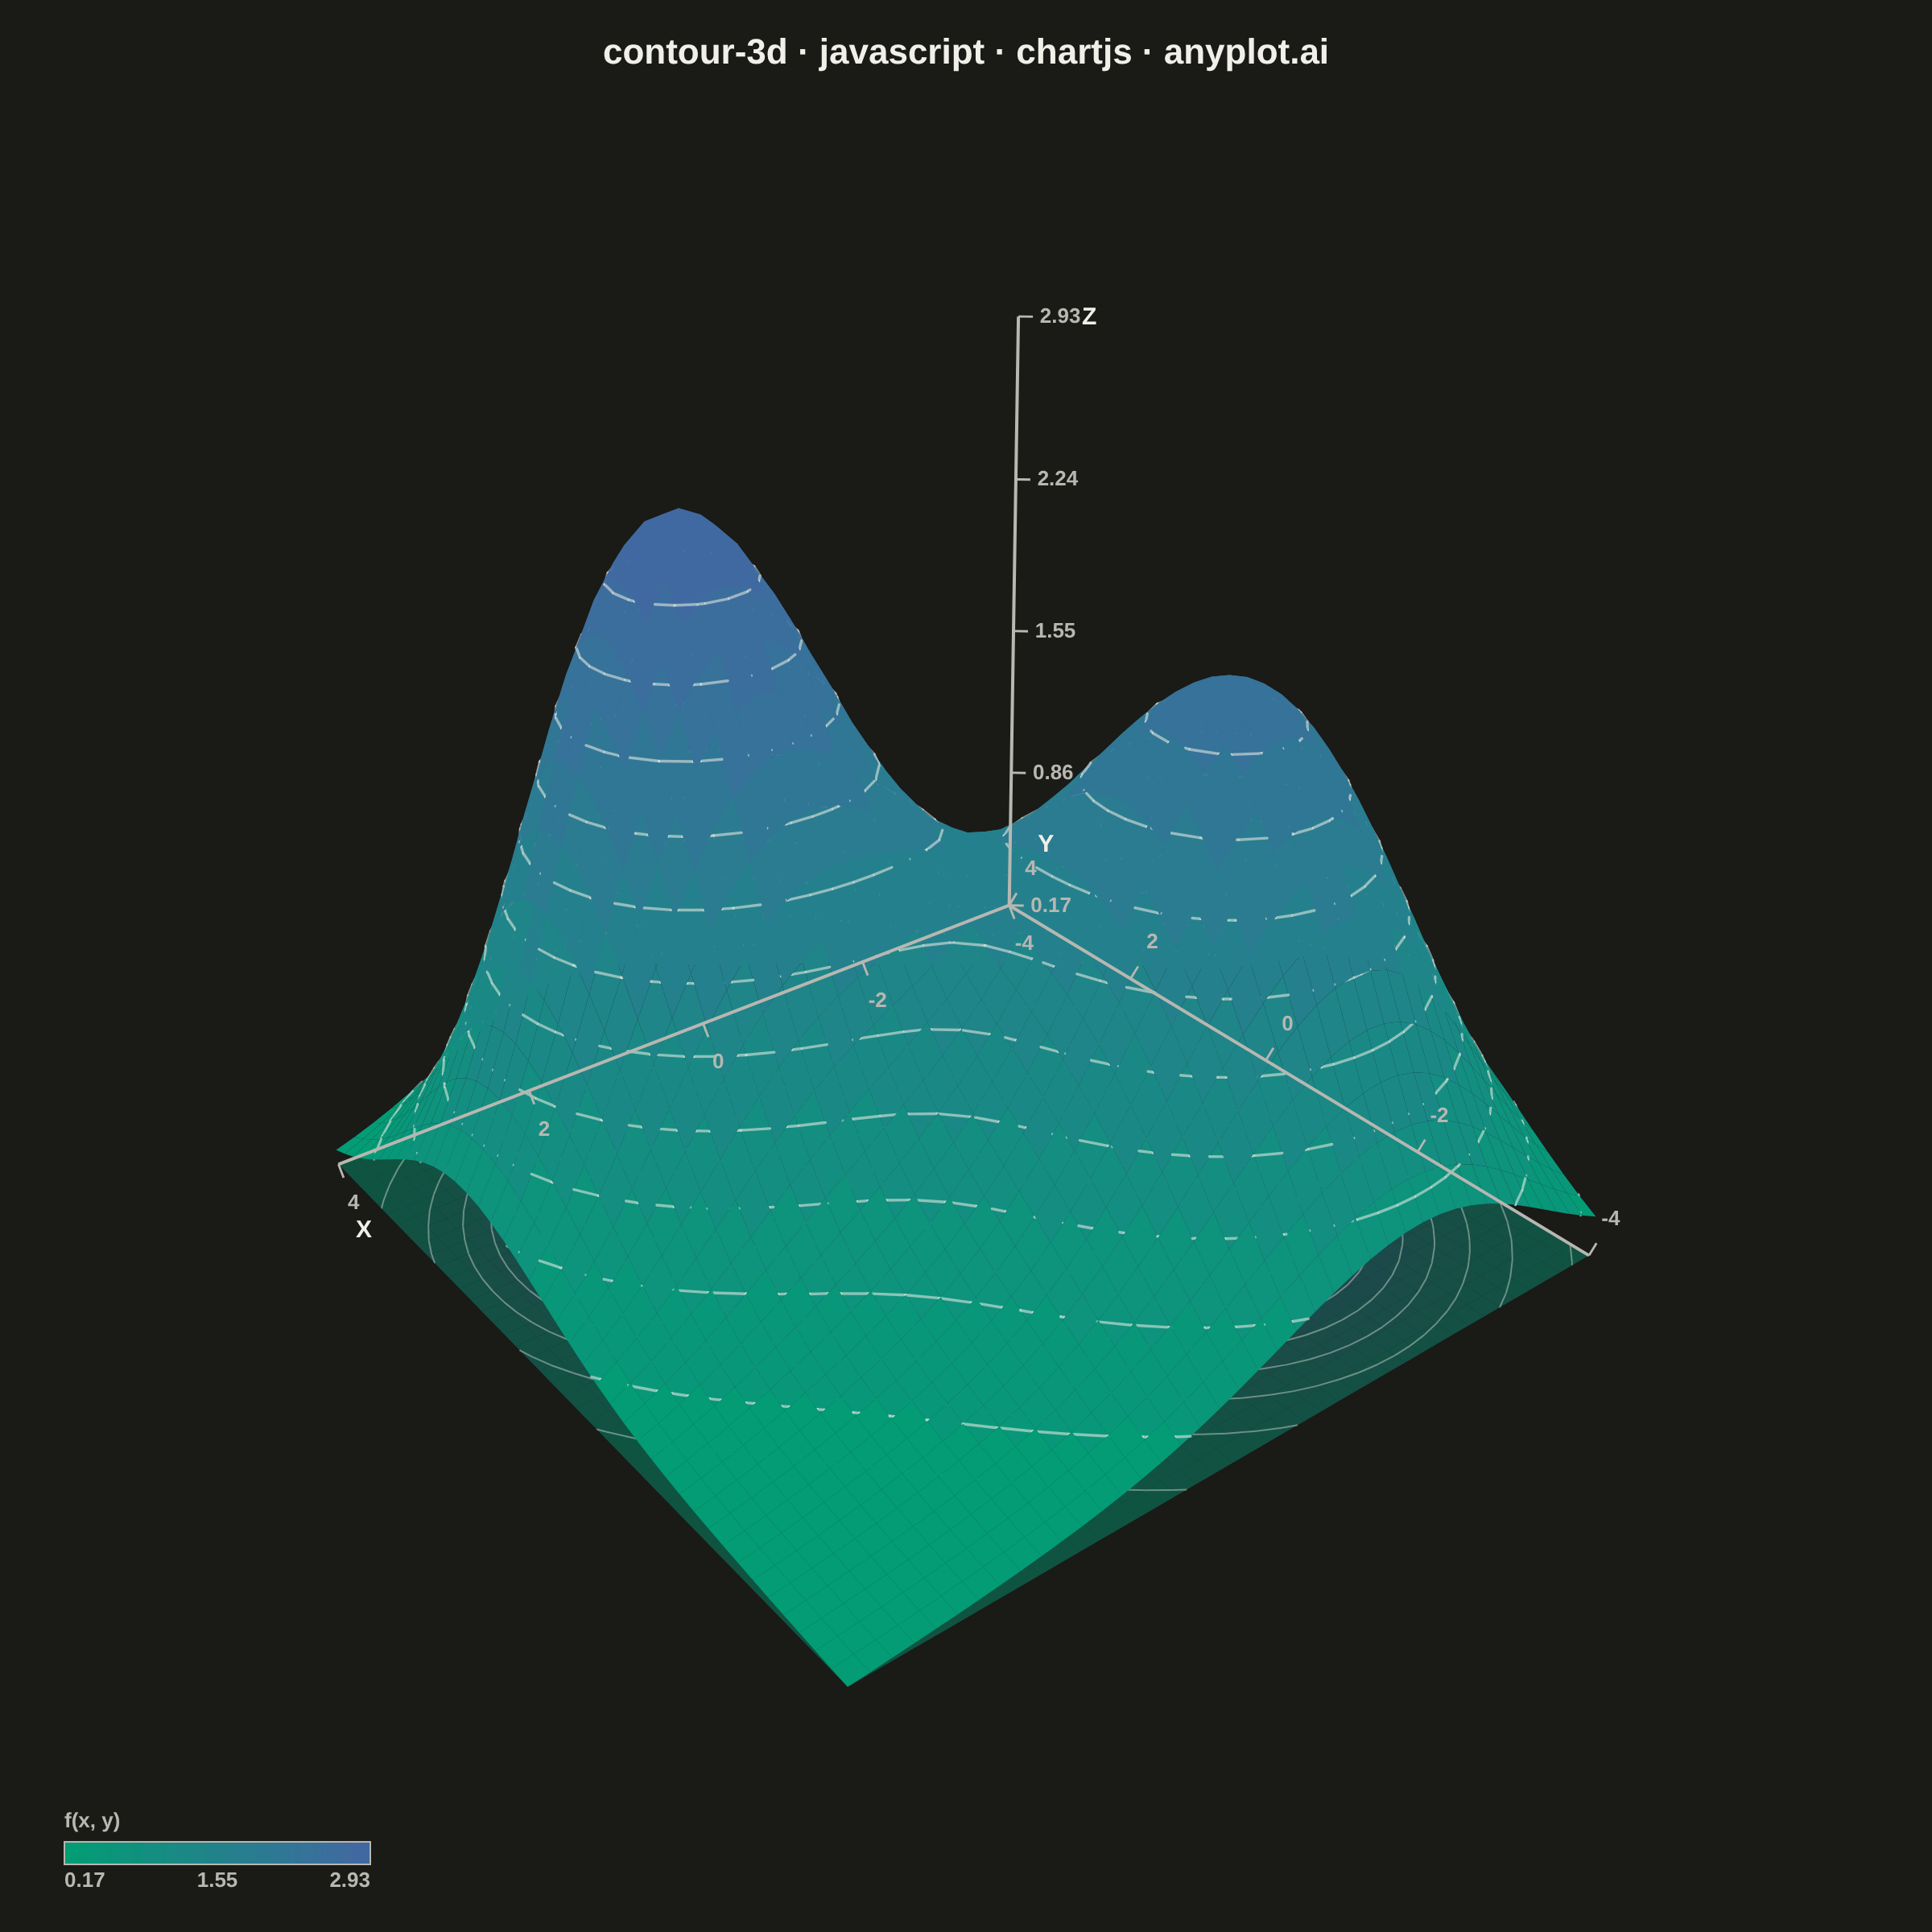
The same plot in 13 other libraries — JavaScript: D3.js, Apache ECharts, Highcharts, MUI X Charts; Python: Altair, Bokeh, lets-plot, Matplotlib, Plotly, Pygal, Seaborn; R: ggplot2; Julia: Makie.jl. Compare all 14 side by side: 3D Contour Plot in Python, R, Julia and JavaScript.
A 3D contour plot displays contour lines or filled contour bands on a three-dimensional surface, showing isolines of a function of two variables in 3D space. Unlike 2D contour plots that flatten the visualization, 3D contour plots preserve the surface geometry while highlighting level curves, making it easier to understand both the overall shape and specific value regions simultaneously. This visualization combines the spatial intuition of 3D surfaces with the precision of contour-based value identification.
// anyplot.ai
// contour-3d: 3D Contour Plot
// Library: chartjs 4.4.7 | JavaScript 22.23.2
// Quality: 92/100 | Created: 2026-09-10
//# anyplot-orientation: square

const t = window.ANYPLOT_TOKENS;
const INK = t.ink;
const INK_SOFT = t.inkSoft;

// --- Data: optimization landscape — two local maxima joined by a saddle ridge, so
// both the overall shape and specific level curves matter (spec application #1) --
const GRID_N = 42; // grid points per axis (spec recommends 30x30 - 50x50)
const X_MIN = -4, X_MAX = 4, Y_MIN = -4, Y_MAX = 4;

const bump = (x, y, cx, cy, sx, sy, amp) =>
  amp * Math.exp(-(((x - cx) ** 2) / (2 * sx * sx) + ((y - cy) ** 2) / (2 * sy * sy)));

const heightFn = (x, y) =>
  bump(x, y, 1.6, 1.5, 1.3, 1.3, 2.4) +
  bump(x, y, -1.8, -1.6, 1.5, 1.5, 1.9) +
  bump(x, y, 0, 0, 2.6, 2.6, 0.55) +
  0.12;

const xs = Array.from({ length: GRID_N }, (_, i) => X_MIN + ((X_MAX - X_MIN) * i) / (GRID_N - 1));
const ys = Array.from({ length: GRID_N }, (_, j) => Y_MIN + ((Y_MAX - Y_MIN) * j) / (GRID_N - 1));
const Z = ys.map((y) => xs.map((x) => heightFn(x, y)));

let zMin = Infinity, zMax = -Infinity;
for (const row of Z) for (const v of row) { if (v < zMin) zMin = v; if (v > zMax) zMax = v; }

// --- Normalize into a stable cube + camera (elevation/azimuth, true perspective) --
// Standard axonometric-camera technique: build a right/up/forward basis from
// elevation + azimuth, then divide by depth-along-view for perspective.
const xHalf = (X_MAX - X_MIN) / 2, xMid = (X_MAX + X_MIN) / 2;
const yHalf = (Y_MAX - Y_MIN) / 2, yMid = (Y_MAX + Y_MIN) / 2;
const zHalf = (zMax - zMin) / 2, zMid = (zMax + zMin) / 2;
const Z_SCALE = 0.85; // vertical exaggeration relative to the xy half-extent
const norm = (x, y, z) => [(x - xMid) / xHalf, (y - yMid) / yHalf, ((z - zMid) / zHalf) * Z_SCALE];

const ELEV_DEG = 30, AZIM_DEG = -52;
const elev = (ELEV_DEG * Math.PI) / 180;
const azim = (AZIM_DEG * Math.PI) / 180;
const camDir = [Math.cos(elev) * Math.cos(azim), Math.cos(elev) * Math.sin(azim), Math.sin(elev)];
const worldUp = [0, 0, 1];
const cross = (a, b) => [a[1] * b[2] - a[2] * b[1], a[2] * b[0] - a[0] * b[2], a[0] * b[1] - a[1] * b[0]];
const normalize = (a) => { const l = Math.hypot(a[0], a[1], a[2]); return [a[0] / l, a[1] / l, a[2] / l]; };
const right = normalize(cross(camDir, worldUp));
const camUp = cross(right, camDir);

const CAM_DIST = 5.0, FOCAL = 5.0;
const projectNorm = (nx, ny, nz) => {
  const px = nx * right[0] + ny * right[1] + nz * right[2];
  const py = nx * camUp[0] + ny * camUp[1] + nz * camUp[2];
  const pd = nx * camDir[0] + ny * camDir[1] + nz * camDir[2];
  const depth = CAM_DIST - pd;
  const scale = FOCAL / depth;
  return { x: px * scale, y: py * scale, depth, scale };
};
const project = (x, y, z) => projectNorm(...norm(x, y, z));

// --- Height -> Imprint sequential colour, quantized into discrete contour bands --
const hexToRgb = (h) => [1, 3, 5].map((i) => parseInt(h.slice(i, i + 2), 16));
const seqLo = hexToRgb(t.seq[0]), seqHi = hexToRgb(t.seq[1]);
const lerpRgb = (a, b, f) => a.map((v, i) => Math.round(v + (b[i] - v) * f));
const lerp = (a, b, f) => a + (b - a) * f;
const clamp = (v, lo, hi) => Math.min(hi, Math.max(lo, v));

const NUM_BANDS = 12;
const bandIndex = (z) => clamp(Math.floor(((z - zMin) / (zMax - zMin)) * NUM_BANDS), 0, NUM_BANDS - 1);
const bandColor = (z) => {
  const [r, g, b] = lerpRgb(seqLo, seqHi, (bandIndex(z) + 0.5) / NUM_BANDS);
  return `rgb(${r},${g},${b})`;
};

const isoThresholds = [];
for (let k = 1; k < NUM_BANDS; k++) isoThresholds.push(zMin + ((zMax - zMin) * k) / NUM_BANDS);

// --- Marching squares (same edge/segment convention as anyplot's 2D contour entries) --
// For each 4-bit corner code (BL=bit0, BR=bit1, TR=bit2, TL=bit3, 1=above threshold),
// which pairs of edge indices to connect as a line segment.
// Edges: 0=bottom (BL-BR), 1=right (BR-TR), 2=top (TL-TR), 3=left (BL-TL)
const SEG = [
  [], [[0, 3]], [[0, 1]], [[3, 1]], [[1, 2]], [[0, 3], [1, 2]], [[0, 2]], [[3, 2]],
  [[3, 2]], [[0, 2]], [[0, 1], [2, 3]], [[1, 2]], [[3, 1]], [[0, 1]], [[0, 3]], [],
];
const edgeXY = (e, i, j, z00, z10, z11, z01, thresh) => {
  switch (e) {
    case 0: return [lerp(xs[i], xs[i + 1], (thresh - z00) / (z10 - z00)), ys[j]];
    case 1: return [xs[i + 1], lerp(ys[j], ys[j + 1], (thresh - z10) / (z11 - z10))];
    case 2: return [lerp(xs[i], xs[i + 1], (thresh - z01) / (z11 - z01)), ys[j + 1]];
    case 3: return [xs[i], lerp(ys[j], ys[j + 1], (thresh - z00) / (z01 - z00))];
  }
};

// --- Build surface quads (painter's-algorithm depth) + on-surface isolines ------
const BASE_LINE_W = 1.6;
const drawItems = []; // { kind: "quad" | "line", ..., depth }

for (let j = 0; j < GRID_N - 1; j++) {
  for (let i = 0; i < GRID_N - 1; i++) {
    const z00 = Z[j][i], z10 = Z[j][i + 1], z11 = Z[j + 1][i + 1], z01 = Z[j + 1][i];
    const corners = [
      [xs[i], ys[j], z00], [xs[i + 1], ys[j], z10],
      [xs[i + 1], ys[j + 1], z11], [xs[i], ys[j + 1], z01],
    ];
    const pts = corners.map(([x, y, z]) => project(x, y, z));
    const depth = pts.reduce((s, p) => s + p.depth, 0) / 4;
    drawItems.push({ kind: "quad", pts, color: bandColor((z00 + z10 + z11 + z01) / 4), depth });

    for (const thresh of isoThresholds) {
      const code =
        (z00 >= thresh ? 1 : 0) | (z10 >= thresh ? 2 : 0) |
        (z11 >= thresh ? 4 : 0) | (z01 >= thresh ? 8 : 0);
      for (const [e0, e1] of SEG[code]) {
        const [x1, y1] = edgeXY(e0, i, j, z00, z10, z11, z01, thresh);
        const [x2, y2] = edgeXY(e1, i, j, z00, z10, z11, z01, thresh);
        const p1 = project(x1, y1, thresh), p2 = project(x2, y2, thresh);
        drawItems.push({
          kind: "line", p1, p2,
          width: BASE_LINE_W * clamp((p1.scale + p2.scale) / 2, 0.85, 1.3),
          depth: (p1.depth + p2.depth) / 2,
        });
      }
    }
  }
}
drawItems.sort((a, b) => b.depth - a.depth); // painter's algorithm: farthest first

// --- Floor reference: same band fill + isolines, flattened onto the base plane --
const floorQuads = [];
const floorLines = [];
for (let j = 0; j < GRID_N - 1; j++) {
  for (let i = 0; i < GRID_N - 1; i++) {
    const z00 = Z[j][i], z10 = Z[j][i + 1], z11 = Z[j + 1][i + 1], z01 = Z[j + 1][i];
    const pts = [[xs[i], ys[j]], [xs[i + 1], ys[j]], [xs[i + 1], ys[j + 1]], [xs[i], ys[j + 1]]]
      .map(([x, y]) => project(x, y, zMin));
    floorQuads.push({ pts, color: bandColor((z00 + z10 + z11 + z01) / 4) });

    for (const thresh of isoThresholds) {
      const code =
        (z00 >= thresh ? 1 : 0) | (z10 >= thresh ? 2 : 0) |
        (z11 >= thresh ? 4 : 0) | (z01 >= thresh ? 8 : 0);
      for (const [e0, e1] of SEG[code]) {
        const [x1, y1] = edgeXY(e0, i, j, z00, z10, z11, z01, thresh);
        const [x2, y2] = edgeXY(e1, i, j, z00, z10, z11, z01, thresh);
        floorLines.push({ p1: project(x1, y1, zMin), p2: project(x2, y2, zMin) });
      }
    }
  }
}

// --- Axis box: pick the farthest corner so axes sit behind the mesh -------------
let axisCorner = null, bestDepth = -Infinity;
for (const sx of [-1, 1]) for (const sy of [-1, 1]) for (const sz of [-1, 1]) {
  const d = projectNorm(sx, sy, sz * Z_SCALE).depth;
  if (d > bestDepth) { bestDepth = d; axisCorner = [sx, sy, sz]; }
}
const [cSignX, cSignY, cSignZ] = axisCorner;
const xAtCorner = cSignX > 0 ? X_MAX : X_MIN;
const yAtCorner = cSignY > 0 ? Y_MAX : Y_MIN;
const zAtCorner = cSignZ > 0 ? zMax : zMin;

const zTicks = [0, 1, 2, 3, 4].map((k) => +(zMin + ((zMax - zMin) * k) / 4).toFixed(2));
const axisEdges = [
  { from: [X_MIN, yAtCorner, zAtCorner], to: [X_MAX, yAtCorner, zAtCorner], ticks: [-4, -2, 0, 2, 4], label: "X", fmt: (v) => `${v}` },
  { from: [xAtCorner, Y_MIN, zAtCorner], to: [xAtCorner, Y_MAX, zAtCorner], ticks: [-4, -2, 0, 2, 4], label: "Y", fmt: (v) => `${v}` },
  { from: [xAtCorner, yAtCorner, zMin], to: [xAtCorner, yAtCorner, zMax], ticks: zTicks, label: "Z", fmt: (v) => v.toFixed(2) },
];

// --- Fit chart scales to the projected content (no clipping, no guessing) -------
let minX = Infinity, maxX = -Infinity, minY = Infinity, maxY = -Infinity;
const consider = (p) => { if (p.x < minX) minX = p.x; if (p.x > maxX) maxX = p.x; if (p.y < minY) minY = p.y; if (p.y > maxY) maxY = p.y; };
drawItems.forEach((it) => { if (it.kind === "quad") it.pts.forEach(consider); else { consider(it.p1); consider(it.p2); } });
floorQuads.forEach((q) => q.pts.forEach(consider));
axisEdges.forEach((e) => { consider(project(...e.from)); consider(project(...e.to)); });

const MARGIN = 0.32; // room for tick labels + axis titles outside the box
let halfX = ((maxX - minX) / 2) * (1 + MARGIN);
let halfY = ((maxY - minY) / 2) * (1 + MARGIN);
const midX = (minX + maxX) / 2, midY = (minY + maxY) / 2;
// This camera angle projects the cube into a roughly square bounding box — a square
// canvas (vs. the 16:9 default) keeps the surface undistorted and fills the frame.
const TARGET_ASPECT = 1.0;
if (halfX / halfY < TARGET_ASPECT) halfX = halfY * TARGET_ASPECT; else halfY = halfX / TARGET_ASPECT;

// --- Mount --------------------------------------------------------------
const canvas = document.createElement("canvas");
document.getElementById("container").appendChild(canvas);

// --- Plugin: floor contour map, depth-sorted surface + isolines, axis box, colorbar --
const contour3dPlugin = {
  id: "contour3d",
  beforeDatasetsDraw(chart) {
    const { ctx, scales: { x, y } } = chart;
    const toPx = (X, Y) => [x.getPixelForValue(X), y.getPixelForValue(Y)];
    const fillQuad = (pts, color, alpha) => {
      ctx.globalAlpha = alpha;
      ctx.fillStyle = color;
      ctx.beginPath();
      pts.forEach((p, k) => { const [px, py] = toPx(p.x, p.y); k === 0 ? ctx.moveTo(px, py) : ctx.lineTo(px, py); });
      ctx.closePath();
      ctx.fill();
    };

    // Floor: flattened contour-band map, muted, as a spatial reference (spec note).
    ctx.save();
    floorQuads.forEach((q) => fillQuad(q.pts, q.color, 0.45));
    ctx.globalAlpha = 0.4;
    ctx.strokeStyle = INK;
    ctx.lineWidth = 1;
    floorLines.forEach((s) => {
      const [ax, ay] = toPx(s.p1.x, s.p1.y), [bx, by] = toPx(s.p2.x, s.p2.y);
      ctx.beginPath(); ctx.moveTo(ax, ay); ctx.lineTo(bx, by); ctx.stroke();
    });
    ctx.restore();

    // Surface: depth-sorted contour bands + on-surface isolines, back-to-front.
    ctx.save();
    ctx.lineCap = "round";
    ctx.lineJoin = "round";
    for (const it of drawItems) {
      if (it.kind === "quad") {
        fillQuad(it.pts, it.color, 1);
      } else {
        ctx.globalAlpha = 0.55;
        ctx.strokeStyle = INK;
        ctx.lineWidth = it.width;
        const [ax, ay] = toPx(it.p1.x, it.p1.y), [bx, by] = toPx(it.p2.x, it.p2.y);
        ctx.beginPath(); ctx.moveTo(ax, ay); ctx.lineTo(bx, by); ctx.stroke();
      }
    }
    ctx.restore();

    // Axis box edges + ticks + labels (always on top of the mesh).
    ctx.save();
    ctx.globalAlpha = 1;
    ctx.strokeStyle = INK_SOFT;
    ctx.fillStyle = INK_SOFT;
    ctx.font = "600 13px -apple-system, Segoe UI, Roboto, sans-serif";
    ctx.textAlign = "center";
    ctx.textBaseline = "middle";
    const originPx = toPx(0, 0);

    for (const edge of axisEdges) {
      const pA = project(...edge.from), pB = project(...edge.to);
      const [ax, ay] = toPx(pA.x, pA.y), [bx, by] = toPx(pB.x, pB.y);
      ctx.lineWidth = 2;
      ctx.beginPath(); ctx.moveTo(ax, ay); ctx.lineTo(bx, by); ctx.stroke();

      const dx = bx - ax, dy = by - ay;
      const len = Math.hypot(dx, dy) || 1;
      let perpX = -dy / len, perpY = dx / len;
      const midx = (ax + bx) / 2, midy = (ay + by) / 2;
      if (perpX * (midx - originPx[0]) + perpY * (midy - originPx[1]) < 0) { perpX = -perpX; perpY = -perpY; }

      const tickSpan = edge.ticks[edge.ticks.length - 1] - edge.ticks[0];
      for (let k = 0; k < edge.ticks.length; k++) {
        const f = (edge.ticks[k] - edge.ticks[0]) / tickSpan;
        const px3 = edge.from[0] + (edge.to[0] - edge.from[0]) * f;
        const py3 = edge.from[1] + (edge.to[1] - edge.from[1]) * f;
        const pz3 = edge.from[2] + (edge.to[2] - edge.from[2]) * f;
        const pt = project(px3, py3, pz3);
        const [tx, ty] = toPx(pt.x, pt.y);
        ctx.lineWidth = 1.4;
        ctx.beginPath(); ctx.moveTo(tx, ty); ctx.lineTo(tx + perpX * 9, ty + perpY * 9); ctx.stroke();
        ctx.fillText(edge.fmt(edge.ticks[k]), tx + perpX * 26, ty + perpY * 26);
      }

      ctx.save();
      ctx.font = "700 15px -apple-system, Segoe UI, Roboto, sans-serif";
      ctx.fillStyle = INK;
      ctx.fillText(edge.label, bx + perpX * 44, by + perpY * 44);
      ctx.restore();
    }
    ctx.restore();
  },

  afterDatasetsDraw(chart) {
    const { ctx, chartArea } = chart;
    ctx.save();
    const keyX = chartArea.left + 24;
    const keyY = chartArea.bottom - 40;
    const keyW = 190, keyH = 14;
    const grad = ctx.createLinearGradient(keyX, 0, keyX + keyW, 0);
    grad.addColorStop(0, t.seq[0]);
    grad.addColorStop(1, t.seq[1]);
    ctx.fillStyle = grad;
    ctx.fillRect(keyX, keyY, keyW, keyH);
    ctx.strokeStyle = INK_SOFT;
    ctx.lineWidth = 1;
    ctx.strokeRect(keyX, keyY, keyW, keyH);

    ctx.font = "600 13px -apple-system, Segoe UI, Roboto, sans-serif";
    ctx.fillStyle = INK_SOFT;
    ctx.textBaseline = "bottom";
    ctx.textAlign = "left";
    ctx.fillText("f(x, y)", keyX, keyY - 6);
    ctx.textBaseline = "top";
    ctx.textAlign = "left";
    ctx.fillText(zMin.toFixed(2), keyX, keyY + keyH + 4);
    ctx.textAlign = "center";
    ctx.fillText(((zMin + zMax) / 2).toFixed(2), keyX + keyW / 2, keyY + keyH + 4);
    ctx.textAlign = "right";
    ctx.fillText(zMax.toFixed(2), keyX + keyW, keyY + keyH + 4);
    ctx.restore();
  },
};

// --- Chart --------------------------------------------------------------
new Chart(canvas, {
  type: "scatter",
  data: { datasets: [{ data: [], showLine: false, pointRadius: 0 }] },
  options: {
    responsive: true,
    maintainAspectRatio: false,
    animation: false,
    layout: { padding: 16 },
    plugins: {
      title: {
        display: true,
        text: "contour-3d · javascript · chartjs · anyplot.ai",
        color: INK,
        font: { size: 22, weight: "600" },
        padding: { top: 4, bottom: 14 },
      },
      legend: { display: false },
      tooltip: { enabled: false },
    },
    scales: {
      x: { type: "linear", min: midX - halfX, max: midX + halfX, display: false },
      y: { type: "linear", min: midY - halfY, max: midY + halfY, display: false },
    },
  },
  plugins: [contour3dPlugin],
});
Runnable source as JSON, for any HTTP client: https://api.anyplot.ai/specs/contour-3d/chartjs/code. Any spec id and library id listed in llms-full.txt fit the same URL shape; every URL below is complete and callable.
{
  "spec_id": "contour-3d",
  "language": "javascript",
  "library": "chartjs",
  "page": "https://anyplot.ai/contour-3d/javascript/chartjs",
  "hub": "https://anyplot.ai/contour-3d",
  "code_json": "https://api.anyplot.ai/specs/contour-3d/chartjs/code",
  "spec_json": "https://api.anyplot.ai/specs/contour-3d",
  "render_light_png": "https://storage.googleapis.com/anyplot-images/plots/contour-3d/javascript/chartjs/plot-light.png",
  "render_dark_png": "https://storage.googleapis.com/anyplot-images/plots/contour-3d/javascript/chartjs/plot-dark.png",
  "interactive_light_html": "https://storage.googleapis.com/anyplot-images/plots/contour-3d/javascript/chartjs/plot-light.html",
  "interactive_dark_html": "https://storage.googleapis.com/anyplot-images/plots/contour-3d/javascript/chartjs/plot-dark.html",
  "quality_score": 92.0,
  "license": "MIT",
  "guide": "https://anyplot.ai/llms.txt"
}
Part of 3D Contour Plot on anyplot.ai.